Statistiques de base
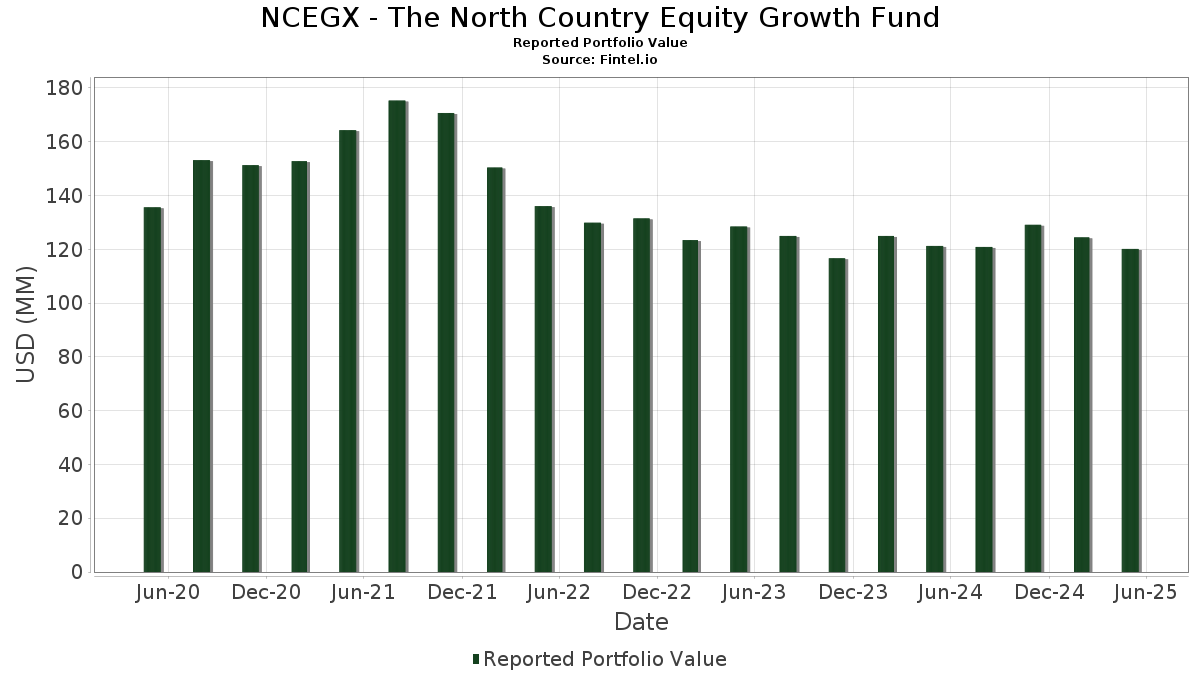
| Valeur du portefeuille | $ 120 134 518 |
| Positions actuelles | 63 |
Dernières positions, performances, ASG (à partir des dépôts 13F, 13D)
NCEGX - The North Country Equity Growth Fund a déclaré un total de 63 positions dans ses derniers dépôts auprès de la SEC. La valeur la plus récente du portefeuille est calculée à 120 134 518 USD. Les actifs sous gestion réels (ASG) sont cette valeur plus les liquidités (qui ne sont pas divulguées). Les principales positions de NCEGX - The North Country Equity Growth Fund sont Microsoft Corporation (US:MSFT) , NVIDIA Corporation (US:NVDA) , Apple Inc. (US:AAPL) , Amazon.com, Inc. (US:AMZN) , and Alphabet Inc. (US:GOOGL) . Les nouvelles positions de NCEGX - The North Country Equity Growth Fund incluent KKR & Co. Inc. (US:KKR) , BLACKROCK TREASURY TRUST 062 (US:US09248U5517) , .
Meilleures augmentations ce trimestre
Nous utilisons la variation de l'allocation du portefeuille car il s'agit de l'indicateur le plus significatif. Les changements peuvent être dus à des transactions ou à des variations de prix des actions.
| Titre | Actions (en millions) |
Valeur ($ en millions) |
% du portefeuille | ΔPortefeuille % |
|---|---|---|---|---|
| 0,01 | 1,82 | 1,5152 | 1,5152 | |
| 0,02 | 9,37 | 7,7913 | 1,3042 | |
| 0,07 | 8,92 | 7,4172 | 0,7969 | |
| 0,03 | 2,34 | 1,9446 | 0,5541 | |
| 0,00 | 2,05 | 1,7068 | 0,3683 | |
| 0,00 | 1,46 | 1,2102 | 0,2221 | |
| 0,01 | 2,11 | 1,7546 | 0,2106 | |
| 0,03 | 4,77 | 3,9707 | 0,1695 | |
| 0,01 | 2,04 | 1,6966 | 0,1581 | |
| 0,03 | 2,08 | 1,7311 | 0,1241 |
Principales baisses ce trimestre
Nous utilisons la variation de l'allocation du portefeuille car il s'agit de l'indicateur le plus significatif. Les changements peuvent être dus à des transactions ou à des variations de prix des actions.
| Titre | Actions (en millions) |
Valeur ($ en millions) |
% du portefeuille | ΔPortefeuille % |
|---|---|---|---|---|
| 0,04 | 8,07 | 6,7150 | -1,0916 | |
| 0,89 | 0,7402 | -0,5570 | ||
| 0,00 | 2,51 | 2,0859 | -0,4276 | |
| 0,00 | 0,97 | 0,8035 | -0,4170 | |
| 0,00 | 1,25 | 1,0385 | -0,2782 | |
| 0,03 | 1,72 | 1,4276 | -0,2325 | |
| 0,01 | 2,63 | 2,1849 | -0,1829 | |
| 0,01 | 0,92 | 0,7653 | -0,0974 | |
| 0,01 | 2,87 | 2,3891 | -0,0949 | |
| 0,01 | 0,90 | 0,7503 | -0,0903 |
Déclarations 13F et dépôts de fonds
Ce formulaire a été déposé le 2025-06-26 pour la période de déclaration 2025-05-31. Cliquez sur l'icône du lien pour voir l'historique complet des transactions.
Mettre à niveau pour débloquer les données premium et exporter vers Excel ![]() .
.
| Titre | Type | Prix moyen de l'action | Actions (en millions) |
ΔActions (%) |
ΔActions (%) |
Valeur ($ en millions) |
Portefeuille (%) |
ΔPortefeuille (%) |
|
|---|---|---|---|---|---|---|---|---|---|
| MSFT / Microsoft Corporation | 0,02 | 0,00 | 9,37 | 15,97 | 7,7913 | 1,3042 | |||
| NVDA / NVIDIA Corporation | 0,07 | 0,00 | 8,92 | 8,18 | 7,4172 | 0,7969 | |||
| AAPL / Apple Inc. | 0,04 | 0,00 | 8,07 | -16,94 | 6,7150 | -1,0916 | |||
| AMZN / Amazon.com, Inc. | 0,03 | 0,00 | 5,19 | -3,43 | 4,3136 | 0,0011 | |||
| GOOGL / Alphabet Inc. | 0,03 | 0,00 | 4,77 | 0,87 | 3,9707 | 0,1695 | |||
| META / Meta Platforms, Inc. | 0,01 | 0,00 | 3,56 | -3,10 | 2,9617 | 0,0107 | |||
| JPM / JPMorgan Chase & Co. | 0,01 | 0,00 | 3,30 | -0,24 | 2,7445 | 0,0881 | |||
| HD / The Home Depot, Inc. | 0,01 | 0,00 | 2,87 | -7,15 | 2,3891 | -0,0949 | |||
| WMT / Walmart Inc. | 0,03 | 0,00 | 2,78 | 0,11 | 2,3153 | 0,0823 | |||
| CRM / Salesforce, Inc. | 0,01 | 0,00 | 2,63 | -10,89 | 2,1849 | -0,1829 | |||
| BRK.B / Berkshire Hathaway Inc. | 0,01 | 0,00 | 2,57 | -1,91 | 2,1375 | 0,0333 | |||
| LLY / Eli Lilly and Company | 0,00 | 0,00 | 2,51 | -19,87 | 2,0859 | -0,4276 | |||
| BAC / Bank of America Corporation | 0,06 | 0,00 | 2,45 | -4,26 | 2,0369 | -0,0176 | |||
| APH / Amphenol Corporation | 0,03 | 0,00 | 2,34 | 35,07 | 1,9446 | 0,5541 | |||
| CAT / Caterpillar Inc. | 0,01 | 0,00 | 2,19 | 1,20 | 1,8235 | 0,0835 | |||
| BLK / BlackRock, Inc. | 0,00 | 0,00 | 2,16 | 0,19 | 1,7929 | 0,0656 | |||
| DLR / Digital Realty Trust, Inc. | 0,01 | 0,00 | 2,11 | 9,73 | 1,7546 | 0,2106 | |||
| V / Visa Inc. | 0,01 | 0,00 | 2,08 | 0,68 | 1,7312 | 0,0710 | |||
| WMB / The Williams Companies, Inc. | 0,03 | 0,00 | 2,08 | 4,00 | 1,7311 | 0,1241 | |||
| PG / The Procter & Gamble Company | 0,01 | 0,00 | 2,06 | -2,28 | 1,7132 | 0,0206 | |||
| NFLX / Netflix, Inc. | 0,00 | 0,00 | 2,05 | 23,17 | 1,7068 | 0,3683 | |||
| ICE / Intercontinental Exchange, Inc. | 0,01 | 0,00 | 2,04 | 3,76 | 1,6972 | 0,1184 | |||
| HON / Honeywell International Inc. | 0,01 | 0,00 | 2,04 | 6,47 | 1,6966 | 0,1581 | |||
| WM / Waste Management, Inc. | 0,01 | 0,00 | 1,93 | 3,49 | 1,6032 | 0,1079 | |||
| ADBE / Adobe Inc. | 0,00 | 0,00 | 1,83 | -5,34 | 1,5189 | -0,0305 | |||
| KKR / KKR & Co. Inc. | 0,01 | 1,82 | 1,5152 | 1,5152 | |||||
| ORCL / Oracle Corporation | 0,01 | 0,00 | 1,82 | -0,33 | 1,5143 | 0,0475 | |||
| ABT / Abbott Laboratories | 0,01 | 0,00 | 1,74 | -3,23 | 1,4442 | 0,0036 | |||
| MAS / Masco Corporation | 0,03 | 0,00 | 1,72 | -16,98 | 1,4276 | -0,2325 | |||
| SYK / Stryker Corporation | 0,00 | 0,00 | 1,65 | -0,90 | 1,3684 | 0,0349 | |||
| GS / The Goldman Sachs Group, Inc. | 0,00 | 0,00 | 1,56 | -3,46 | 1,2984 | -0,0008 | |||
| JNJ / Johnson & Johnson | 0,01 | 0,00 | 1,47 | -5,93 | 1,2263 | -0,0325 | |||
| COST / Costco Wholesale Corporation | 0,00 | 0,00 | 1,46 | -0,82 | 1,2111 | 0,0323 | |||
| TSLA / Tesla, Inc. | 0,00 | 0,00 | 1,46 | 18,29 | 1,2102 | 0,2221 | |||
| MS / Morgan Stanley | 0,01 | 0,00 | 1,45 | -3,86 | 1,2032 | -0,0046 | |||
| AMGN / Amgen Inc. | 0,00 | 0,00 | 1,35 | -6,43 | 1,1264 | -0,0362 | |||
| TJX / The TJX Companies, Inc. | 0,01 | 0,00 | 1,35 | 1,74 | 1,1187 | 0,0568 | |||
| COF / Capital One Financial Corporation | 0,01 | 0,00 | 1,29 | -5,65 | 1,0697 | -0,0254 | |||
| TMO / Thermo Fisher Scientific Inc. | 0,00 | 0,00 | 1,25 | -23,86 | 1,0385 | -0,2782 | |||
| IR / Ingersoll Rand Inc. | 0,01 | 0,00 | 1,17 | -3,71 | 0,9709 | -0,0026 | |||
| VRTX / Vertex Pharmaceuticals Incorporated | 0,00 | 0,00 | 0,97 | -7,87 | 0,8088 | -0,0388 | |||
| UNH / UnitedHealth Group Incorporated | 0,00 | 0,00 | 0,97 | -36,41 | 0,8035 | -0,4170 | |||
| PEP / PepsiCo, Inc. | 0,01 | 0,00 | 0,92 | -14,34 | 0,7653 | -0,0974 | |||
| CVX / Chevron Corporation | 0,01 | 0,00 | 0,90 | -13,77 | 0,7503 | -0,0903 | |||
| US09248U5517 / BLACKROCK TREASURY TRUST 062 | 0,89 | -44,95 | 0,7402 | -0,5570 | |||||
| XOM / Exxon Mobil Corporation | 0,01 | 0,00 | 0,84 | -8,11 | 0,6976 | -0,0354 | |||
| SO / The Southern Company | 0,01 | 0,00 | 0,82 | 0,24 | 0,6849 | 0,0252 | |||
| MCD / McDonald's Corporation | 0,00 | 0,00 | 0,82 | 1,87 | 0,6786 | 0,0349 | |||
| SHW / The Sherwin-Williams Company | 0,00 | 0,00 | 0,77 | -0,90 | 0,6416 | 0,0162 | |||
| APD / Air Products and Chemicals, Inc. | 0,00 | 0,00 | 0,75 | -11,72 | 0,6263 | -0,0591 | |||
| DHR / Danaher Corporation | 0,00 | 0,00 | 0,72 | -8,62 | 0,6001 | -0,0338 | |||
| PANW / Palo Alto Networks, Inc. | 0,00 | 0,00 | 0,62 | 0,99 | 0,5121 | 0,0228 | |||
| PSA / Public Storage | 0,00 | 0,00 | 0,59 | 1,56 | 0,4873 | 0,0241 | |||
| SYY / Sysco Corporation | 0,01 | 0,00 | 0,55 | -3,36 | 0,4553 | 0,0004 | |||
| AMT / American Tower Corporation | 0,00 | 0,00 | 0,50 | 4,35 | 0,4195 | 0,0315 | |||
| AWK / American Water Works Company, Inc. | 0,00 | 0,00 | 0,43 | 5,16 | 0,3567 | 0,0292 | |||
| HSY / The Hershey Company | 0,00 | 0,00 | 0,42 | -7,13 | 0,3475 | -0,0131 | |||
| ECL / Ecolab Inc. | 0,00 | 0,00 | 0,40 | -1,24 | 0,3314 | 0,0073 | |||
| NEE / NextEra Energy, Inc. | 0,01 | 0,00 | 0,39 | 0,78 | 0,3231 | 0,0132 | |||
| VMC / Vulcan Materials Company | 0,00 | 0,00 | 0,29 | 6,99 | 0,2425 | 0,0240 | |||
| S&P500 EMINI FUT Jun25 / DE (N/A) | 0,09 | 0,0749 | 0,0749 | ||||||
| MRP / Millrose Properties, Inc. | 0,00 | 0,00 | 0,05 | 21,62 | 0,0382 | 0,0080 | |||
| US 10YR NOTE (CBT)Sep25 / DIR (N/A) | 0,01 | 0,0051 | 0,0051 |