Statistiques de base
| Valeur du portefeuille | $ 50 969 000 |
| Positions actuelles | 64 |
Dernières positions, performances, ASG (à partir des dépôts 13F, 13D)
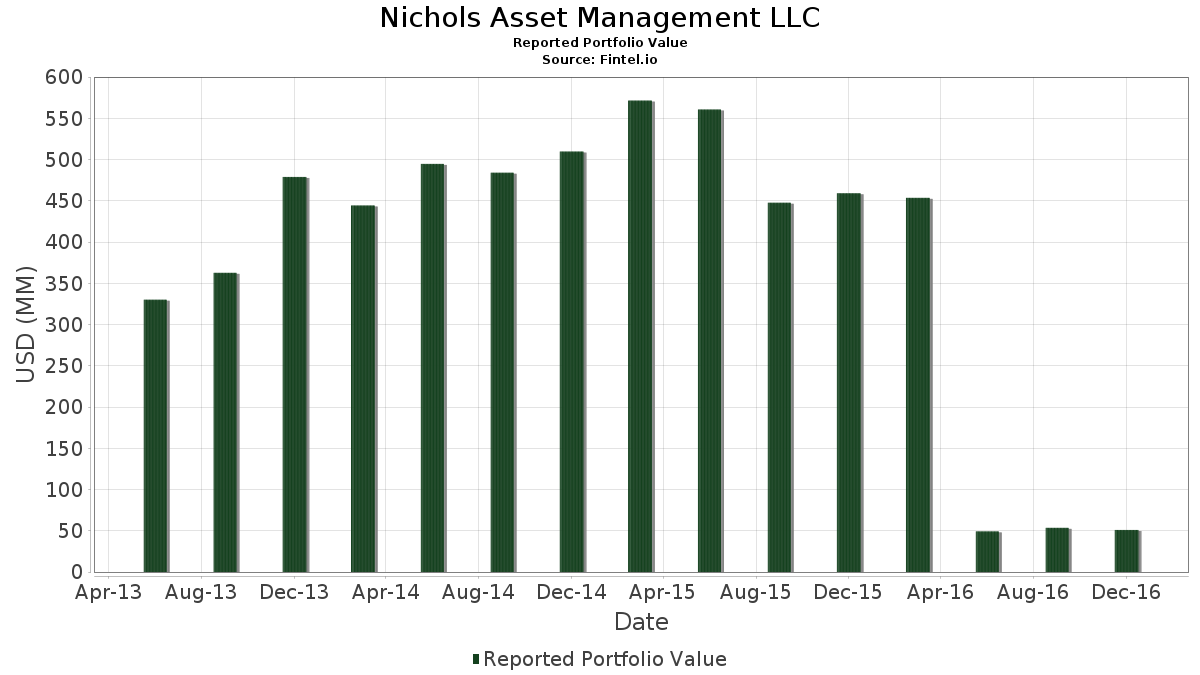
Nichols Asset Management LLC a déclaré un total de 64 positions dans ses derniers dépôts auprès de la SEC. La valeur la plus récente du portefeuille est calculée à 50 969 000 USD. Les actifs sous gestion réels (ASG) sont cette valeur plus les liquidités (qui ne sont pas divulguées). Les principales positions de Nichols Asset Management LLC sont iShares Trust - iShares Preferred and Income Securities ETF (US:PFF) , SPDR Series Trust - SPDR Bloomberg High Yield Bond ETF (US:JNK) , SPDR S&P 500 ETF (US:SPY) , Invesco QQQ Trust, Series 1 (US:QQQ) , and iShares Trust - iShares Select Dividend ETF (US:DVY) .
Meilleures augmentations ce trimestre
Nous utilisons la variation de l'allocation du portefeuille car il s'agit de l'indicateur le plus significatif. Les changements peuvent être dus à des transactions ou à des variations de prix des actions.
| Titre | Actions (en millions) |
Valeur ($ en millions) |
% du portefeuille | ΔPortefeuille % |
|---|---|---|---|---|
| 0,02 | 2,33 | 4,5714 | 4,5714 | |
| 0,00 | 0,57 | 1,1144 | 1,1144 | |
| 0,01 | 0,55 | 1,0771 | 1,0771 | |
| 0,00 | 0,53 | 1,0398 | 1,0398 | |
| 0,15 | 5,37 | 10,5260 | 0,4294 | |
| 0,00 | 0,21 | 0,4120 | 0,4120 | |
| 0,01 | 2,66 | 5,2169 | 0,4105 | |
| 0,01 | 0,59 | 1,1497 | 0,3072 | |
| 0,02 | 1,64 | 3,2255 | 0,2535 | |
| 0,01 | 0,92 | 1,8109 | 0,1783 |
Principales baisses ce trimestre
Nous utilisons la variation de l'allocation du portefeuille car il s'agit de l'indicateur le plus significatif. Les changements peuvent être dus à des transactions ou à des variations de prix des actions.
| Titre | Actions (en millions) |
Valeur ($ en millions) |
% du portefeuille | ΔPortefeuille % |
|---|---|---|---|---|
| 0,00 | 0,00 | -0,8705 | ||
| 0,00 | 0,33 | 0,6475 | -0,4453 | |
| 0,00 | 0,00 | -0,4390 | ||
| 0,00 | 0,00 | -0,3923 | ||
| 0,00 | 0,35 | 0,6867 | -0,3146 | |
| 0,00 | 0,26 | 0,5140 | -0,2612 | |
| 0,02 | 0,95 | 1,8698 | -0,2392 | |
| 0,15 | 5,45 | 10,6830 | -0,1141 | |
| 0,01 | 0,33 | 0,6514 | -0,1052 | |
| 0,00 | 0,58 | 1,1478 | -0,0833 |
Déclarations 13F et dépôts de fonds
Ce formulaire a été déposé le 2017-02-10 pour la période de déclaration 2016-12-31. Cliquez sur l'icône du lien pour voir l'historique complet des transactions.
Mettre à niveau pour débloquer les données premium et exporter vers Excel ![]() .
.
| Titre | Type | Prix moyen de l'action | Actions (en millions) |
ΔActions (%) |
ΔActions (%) |
Valeur ($ en millions) |
Portefeuille (%) |
ΔPortefeuille (%) |
|
|---|---|---|---|---|---|---|---|---|---|
| PFF / iShares Trust - iShares Preferred and Income Securities ETF | 0,15 | 0,00 | 5,45 | -5,80 | 10,6830 | -0,1141 | |||
| JNK / SPDR Series Trust - SPDR Bloomberg High Yield Bond ETF | 0,15 | 0,00 | 5,37 | -0,74 | 10,5260 | 0,4294 | |||
| SPY / SPDR S&P 500 ETF | 0,01 | 0,00 | 2,66 | 3,34 | 5,2169 | 0,4105 | |||
| Dow Jones Industrial Avg ETF / (252787106) | 0,01 | 0,00 | 2,51 | 8,04 | 0,0000 | ||||
| QQQ / Invesco QQQ Trust, Series 1 | 0,02 | -16,65 | 2,33 | -16,85 | 4,5714 | 4,5714 | |||
| DVY / iShares Trust - iShares Select Dividend ETF | 0,02 | 0,00 | 1,64 | 3,33 | 3,2255 | 0,2535 | |||
| MMC / Marsh & McLennan Companies, Inc. | 0,02 | 0,00 | 1,60 | 0,50 | 3,1313 | 0,1649 | |||
| IGSB / iShares Trust - iShares 1-5 Year Investment Grade Corporate Bond ETF | 0,01 | 0,00 | 1,37 | -0,80 | 2,6859 | 0,1081 | |||
| INTC / Intel Corporation | 0,03 | 0,00 | 1,01 | -3,91 | 1,9777 | 0,0181 | |||
| MMM / 3M Company | 0,01 | 0,00 | 1,01 | 1,31 | 1,9757 | 0,1189 | |||
| JNJ / Johnson & Johnson | 0,01 | 0,96 | 0,97 | -1,53 | 1,8992 | 0,0629 | |||
| CNC / Centene Corporation | 0,02 | 0,00 | 0,95 | -15,59 | 1,8698 | -0,2392 | |||
| MCD / McDonald's Corporation | 0,01 | 0,00 | 0,92 | 5,61 | 1,8109 | 0,1783 | |||
| BDX / Becton, Dickinson and Company | 0,00 | 0,00 | 0,81 | -7,93 | 1,5951 | -0,0544 | |||
| GE / General Electric Company | 0,03 | 0,00 | 0,81 | 6,75 | 1,5833 | 0,1711 | |||
| RTX / RTX Corporation | 0,01 | 0,00 | 0,77 | 7,80 | 1,5186 | 0,1773 | |||
| NVS / Novartis AG - Depositary Receipt (Common Stock) | 0,01 | 0,00 | 0,75 | -7,64 | 1,4715 | -0,0453 | |||
| PEP / PepsiCo, Inc. | 0,01 | 0,00 | 0,72 | -3,88 | 1,4087 | 0,0133 | |||
| NSRGY / Nestlé S.A. - Depositary Receipt (Common Stock) | 0,01 | 0,00 | 0,71 | -9,10 | 1,3910 | -0,0660 | |||
| GIS / General Mills, Inc. | 0,01 | 0,00 | 0,63 | -3,35 | 1,2439 | 0,0185 | |||
| ROP / Roper Technologies, Inc. | 0,00 | 0,00 | 0,63 | 0,32 | 1,2341 | 0,0628 | |||
| ABBV / AbbVie Inc. | 0,01 | 0,00 | 0,61 | -0,81 | 1,2007 | 0,0482 | |||
| TJX / The TJX Companies, Inc. | 0,01 | 0,00 | 0,61 | 0,50 | 1,1948 | 0,0628 | |||
| SF / Stifel Financial Corp. | 0,01 | 0,00 | 0,59 | 29,93 | 1,1497 | 0,3072 | |||
| TMO / Thermo Fisher Scientific Inc. | 0,00 | 0,00 | 0,58 | -11,23 | 1,1478 | -0,0833 | |||
| IWM / iShares Trust - iShares Russell 2000 ETF | 0,00 | 0,00 | 0,57 | 8,40 | 1,1144 | 1,1144 | |||
| PUK / Prudential plc - Depositary Receipt (Common Stock) | 0,01 | 0,00 | 0,55 | 11,36 | 1,0771 | 1,0771 | |||
| UNP / Union Pacific Corporation | 0,01 | 0,00 | 0,55 | 6,43 | 1,0712 | 0,1130 | |||
| BFFAF / BASF SE | 0,01 | 0,00 | 0,54 | 8,25 | 1,0555 | 0,1271 | |||
| WPPGY / WPP PLC | 0,00 | 0,00 | 0,53 | -5,86 | 1,0398 | 1,0398 | |||
| ES / Eversource Energy | 0,01 | 0,00 | 0,53 | 1,94 | 1,0300 | 0,0680 | |||
| BIIB / Biogen Inc. | 0,00 | 0,00 | 0,52 | -9,52 | 1,0261 | -0,0536 | |||
| MSFT / Microsoft Corporation | 0,01 | 0,00 | 0,52 | 7,85 | 1,0242 | 0,1200 | |||
| SYY / Sysco Corporation | 0,01 | 0,00 | 0,52 | 12,91 | 1,0124 | 0,1587 | |||
| WMT / Walmart Inc. | 0,01 | 0,00 | 0,50 | -4,18 | 0,9888 | 0,0063 | |||
| KMB / Kimberly-Clark Corporation | 0,00 | 0,00 | 0,50 | -9,55 | 0,9849 | -0,0518 | |||
| AMT / American Tower Corporation | 0,00 | 0,00 | 0,48 | -6,67 | 0,9339 | -0,0188 | |||
| AMZN / Amazon.com, Inc. | 0,00 | 0,00 | 0,45 | -10,36 | 0,8829 | -0,0548 | |||
| SYT / SYLA Technologies Co., Ltd. - Depositary Receipt (Common Stock) | 0,01 | 0,00 | 0,45 | -9,70 | 0,8770 | -0,0477 | |||
| AMGN / Amgen Inc. | 0,00 | 0,00 | 0,42 | -12,24 | 0,8162 | -0,0693 | |||
| FUJHY / Subaru Corporation - Depositary Receipt (Common Stock) | 0,02 | 300,00 | 0,41 | 8,49 | 0,8024 | 0,0982 | |||
| FDX / FedEx Corporation | 0,00 | 0,00 | 0,39 | 6,78 | 0,7730 | 0,0837 | |||
| ABT / Abbott Laboratories | 0,01 | 0,00 | 0,39 | -9,20 | 0,7554 | -0,0367 | |||
| NEE / NextEra Energy, Inc. | 0,00 | 0,00 | 0,38 | -2,30 | 0,7495 | 0,0191 | |||
| TSM / Taiwan Semiconductor Manufacturing Company Limited - Depositary Receipt (Common Stock) | 0,01 | 0,00 | 0,35 | -6,13 | 0,6906 | -0,0099 | |||
| V / Visa Inc. | 0,00 | -30,86 | 0,35 | -34,70 | 0,6867 | -0,3146 | |||
| CSCO / Cisco Systems, Inc. | 0,01 | 0,00 | 0,33 | -4,86 | 0,6533 | -0,0005 | |||
| NGG / National Grid plc - Depositary Receipt (Common Stock) | 0,01 | 0,00 | 0,33 | -18,02 | 0,6514 | -0,1052 | |||
| CVS / CVS Health Corporation | 0,00 | -36,50 | 0,33 | -43,59 | 0,6475 | -0,4453 | |||
| Power Assets ADR / (438580300) | 0,04 | 0,00 | 0,33 | -11,38 | 0,0000 | ||||
| CVX / Chevron Corporation | 0,00 | 0,00 | 0,33 | 14,34 | 0,6416 | 0,1073 | |||
| XOM / Exxon Mobil Corporation | 0,00 | 0,00 | 0,32 | 3,51 | 0,6357 | 0,0510 | |||
| SIEGY / Siemens Aktiengesellschaft - Depositary Receipt (Common Stock) | 0,00 | 0,00 | 0,31 | 4,42 | 0,6023 | 0,0531 | |||
| SO / The Southern Company | 0,01 | 0,00 | 0,30 | -4,10 | 0,5964 | 0,0043 | |||
| PG / The Procter & Gamble Company | 0,00 | 0,00 | 0,27 | -6,27 | 0,5278 | -0,0083 | |||
| ADP / Automatic Data Processing, Inc. | 0,00 | 0,00 | 0,27 | 16,59 | 0,5238 | 0,0961 | |||
| HENOY / Henkel AG & Co. KGaA - Depositary Receipt (Common Stock) | 0,00 | 0,00 | 0,26 | -10,58 | 0,5140 | -0,0333 | |||
| CL / Colgate-Palmolive Company | 0,00 | -28,57 | 0,26 | -36,87 | 0,5140 | -0,2612 | |||
| SKM / SK Telecom Co., Ltd. - Depositary Receipt (Common Stock) | 0,01 | 0,00 | 0,26 | -7,53 | 0,5062 | -0,0150 | |||
| GILD / Gilead Sciences, Inc. | 0,00 | 0,00 | 0,26 | -9,25 | 0,5003 | -0,0246 | |||
| IBM / International Business Machines Corporation | 0,00 | 0,00 | 0,25 | 4,56 | 0,4944 | 0,0442 | |||
| QCOM / QUALCOMM Incorporated | 0,00 | 0,00 | 0,23 | -4,86 | 0,4611 | -0,0003 | |||
| AAPL / Apple Inc. | 0,00 | 0,00 | 0,23 | 2,73 | 0,4434 | 0,0324 | |||
| COST / Costco Wholesale Corporation | 0,00 | 0,00 | 0,21 | 0,4120 | 0,4120 | ||||
| NKE / NIKE, Inc. | 0,00 | -100,00 | 0,00 | -100,00 | -0,4390 | ||||
| SJM / The J. M. Smucker Company | 0,00 | -100,00 | 0,00 | -100,00 | 0,0000 | ||||
| JCI / Johnson Controls International plc | 0,00 | -100,00 | 0,00 | -100,00 | -0,3923 | ||||
| TEVA / Teva Pharmaceutical Industries Limited - Depositary Receipt (Common Stock) | 0,00 | -100,00 | 0,00 | -100,00 | -0,8705 | ||||
| SNMX / Senomyx, Inc. | 0,00 | -100,00 | 0,00 | -100,00 | -0,0803 | ||||
| JASN / Jason Industries, Inc. | 0,00 | -100,00 | 0,00 | -100,00 | 0,0000 |