Statistiques de base
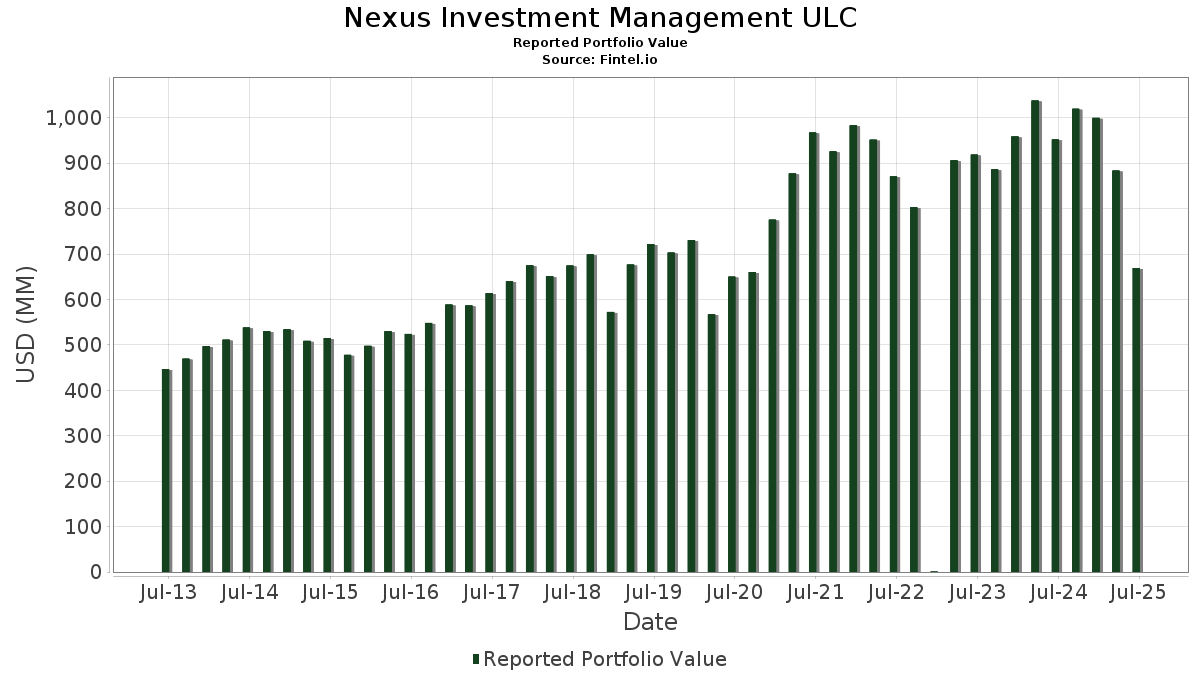
| Valeur du portefeuille | $ 669 166 462 |
| Positions actuelles | 80 |
Dernières positions, performances, ASG (à partir des dépôts 13F, 13D)
Nexus Investment Management ULC a déclaré un total de 80 positions dans ses derniers dépôts auprès de la SEC. La valeur la plus récente du portefeuille est calculée à 669 166 462 USD. Les actifs sous gestion réels (ASG) sont cette valeur plus les liquidités (qui ne sont pas divulguées). Les principales positions de Nexus Investment Management ULC sont Meta Platforms, Inc. (US:META) , JPMorgan Chase & Co. (US:JPM) , Cisco Systems, Inc. (US:CSCO) , Citigroup Inc. (US:C) , and American Electric Power Company, Inc. (US:AEP) . Les nouvelles positions de Nexus Investment Management ULC incluent Thermo Fisher Scientific Inc. (US:TMO) , Capital One Financial Corporation (IT:1COF) , Amazon.com, Inc. (US:AMZN) , McDonald's Corporation (US:MCD) , and The Home Depot, Inc. (US:HD) .
Meilleures augmentations ce trimestre
Nous utilisons la variation de l'allocation du portefeuille car il s'agit de l'indicateur le plus significatif. Les changements peuvent être dus à des transactions ou à des variations de prix des actions.
| Titre | Actions (en millions) |
Valeur ($ en millions) |
% du portefeuille | ΔPortefeuille % |
|---|---|---|---|---|
| 0,06 | 24,34 | 3,6371 | 3,6371 | |
| 0,08 | 58,78 | 8,7847 | 1,2398 | |
| 0,08 | 38,36 | 5,7325 | 1,0267 | |
| 0,29 | 32,67 | 4,8825 | 0,7658 | |
| 0,10 | 21,35 | 3,1911 | 0,7267 | |
| 0,20 | 57,23 | 8,5530 | 0,6215 | |
| 0,50 | 42,39 | 6,3344 | 0,5376 | |
| 0,21 | 37,97 | 5,6740 | 0,3169 | |
| 0,14 | 19,96 | 2,9828 | 0,2915 | |
| 0,11 | 21,81 | 3,2591 | 0,2864 |
Principales baisses ce trimestre
Nous utilisons la variation de l'allocation du portefeuille car il s'agit de l'indicateur le plus significatif. Les changements peuvent être dus à des transactions ou à des variations de prix des actions.
| Titre | Actions (en millions) |
Valeur ($ en millions) |
% du portefeuille | ΔPortefeuille % |
|---|---|---|---|---|
| 0,39 | 40,92 | 6,1156 | -0,9373 | |
| 0,38 | 25,38 | 3,7930 | -0,6650 | |
| 0,21 | 24,84 | 3,7118 | -0,6046 | |
| 0,22 | 21,94 | 3,2783 | -0,5245 | |
| 0,24 | 26,37 | 3,9400 | -0,4689 | |
| 0,25 | 31,76 | 4,7458 | -0,4440 | |
| 0,88 | 21,21 | 3,1698 | -0,4060 | |
| 0,23 | 20,29 | 3,0325 | -0,2858 | |
| 0,06 | 20,73 | 3,0973 | -0,2251 | |
| 0,05 | 3,41 | 0,5099 | -0,0473 |
Déclarations 13F et dépôts de fonds
Ce formulaire a été déposé le 2025-07-28 pour la période de déclaration 2025-06-30. Cliquez sur l'icône du lien pour voir l'historique complet des transactions.
Mettre à niveau pour débloquer les données premium et exporter vers Excel ![]() .
.
| Titre | Type | Prix moyen de l'action | Actions (en millions) |
ΔActions (%) |
ΔActions (%) |
Valeur ($ en millions) |
Portefeuille (%) |
ΔPortefeuille (%) |
|
|---|---|---|---|---|---|---|---|---|---|
| META / Meta Platforms, Inc. | 0,08 | -0,96 | 58,78 | -11,82 | 8,7847 | 1,2398 | |||
| JPM / JPMorgan Chase & Co. | 0,20 | -0,61 | 57,23 | -18,34 | 8,5530 | 0,6215 | |||
| CSCO / Cisco Systems, Inc. | 0,65 | -1,33 | 45,07 | -22,88 | 6,7347 | 0,1214 | |||
| C / Citigroup Inc. | 0,50 | -0,72 | 42,39 | -17,25 | 6,3344 | 0,5376 | |||
| AEP / American Electric Power Company, Inc. | 0,39 | -0,53 | 40,92 | -34,33 | 6,1156 | -0,9373 | |||
| MSFT / Microsoft Corporation | 0,08 | 0,15 | 38,36 | -7,74 | 5,7325 | 1,0267 | |||
| GOOG / Alphabet Inc. | 0,21 | 1,62 | 37,97 | -19,79 | 5,6740 | 0,3169 | |||
| DG / Dollar General Corporation | 0,29 | -0,68 | 32,67 | -10,18 | 4,8825 | 0,7658 | |||
| ROST / Ross Stores, Inc. | 0,25 | -0,22 | 31,76 | -30,75 | 4,7458 | -0,4440 | |||
| GILD / Gilead Sciences, Inc. | 0,24 | -1,62 | 26,37 | -32,32 | 3,9400 | -0,4689 | |||
| KMX / CarMax, Inc. | 0,38 | 7,45 | 25,38 | -35,56 | 3,7930 | -0,6650 | |||
| EOG / EOG Resources, Inc. | 0,21 | 0,44 | 24,84 | -34,88 | 3,7118 | -0,6046 | |||
| TMO / Thermo Fisher Scientific Inc. | 0,06 | 24,34 | 3,6371 | 3,6371 | |||||
| UPS / United Parcel Service, Inc. | 0,22 | 2,33 | 21,94 | -34,71 | 3,2783 | -0,5245 | |||
| TXN / Texas Instruments Incorporated | 0,11 | 3,37 | 21,81 | -16,97 | 3,2591 | 0,2864 | |||
| FERG / Ferguson Enterprises Inc. | 0,10 | 3,79 | 21,35 | -1,94 | 3,1911 | 0,7267 | |||
| PFE / Pfizer Inc. | 0,88 | 0,95 | 21,21 | -32,87 | 3,1698 | -0,4060 | |||
| V / Visa Inc. | 0,06 | 0,24 | 20,73 | -29,40 | 3,0973 | -0,2251 | |||
| MDT / Medtronic plc | 0,23 | 2,62 | 20,29 | -30,79 | 3,0325 | -0,2858 | |||
| MS / Morgan Stanley | 0,14 | 0,00 | 19,96 | -16,06 | 2,9828 | 0,2915 | |||
| HON / Honeywell International Inc. | 0,03 | 0,38 | 7,09 | -23,25 | 1,0590 | 0,0140 | |||
| GLW / Corning Incorporated | 0,09 | 0,00 | 4,94 | -20,15 | 0,7387 | 0,0382 | |||
| KR / The Kroger Co. | 0,05 | -5,93 | 3,41 | -30,71 | 0,5099 | -0,0473 | |||
| EFA / iShares Trust - iShares MSCI EAFE ETF | 0,03 | -3,17 | 2,73 | -26,40 | 0,4081 | -0,0117 | |||
| UNP / Union Pacific Corporation | 0,01 | 0,00 | 2,60 | -32,28 | 0,3887 | -0,0461 | |||
| DHR / Danaher Corporation | 0,01 | 0,00 | 1,53 | -33,03 | 0,2289 | -0,0299 | |||
| JNJ / Johnson & Johnson | 0,01 | 0,00 | 1,43 | -35,96 | 0,2130 | -0,0389 | |||
| GOOGL / Alphabet Inc. | 0,01 | 0,00 | 1,25 | -20,81 | 0,1872 | 0,0083 | |||
| CVX / Chevron Corporation | 0,01 | 0,00 | 1,08 | -40,54 | 0,1621 | -0,0442 | |||
| VZ / Verizon Communications Inc. | 0,02 | 0,00 | 0,68 | -33,69 | 0,1009 | -0,0143 | |||
| 1COF / Capital One Financial Corporation | 0,00 | 0,66 | 0,0986 | 0,0986 | |||||
| ABBV / AbbVie Inc. | 0,00 | 0,00 | 0,64 | -38,42 | 0,0959 | -0,0220 | |||
| LLY / Eli Lilly and Company | 0,00 | 0,00 | 0,63 | -34,44 | 0,0942 | -0,0145 | |||
| XOM / Exxon Mobil Corporation | 0,01 | 0,00 | 0,61 | -37,03 | 0,0919 | -0,0185 | |||
| T / AT&T Inc. | 0,02 | 0,00 | 0,56 | -28,94 | 0,0831 | -0,0054 | |||
| OTEX / Open Text Corporation | 0,02 | 0,00 | 0,52 | -19,69 | 0,0781 | 0,0045 | |||
| CSX / CSX Corporation | 0,02 | 0,00 | 0,52 | -22,99 | 0,0772 | 0,0014 | |||
| EXC / Exelon Corporation | 0,01 | 0,00 | 0,50 | -34,52 | 0,0741 | -0,0116 | |||
| TROW / T. Rowe Price Group, Inc. | 0,00 | 0,00 | 0,36 | -27,13 | 0,0539 | -0,0020 | |||
| FSV / FirstService Corporation | 0,00 | 0,00 | 0,35 | -26,83 | 0,0522 | -0,0018 | |||
| ABT / Abbott Laboratories | 0,00 | 0,00 | 0,34 | -28,84 | 0,0506 | -0,0032 | |||
| KMB / Kimberly-Clark Corporation | 0,00 | 0,00 | 0,33 | -36,93 | 0,0498 | -0,0100 | |||
| MRK / Merck & Co., Inc. | 0,00 | 0,00 | 0,30 | -38,80 | 0,0442 | -0,0104 | |||
| PG / The Procter & Gamble Company | 0,00 | 0,00 | 0,29 | -35,15 | 0,0429 | -0,0071 | |||
| BAC / Bank of America Corporation | 0,01 | 0,00 | 0,25 | -21,18 | 0,0378 | 0,0015 | |||
| EIX / Edison International | 0,00 | 0,00 | 0,19 | -39,37 | 0,0287 | -0,0070 | |||
| COST / Costco Wholesale Corporation | 0,00 | 75,00 | 0,17 | 27,21 | 0,0259 | 0,0105 | |||
| VEA / Vanguard Tax-Managed Funds - Vanguard FTSE Developed Markets ETF | 0,00 | 0,00 | 0,17 | -22,17 | 0,0258 | 0,0007 | |||
| VWO / Vanguard International Equity Index Funds - Vanguard FTSE Emerging Markets ETF | 0,00 | 0,00 | 0,12 | -23,90 | 0,0182 | 0,0001 | |||
| WMT / Walmart Inc. | 0,00 | 113,51 | 0,12 | 64,29 | 0,0173 | 0,0094 | |||
| BIIB / Biogen Inc. | 0,00 | 0,00 | 0,12 | -36,46 | 0,0173 | -0,0032 | |||
| MA / Mastercard Incorporated | 0,00 | 0,00 | 0,11 | -28,76 | 0,0164 | -0,0010 | |||
| PRAA / PRA Group, Inc. | 0,01 | 0,00 | 0,10 | -50,26 | 0,0142 | -0,0074 | |||
| CL / Colgate-Palmolive Company | 0,00 | 0,00 | 0,09 | -33,08 | 0,0131 | -0,0016 | |||
| AMZN / Amazon.com, Inc. | 0,00 | 0,09 | 0,0131 | 0,0131 | |||||
| ORCL / Oracle Corporation | 0,00 | 0,00 | 0,09 | 8,75 | 0,0131 | 0,0040 | |||
| BHC / Bausch Health Companies Inc. | 0,01 | 0,00 | 0,09 | -28,33 | 0,0129 | -0,0008 | |||
| BRK.B / Berkshire Hathaway Inc. | 0,00 | 172,13 | 0,08 | 73,91 | 0,0121 | 0,0068 | |||
| VLTO / Veralto Corporation | 0,00 | 0,00 | 0,07 | -27,96 | 0,0101 | -0,0005 | |||
| HQH / Abrdn Healthcare Investors | 0,00 | 0,00 | 0,06 | -33,70 | 0,0091 | -0,0013 | |||
| AAPL / Apple Inc. | 0,00 | 333,33 | 0,05 | 178,95 | 0,0080 | 0,0058 | |||
| BMY / Bristol-Myers Squibb Company | 0,00 | 0,00 | 0,04 | -46,99 | 0,0066 | -0,0029 | |||
| MCD / McDonald's Corporation | 0,00 | 0,04 | 0,0061 | 0,0061 | |||||
| HD / The Home Depot, Inc. | 0,00 | 0,04 | 0,0060 | 0,0060 | |||||
| AXP / American Express Company | 0,00 | 0,00 | 0,04 | -18,75 | 0,0060 | 0,0005 | |||
| NEM / Newmont Corporation | 0,00 | 0,00 | 0,04 | -17,78 | 0,0057 | 0,0006 | |||
| FNV / Franco-Nevada Corporation | 0,00 | 0,00 | 0,04 | -28,00 | 0,0055 | -0,0003 | |||
| SBUX / Starbucks Corporation | 0,00 | 0,03 | 0,0052 | 0,0052 | |||||
| B / Barrick Mining Corporation | 0,00 | 0,03 | 0,0047 | 0,0047 | |||||
| ADBE / Adobe Inc. | 0,00 | 0,03 | 0,0046 | 0,0046 | |||||
| NVS / Novartis AG - Depositary Receipt (Common Stock) | 0,00 | 0,00 | 0,03 | -25,71 | 0,0040 | -0,0000 | |||
| BDX / Becton, Dickinson and Company | 0,00 | 0,00 | 0,03 | -48,98 | 0,0039 | -0,0017 | |||
| GDXJ / VanEck ETF Trust - VanEck Junior Gold Miners ETF | 0,00 | 0,00 | 0,02 | -16,67 | 0,0030 | 0,0002 | |||
| ACN / Accenture plc | 0,00 | 0,00 | 0,02 | -34,48 | 0,0029 | -0,0004 | |||
| HQL / Abrdn Life Sciences Investors | 0,00 | 0,00 | 0,02 | -29,63 | 0,0029 | -0,0002 | |||
| PEP / PepsiCo, Inc. | 0,00 | 0,00 | 0,02 | -38,46 | 0,0025 | -0,0006 | |||
| SLV / iShares Silver Trust | 0,00 | 0,00 | 0,02 | -27,27 | 0,0025 | -0,0001 | |||
| RTX / RTX Corporation | 0,00 | 0,00 | 0,01 | -25,00 | 0,0010 | 0,0000 | |||
| VTRS / Viatris Inc. | 0,00 | 0,00 | 0,00 | -40,00 | 0,0005 | -0,0000 | |||
| CB144A Appvion Esc Npv / (038ESC026) | 0,00 | 0,00 | 0,0000 | ||||||
| DFS / Discover Financial Services | 0,00 | -100,00 | 0,00 | 0,0000 | |||||
| CVS / CVS Health Corporation | 0,00 | -100,00 | 0,00 | 0,0000 | |||||
| GOLD / Barrick Mining Corporation | 0,00 | -100,00 | 0,00 | 0,0000 |