Statistiques de base
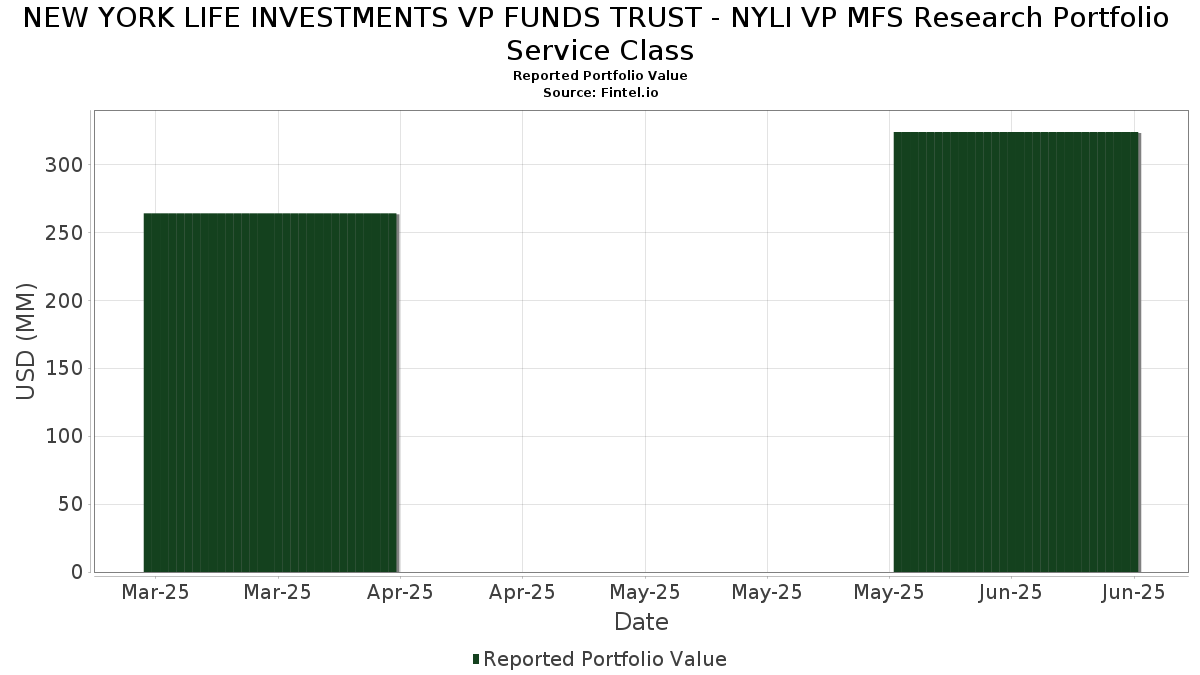
| Valeur du portefeuille | $ 323 855 370 |
| Positions actuelles | 105 |
Dernières positions, performances, ASG (à partir des dépôts 13F, 13D)
NEW YORK LIFE INVESTMENTS VP FUNDS TRUST - NYLI VP MFS Research Portfolio Service Class a déclaré un total de 105 positions dans ses derniers dépôts auprès de la SEC. La valeur la plus récente du portefeuille est calculée à 323 855 370 USD. Les actifs sous gestion réels (ASG) sont cette valeur plus les liquidités (qui ne sont pas divulguées). Les principales positions de NEW YORK LIFE INVESTMENTS VP FUNDS TRUST - NYLI VP MFS Research Portfolio Service Class sont Microsoft Corporation (US:MSFT) , NVIDIA Corporation (US:NVDA) , Amazon.com, Inc. (US:AMZN) , Meta Platforms, Inc. (US:META) , and Apple Inc. (US:AAPL) . Les nouvelles positions de NEW YORK LIFE INVESTMENTS VP FUNDS TRUST - NYLI VP MFS Research Portfolio Service Class incluent Mastercard Incorporated (US:MA) , RTX Corporation (US:RTX) , American Tower Corporation (US:AMT) , The TJX Companies, Inc. (US:TJX) , and Cognizant Technology Solutions Corporation (MX:CTSH) .
Meilleures augmentations ce trimestre
Nous utilisons la variation de l'allocation du portefeuille car il s'agit de l'indicateur le plus significatif. Les changements peuvent être dus à des transactions ou à des variations de prix des actions.
| Titre | Actions (en millions) |
Valeur ($ en millions) |
% du portefeuille | ΔPortefeuille % |
|---|---|---|---|---|
| 0,02 | 9,66 | 2,9849 | 2,9849 | |
| 0,03 | 8,12 | 2,5084 | 2,0146 | |
| 0,03 | 4,27 | 1,3191 | 1,3191 | |
| 0,06 | 27,89 | 8,6189 | 1,2373 | |
| 0,01 | 3,25 | 1,0029 | 1,0029 | |
| 0,11 | 17,67 | 5,4590 | 0,9722 | |
| 0,02 | 1,97 | 0,6099 | 0,6099 | |
| 0,02 | 15,27 | 4,7182 | 0,5800 | |
| 0,02 | 1,73 | 0,5333 | 0,5333 | |
| 0,01 | 1,50 | 0,4643 | 0,4643 |
Principales baisses ce trimestre
Nous utilisons la variation de l'allocation du portefeuille car il s'agit de l'indicateur le plus significatif. Les changements peuvent être dus à des transactions ou à des variations de prix des actions.
| Titre | Actions (en millions) |
Valeur ($ en millions) |
% du portefeuille | ΔPortefeuille % |
|---|---|---|---|---|
| 0,00 | 0,97 | 0,3006 | -0,8485 | |
| 0,01 | 2,65 | 0,8182 | -0,6347 | |
| 0,00 | 0,00 | -0,6009 | ||
| 0,00 | 0,00 | -0,5910 | ||
| 0,00 | 0,00 | -0,5035 | ||
| 0,01 | 1,00 | 0,3101 | -0,4711 | |
| 0,01 | 3,15 | 0,9724 | -0,3765 | |
| 0,00 | 0,00 | -0,3675 | ||
| 0,00 | 0,41 | 0,1276 | -0,3351 | |
| 0,02 | 3,71 | 1,1461 | -0,3043 |
Déclarations 13F et dépôts de fonds
Ce formulaire a été déposé le 2025-08-25 pour la période de déclaration 2025-06-30. Cliquez sur l'icône du lien pour voir l'historique complet des transactions.
Mettre à niveau pour débloquer les données premium et exporter vers Excel ![]() .
.
| Titre | Type | Prix moyen de l'action | Actions (en millions) |
ΔActions (%) |
ΔActions (%) |
Valeur ($ en millions) |
Portefeuille (%) |
ΔPortefeuille (%) |
|
|---|---|---|---|---|---|---|---|---|---|
| MSFT / Microsoft Corporation | 0,06 | 7,83 | 27,89 | 42,88 | 8,6189 | 1,2373 | |||
| NVDA / NVIDIA Corporation | 0,11 | 2,13 | 17,67 | 48,89 | 5,4590 | 0,9722 | |||
| AMZN / Amazon.com, Inc. | 0,07 | 9,14 | 15,64 | 25,85 | 4,8332 | 0,1336 | |||
| META / Meta Platforms, Inc. | 0,02 | 8,95 | 15,27 | 39,52 | 4,7182 | 0,5800 | |||
| AAPL / Apple Inc. | 0,07 | 40,88 | 13,44 | 30,13 | 4,1521 | 0,2475 | |||
| MA / Mastercard Incorporated | 0,02 | 9,66 | 2,9849 | 2,9849 | |||||
| JPM / JPMorgan Chase & Co. | 0,03 | 9,12 | 8,35 | 28,96 | 2,5810 | 0,1320 | |||
| GOOGL / Alphabet Inc. | 0,05 | -3,89 | 8,24 | 9,53 | 2,5476 | -0,2987 | |||
| AVGO / Broadcom Inc. | 0,03 | 277,58 | 8,12 | 522,07 | 2,5084 | 2,0146 | |||
| CRM / Salesforce, Inc. | 0,02 | 9,05 | 4,46 | 10,81 | 1,3779 | -0,1437 | |||
| RTX / RTX Corporation | 0,03 | 4,27 | 1,3191 | 1,3191 | |||||
| JNJ / Johnson & Johnson | 0,03 | 9,14 | 3,97 | 0,53 | 1,2273 | -0,2667 | |||
| ABBV / AbbVie Inc. | 0,02 | 9,15 | 3,71 | -3,29 | 1,1461 | -0,3043 | |||
| HD / The Home Depot, Inc. | 0,01 | 9,14 | 3,53 | 9,18 | 1,0919 | -0,1319 | |||
| XOM / Exxon Mobil Corporation | 0,03 | 50,87 | 3,47 | 36,74 | 1,0707 | 0,1126 | |||
| SCHW / The Charles Schwab Corporation | 0,04 | 9,12 | 3,29 | 27,19 | 1,0177 | 0,0385 | |||
| ETN / Eaton Corporation plc | 0,01 | 9,12 | 3,28 | 43,34 | 1,0148 | 0,1483 | |||
| CME / CME Group Inc. | 0,01 | 9,13 | 3,26 | 13,38 | 1,0082 | -0,0800 | |||
| AMT / American Tower Corporation | 0,01 | 3,25 | 1,0029 | 1,0029 | |||||
| EMR / Emerson Electric Co. | 0,02 | 38,18 | 3,22 | 68,03 | 0,9939 | 0,2701 | |||
| PNC / The PNC Financial Services Group, Inc. | 0,02 | 9,14 | 3,19 | 15,76 | 0,9848 | -0,0563 | |||
| CI / The Cigna Group | 0,01 | 9,21 | 3,15 | 9,72 | 0,9729 | -0,1120 | |||
| ACN / Accenture plc | 0,01 | -7,91 | 3,15 | -11,77 | 0,9724 | -0,3765 | |||
| LRCX / Lam Research Corporation | 0,03 | 9,15 | 3,09 | 46,12 | 0,9556 | 0,1555 | |||
| MDT / Medtronic plc | 0,04 | 9,13 | 3,05 | 5,86 | 0,9434 | -0,1471 | |||
| HWM / Howmet Aerospace Inc. | 0,02 | 9,22 | 3,05 | 56,72 | 0,9411 | 0,2062 | |||
| CDNS / Cadence Design Systems, Inc. | 0,01 | -9,26 | 3,04 | 9,96 | 0,9382 | -0,1061 | |||
| ARMK / Aramark | 0,07 | 8,95 | 2,84 | 32,14 | 0,8780 | 0,0650 | |||
| MS / Morgan Stanley | 0,02 | 9,03 | 2,84 | 31,65 | 0,8768 | 0,0617 | |||
| BSX / Boston Scientific Corporation | 0,03 | 9,13 | 2,81 | 16,22 | 0,8680 | -0,0462 | |||
| COP / ConocoPhillips | 0,03 | 9,09 | 2,65 | -6,79 | 0,8188 | -0,2560 | |||
| CB / Chubb Limited | 0,01 | -28,17 | 2,65 | -31,08 | 0,8182 | -0,6347 | |||
| AON / Aon plc | 0,01 | 9,09 | 2,59 | -2,48 | 0,8004 | -0,2040 | |||
| OMC / Omnicom Group Inc. | 0,04 | 29,06 | 2,56 | 11,97 | 0,7921 | -0,0735 | |||
| CNSWF / Constellation Software Inc. | 0,00 | -2,41 | 2,53 | 13,02 | 0,7806 | -0,0648 | |||
| PM / Philip Morris International Inc. | 0,01 | 8,83 | 2,44 | 24,88 | 0,7539 | 0,0151 | |||
| SPOT / Spotify Technology S.A. | 0,00 | 37,37 | 2,43 | 91,63 | 0,7504 | 0,2713 | |||
| USFD / US Foods Holding Corp. | 0,03 | 17,12 | 2,38 | 37,79 | 0,7360 | 0,0824 | |||
| TRU / TransUnion | 0,03 | 9,11 | 2,38 | 15,72 | 0,7350 | -0,0424 | |||
| CRH / CRH plc | 0,03 | 35,00 | 2,38 | 40,88 | 0,7348 | 0,0965 | |||
| 56064L488 / MainStay US Government Liquidity Fund | 2,35 | -5,06 | 2,35 | -5,05 | 0,7268 | -0,2100 | |||
| PEP / PepsiCo, Inc. | 0,02 | 8,83 | 2,35 | -4,16 | 0,7263 | -0,2011 | |||
| HLT / Hilton Worldwide Holdings Inc. | 0,01 | 17,70 | 2,29 | 37,80 | 0,7086 | 0,0792 | |||
| TT / Trane Technologies plc | 0,01 | 61,39 | 2,25 | 109,60 | 0,6950 | 0,2891 | |||
| TEAM / Atlassian Corporation | 0,01 | 42,56 | 2,18 | 36,44 | 0,6735 | 0,0694 | |||
| MCK / McKesson Corporation | 0,00 | -4,33 | 2,15 | 4,16 | 0,6652 | -0,1162 | |||
| GD / General Dynamics Corporation | 0,01 | 18,11 | 2,11 | 26,39 | 0,6512 | 0,0207 | |||
| STE / STERIS plc | 0,01 | 9,18 | 2,11 | 15,72 | 0,6504 | -0,0374 | |||
| FI / Fiserv, Inc. | 0,01 | 9,96 | 2,10 | -14,17 | 0,6498 | -0,2764 | |||
| BDX / Becton, Dickinson and Company | 0,01 | 27,02 | 2,09 | -4,47 | 0,6471 | -0,1819 | |||
| OKTA / Okta, Inc. | 0,02 | 9,27 | 2,07 | 3,82 | 0,6391 | -0,1142 | |||
| NDSN / Nordson Corporation | 0,01 | 28,69 | 2,07 | 36,75 | 0,6381 | 0,0672 | |||
| MRVL / Marvell Technology, Inc. | 0,03 | 9,14 | 2,01 | 37,22 | 0,6220 | 0,0672 | |||
| APD / Air Products and Chemicals, Inc. | 0,01 | 17,41 | 1,98 | 12,30 | 0,6123 | -0,0549 | |||
| TJX / The TJX Companies, Inc. | 0,02 | 1,97 | 0,6099 | 0,6099 | |||||
| DUK / Duke Energy Corporation | 0,02 | 9,14 | 1,96 | 5,60 | 0,6058 | -0,0963 | |||
| VRTX / Vertex Pharmaceuticals Incorporated | 0,00 | -5,68 | 1,96 | -13,39 | 0,6057 | -0,2500 | |||
| CTVA / Corteva, Inc. | 0,03 | 9,17 | 1,94 | 29,36 | 0,6004 | 0,0322 | |||
| PFE / Pfizer Inc. | 0,08 | 9,22 | 1,94 | 4,48 | 0,5981 | -0,1024 | |||
| TYL / Tyler Technologies, Inc. | 0,00 | 31,19 | 1,94 | 33,82 | 0,5979 | 0,0510 | |||
| BKNG / Booking Holdings Inc. | 0,00 | 9,30 | 1,90 | 37,37 | 0,5885 | 0,0642 | |||
| WAB / Westinghouse Air Brake Technologies Corporation | 0,01 | 9,19 | 1,87 | 26,10 | 0,5778 | 0,0169 | |||
| WTW / Willis Towers Watson Public Limited Company | 0,01 | 9,19 | 1,85 | -0,97 | 0,5705 | -0,1345 | |||
| TE Connectivity plc / EC (IE000IVNQZ81) | 0,01 | 9,13 | 1,79 | 30,25 | 0,5534 | 0,0335 | |||
| MCO / Moody's Corporation | 0,00 | 9,12 | 1,78 | 17,55 | 0,5507 | -0,0227 | |||
| EPAM / EPAM Systems, Inc. | 0,01 | 8,92 | 1,78 | 14,07 | 0,5485 | -0,0399 | |||
| SHW / The Sherwin-Williams Company | 0,01 | 16,50 | 1,75 | 14,57 | 0,5423 | -0,0370 | |||
| NXPI / NXP Semiconductors N.V. | 0,01 | 9,14 | 1,74 | 25,41 | 0,5385 | 0,0133 | |||
| CL / Colgate-Palmolive Company | 0,02 | 9,15 | 1,74 | 5,91 | 0,5368 | -0,0836 | |||
| A / Agilent Technologies, Inc. | 0,01 | 9,02 | 1,73 | 9,99 | 0,5339 | -0,0602 | |||
| CTSH / Cognizant Technology Solutions Corporation | 0,02 | 1,73 | 0,5333 | 0,5333 | |||||
| WAT / Waters Corporation | 0,00 | 9,62 | 1,72 | 3,86 | 0,5321 | -0,0951 | |||
| Aptiv plc / EC (JE00BTDN8H13) | 0,02 | 21,15 | 1,65 | 38,91 | 0,5108 | 0,0608 | |||
| RRX / Regal Rexnord Corporation | 0,01 | 9,13 | 1,63 | 38,91 | 0,5033 | 0,0601 | |||
| HUBS / HubSpot, Inc. | 0,00 | 31,88 | 1,60 | 28,47 | 0,4952 | 0,0236 | |||
| EXR / Extra Space Storage Inc. | 0,01 | 9,10 | 1,60 | 8,28 | 0,4934 | -0,0640 | |||
| NTRS / Northern Trust Corporation | 0,01 | 8,97 | 1,57 | 40,11 | 0,4858 | 0,0614 | |||
| MDLZ / Mondelez International, Inc. | 0,02 | 8,83 | 1,55 | 8,16 | 0,4793 | -0,0629 | |||
| FERG / Ferguson Enterprises Inc. | 0,01 | 8,63 | 1,54 | 47,66 | 0,4770 | 0,0816 | |||
| LNT / Alliant Energy Corporation | 0,03 | 9,14 | 1,53 | 2,55 | 0,4730 | -0,0914 | |||
| DG / Dollar General Corporation | 0,01 | 1,50 | 0,4643 | 0,4643 | |||||
| UNP / Union Pacific Corporation | 0,01 | 1,49 | 0,4604 | 0,4604 | |||||
| EXPE / Expedia Group, Inc. | 0,01 | 8,93 | 1,48 | 9,30 | 0,4577 | -0,0547 | |||
| PCG / PG&E Corporation | 0,10 | 9,12 | 1,46 | -11,44 | 0,4496 | -0,1718 | |||
| BJ / BJ's Wholesale Club Holdings, Inc. | 0,01 | 1,45 | 0,4471 | 0,4471 | |||||
| AIG / American International Group, Inc. | 0,02 | 1,43 | 0,4422 | 0,4422 | |||||
| KKR / KKR & Co. Inc. | 0,01 | 9,62 | 1,43 | 26,22 | 0,4404 | 0,0131 | |||
| PPL / PPL Corporation | 0,04 | 9,15 | 1,42 | 2,45 | 0,4389 | -0,0854 | |||
| CDW / CDW Corporation | 0,01 | 8,94 | 1,39 | 21,36 | 0,4303 | -0,0034 | |||
| KVUE / Kenvue Inc. | 0,07 | 10,37 | 1,39 | -3,67 | 0,4300 | -0,1162 | |||
| SBUX / Starbucks Corporation | 0,02 | 1,39 | 0,4289 | 0,4289 | |||||
| JBHT / J.B. Hunt Transport Services, Inc. | 0,01 | 9,14 | 1,29 | 5,94 | 0,3973 | -0,0616 | |||
| VST / Vistra Corp. | 0,01 | 1,25 | 0,3875 | 0,3875 | |||||
| HUM / Humana Inc. | 0,00 | 9,49 | 1,04 | 1,17 | 0,3216 | -0,0674 | |||
| VLO / Valero Energy Corporation | 0,01 | 9,22 | 1,02 | 11,16 | 0,3140 | -0,0317 | |||
| HES / Hess Corporation | 0,01 | -44,00 | 1,00 | -51,45 | 0,3101 | -0,4711 | |||
| GIS / General Mills, Inc. | 0,02 | 8,83 | 0,98 | -5,66 | 0,3038 | -0,0904 | |||
| SBAC / SBA Communications Corporation | 0,00 | -70,01 | 0,97 | -68,01 | 0,3006 | -0,8485 | |||
| LNG / Cheniere Energy, Inc. | 0,00 | 9,56 | 0,93 | 15,35 | 0,2880 | -0,0177 | |||
| ESTC / Elastic N.V. | 0,01 | 8,92 | 0,92 | 3,13 | 0,2850 | -0,0533 | |||
| EL / The Estée Lauder Companies Inc. | 0,01 | 10,38 | 0,87 | 35,15 | 0,2687 | 0,0254 | |||
| EVR / Evercore Inc. | 0,00 | 0,82 | 0,2533 | 0,2533 | |||||
| FTI / TechnipFMC plc | 0,02 | 8,76 | 0,75 | 18,27 | 0,2323 | -0,0082 | |||
| IJF / ICON Public Limited Company | 0,00 | 9,15 | 0,70 | -9,24 | 0,2155 | -0,0751 | |||
| IT / Gartner, Inc. | 0,00 | -64,95 | 0,41 | -66,23 | 0,1276 | -0,3351 | |||
| BA / The Boeing Company | 0,00 | -100,00 | 0,00 | -100,00 | -0,6009 | ||||
| QCOM / QUALCOMM Incorporated | 0,00 | -100,00 | 0,00 | -100,00 | -0,5910 | ||||
| EA / Electronic Arts Inc. | 0,00 | -100,00 | 0,00 | -100,00 | -0,2004 | ||||
| LDOS / Leidos Holdings, Inc. | 0,00 | -100,00 | 0,00 | -100,00 | -0,3675 | ||||
| CPKC N / Canadian Pacific Kansas City Limited | 0,00 | -100,00 | 0,00 | -100,00 | -0,5035 |