Statistiques de base
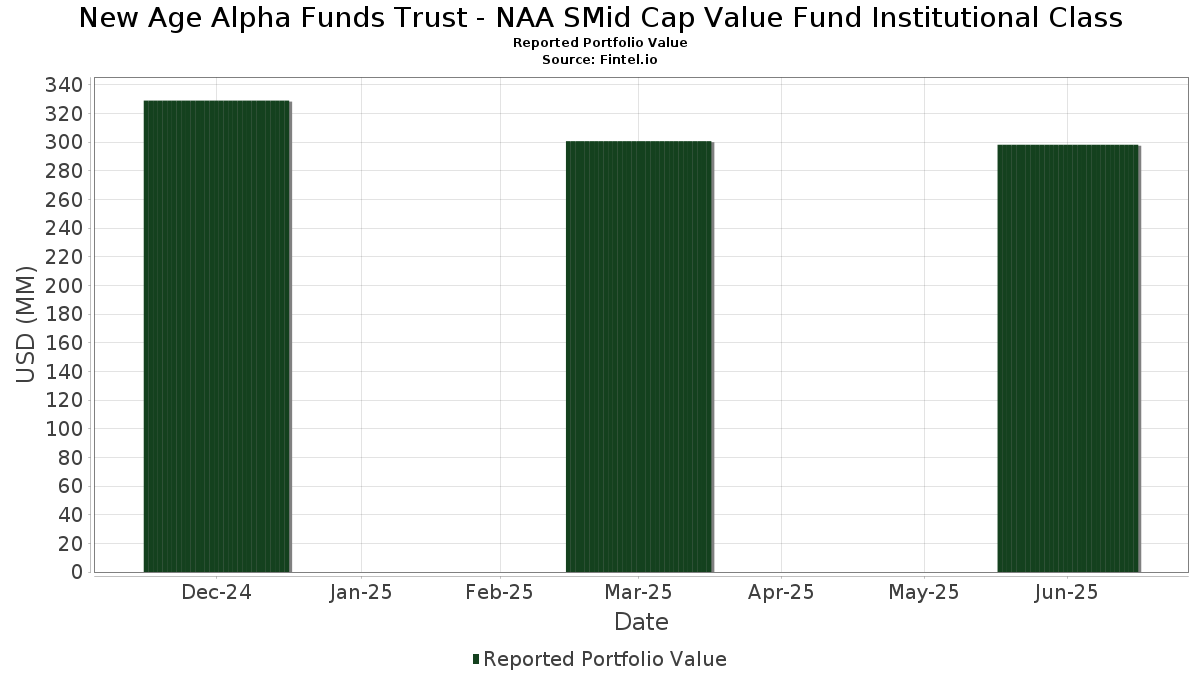
| Valeur du portefeuille | $ 298 168 195 |
| Positions actuelles | 123 |
Dernières positions, performances, ASG (à partir des dépôts 13F, 13D)
New Age Alpha Funds Trust - NAA SMid Cap Value Fund Institutional Class a déclaré un total de 123 positions dans ses derniers dépôts auprès de la SEC. La valeur la plus récente du portefeuille est calculée à 298 168 195 USD. Les actifs sous gestion réels (ASG) sont cette valeur plus les liquidités (qui ne sont pas divulguées). Les principales positions de New Age Alpha Funds Trust - NAA SMid Cap Value Fund Institutional Class sont First Horizon Corporation (US:FHN) , Alcoa Corporation (US:AA) , Ecolab Inc. (US:ECL) , Unum Group (US:UNM) , and Cardinal Health, Inc. (US:CAH) . Les nouvelles positions de New Age Alpha Funds Trust - NAA SMid Cap Value Fund Institutional Class incluent Alcoa Corporation (US:AA) , FirstEnergy Corp. (US:FE) , Dollar Tree, Inc. (US:DLTR) , lululemon athletica inc. (US:LULU) , and F.N.B. Corporation (US:FNB) .
Meilleures augmentations ce trimestre
Nous utilisons la variation de l'allocation du portefeuille car il s'agit de l'indicateur le plus significatif. Les changements peuvent être dus à des transactions ou à des variations de prix des actions.
| Titre | Actions (en millions) |
Valeur ($ en millions) |
% du portefeuille | ΔPortefeuille % |
|---|---|---|---|---|
| 0,15 | 4,45 | 1,4897 | 1,4897 | |
| 0,10 | 4,06 | 1,3603 | 1,3603 | |
| 0,04 | 3,63 | 1,2172 | 1,2172 | |
| 0,01 | 3,12 | 1,0445 | 1,0445 | |
| 0,21 | 3,11 | 1,0424 | 1,0424 | |
| 0,03 | 3,05 | 1,0226 | 1,0226 | |
| 0,13 | 3,02 | 1,0124 | 1,0124 | |
| 0,14 | 3,00 | 1,0046 | 1,0046 | |
| 0,20 | 2,98 | 0,9983 | 0,9983 | |
| 0,05 | 2,95 | 0,9899 | 0,9899 |
Principales baisses ce trimestre
Nous utilisons la variation de l'allocation du portefeuille car il s'agit de l'indicateur le plus significatif. Les changements peuvent être dus à des transactions ou à des variations de prix des actions.
| Titre | Actions (en millions) |
Valeur ($ en millions) |
% du portefeuille | ΔPortefeuille % |
|---|---|---|---|---|
| 0,00 | 0,00 | -1,6585 | ||
| 0,00 | 0,00 | -1,6585 | ||
| 0,00 | 0,00 | -0,9937 | ||
| 0,00 | 0,00 | -0,7372 | ||
| 0,00 | 0,00 | -0,6864 | ||
| 0,00 | 0,00 | -0,5054 | ||
| 0,03 | 4,34 | 1,4554 | -0,3319 | |
| 0,21 | 2,59 | 0,8678 | -0,3214 | |
| 0,04 | 2,30 | 0,7709 | -0,2665 | |
| 0,10 | 4,32 | 1,4481 | -0,2612 |
Déclarations 13F et dépôts de fonds
Ce formulaire a été déposé le 2025-08-28 pour la période de déclaration 2025-06-30. Cliquez sur l'icône du lien pour voir l'historique complet des transactions.
Mettre à niveau pour débloquer les données premium et exporter vers Excel ![]() .
.
| Titre | Type | Prix moyen de l'action | Actions (en millions) |
ΔActions (%) |
ΔActions (%) |
Valeur ($ en millions) |
Portefeuille (%) |
ΔPortefeuille (%) |
|
|---|---|---|---|---|---|---|---|---|---|
| FHN / First Horizon Corporation | 0,22 | -4,78 | 4,64 | 3,94 | 1,5557 | 0,0703 | |||
| AA / Alcoa Corporation | 0,15 | 4,45 | 1,4897 | 1,4897 | |||||
| ECL / Ecolab Inc. | 0,02 | -18,08 | 4,43 | -12,95 | 1,4831 | -0,2075 | |||
| UNM / Unum Group | 0,05 | -14,38 | 4,40 | -15,12 | 1,4753 | -0,2496 | |||
| CAH / Cardinal Health, Inc. | 0,03 | -33,72 | 4,34 | -19,17 | 1,4554 | -0,3319 | |||
| ALV / Autoliv, Inc. | 0,04 | -11,25 | 4,33 | 12,28 | 1,4525 | 0,1686 | |||
| RGA / Reinsurance Group of America, Incorporated | 0,02 | 2,83 | 4,33 | 3,59 | 1,4506 | 0,0608 | |||
| NNN / NNN REIT, Inc. | 0,10 | -11,43 | 4,32 | -10,33 | 1,4486 | -0,1547 | |||
| OGE / OGE Energy Corp. | 0,10 | -12,93 | 4,32 | -15,92 | 1,4481 | -0,2612 | |||
| OSK / Oshkosh Corporation | 0,04 | -4,20 | 4,26 | 15,60 | 1,4279 | 0,2022 | |||
| BMRN / BioMarin Pharmaceutical Inc. | 0,08 | 11,19 | 4,25 | -13,55 | 1,4259 | -0,2108 | |||
| FIVE / Five Below, Inc. | 0,03 | -4,61 | 4,15 | 67,00 | 1,3909 | 0,5644 | |||
| REXR / Rexford Industrial Realty, Inc. | 0,12 | -2,21 | 4,14 | -11,17 | 1,3886 | -0,1626 | |||
| AMH / American Homes 4 Rent | 0,11 | -3,39 | 4,13 | -7,84 | 1,3825 | -0,1062 | |||
| COP / ConocoPhillips | 0,05 | -1,02 | 4,09 | -15,41 | 1,3709 | -0,2377 | |||
| FE / FirstEnergy Corp. | 0,10 | 4,06 | 1,3603 | 1,3603 | |||||
| DXCM / DexCom, Inc. | 0,05 | -4,24 | 3,97 | 22,41 | 1,3309 | 0,2518 | |||
| NXT / Nextracker Inc. | 0,07 | -16,13 | 3,94 | 8,20 | 1,3218 | 0,1095 | |||
| RPM / RPM International Inc. | 0,03 | 3,05 | 3,77 | -2,13 | 1,2624 | -0,0180 | |||
| DLTR / Dollar Tree, Inc. | 0,04 | 3,63 | 1,2172 | 1,2172 | |||||
| THG / The Hanover Insurance Group, Inc. | 0,02 | -2,63 | 3,58 | -4,91 | 1,2012 | -0,0525 | |||
| THC / Tenet Healthcare Corporation | 0,02 | -13,12 | 3,41 | 13,69 | 1,1441 | 0,1453 | |||
| ELS / Equity LifeStyle Properties, Inc. | 0,05 | -4,57 | 3,38 | -11,76 | 1,1341 | -0,1416 | |||
| JLL / Jones Lang LaSalle Incorporated | 0,01 | -5,01 | 3,27 | -1,98 | 1,0962 | -0,0139 | |||
| BR / Broadridge Financial Solutions, Inc. | 0,01 | -5,90 | 3,18 | -5,70 | 1,0646 | -0,0556 | |||
| EVRG / Evergy, Inc. | 0,05 | -7,07 | 3,14 | -7,10 | 1,0519 | -0,0718 | |||
| LULU / lululemon athletica inc. | 0,01 | 3,12 | 1,0445 | 1,0445 | |||||
| FNB / F.N.B. Corporation | 0,21 | 3,11 | 1,0424 | 1,0424 | |||||
| FCN / FTI Consulting, Inc. | 0,02 | -10,22 | 3,09 | -11,63 | 1,0342 | -0,1273 | |||
| J / Jacobs Solutions Inc. | 0,02 | -11,61 | 3,07 | -3,88 | 1,0295 | -0,0335 | |||
| ABM / ABM Industries Incorporated | 0,06 | 8,83 | 3,05 | 8,49 | 1,0237 | 0,0872 | |||
| CHRD / Chord Energy Corporation | 0,03 | 3,05 | 1,0226 | 1,0226 | |||||
| LEA / Lear Corporation | 0,03 | -2,23 | 3,04 | 5,27 | 1,0183 | 0,0582 | |||
| ESI / Element Solutions Inc | 0,13 | 3,02 | 1,0124 | 1,0124 | |||||
| SIGI / Selective Insurance Group, Inc. | 0,03 | -4,84 | 3,02 | -9,91 | 1,0118 | -0,1030 | |||
| IWS / iShares Trust - iShares Russell Mid-Cap Value ETF | 0,02 | 541,46 | 3,02 | 573,44 | 1,0112 | 0,8621 | |||
| VBR / Vanguard Index Funds - Vanguard Small-Cap Value ETF | 0,02 | 374,52 | 3,01 | 396,70 | 1,0087 | 0,8072 | |||
| REZI / Resideo Technologies, Inc. | 0,14 | 3,00 | 1,0046 | 1,0046 | |||||
| OI / O-I Glass, Inc. | 0,20 | 2,98 | 0,9983 | 0,9983 | |||||
| AL / Air Lease Corporation | 0,05 | 2,95 | 0,9899 | 0,9899 | |||||
| OZK / Bank OZK | 0,06 | 2,94 | 0,9860 | 0,9860 | |||||
| PSMT / PriceSmart, Inc. | 0,03 | -16,10 | 2,94 | 0,31 | 0,9860 | 0,0105 | |||
| AFG / American Financial Group, Inc. | 0,02 | -4,35 | 2,94 | -8,08 | 0,9839 | -0,0784 | |||
| AIR / AAR Corp. | 0,04 | 2,93 | 0,9815 | 0,9815 | |||||
| ABCB / Ameris Bancorp | 0,05 | -6,91 | 2,92 | 4,62 | 0,9797 | 0,0503 | |||
| CTRE / CareTrust REIT, Inc. | 0,10 | -17,68 | 2,92 | -11,87 | 0,9783 | -0,1232 | |||
| NXST / Nexstar Media Group, Inc. | 0,02 | 2,90 | 0,9725 | 0,9725 | |||||
| AVA / Avista Corporation | 0,08 | -10,44 | 2,88 | -18,81 | 0,9665 | -0,2151 | |||
| OMC / Omnicom Group Inc. | 0,04 | -3,90 | 2,88 | -16,62 | 0,9650 | -0,1835 | |||
| ATR / AptarGroup, Inc. | 0,02 | -3,63 | 2,84 | 1,61 | 0,9508 | 0,0220 | |||
| EG / Everest Group, Ltd. | 0,01 | -9,06 | 2,83 | -14,95 | 0,9496 | -0,1584 | |||
| CWT / California Water Service Group | 0,06 | -10,84 | 2,81 | -16,34 | 0,9420 | -0,1753 | |||
| DRI / Darden Restaurants, Inc. | 0,01 | -11,90 | 2,74 | -7,59 | 0,9184 | -0,0678 | |||
| AAP / Advance Auto Parts, Inc. | 0,06 | -12,46 | 2,73 | 3,77 | 0,9141 | 0,0401 | |||
| WSC / WillScot Holdings Corporation | 0,10 | 2,70 | 0,9035 | 0,9035 | |||||
| ADC / Agree Realty Corporation | 0,04 | 0,53 | 2,69 | -4,84 | 0,9028 | -0,0388 | |||
| CUBE / CubeSmart | 0,06 | -1,84 | 2,61 | -2,32 | 0,8762 | -0,0141 | |||
| VMC / Vulcan Materials Company | 0,01 | -6,35 | 2,61 | 4,69 | 0,8759 | 0,0456 | |||
| CIEN / Ciena Corporation | 0,03 | -8,04 | 2,60 | 23,73 | 0,8722 | 0,1728 | |||
| NOV / NOV Inc. | 0,21 | -11,32 | 2,59 | -27,58 | 0,8678 | -0,3214 | |||
| ETSY / Etsy, Inc. | 0,05 | -10,30 | 2,59 | -4,65 | 0,8665 | -0,0352 | |||
| PTEN / Patterson-UTI Energy, Inc. | 0,43 | 19,98 | 2,58 | -13,44 | 0,8633 | -0,1266 | |||
| EPR / EPR Properties | 0,04 | -4,65 | 2,53 | 5,58 | 0,8492 | 0,0510 | |||
| SNEX / StoneX Group Inc. | 0,03 | -8,56 | 2,40 | 9,09 | 0,8045 | 0,0727 | |||
| PINC / Premier, Inc. | 0,11 | -21,30 | 2,40 | -10,48 | 0,8043 | -0,0874 | |||
| CART / Maplebear Inc. | 0,05 | 2,36 | 0,7897 | 0,7897 | |||||
| FULT / Fulton Financial Corporation | 0,13 | -6,77 | 2,35 | -7,01 | 0,7866 | -0,0531 | |||
| GTES / Gates Industrial Corporation plc | 0,10 | -8,84 | 2,34 | 14,02 | 0,7850 | 0,1018 | |||
| MMS / Maximus, Inc. | 0,03 | -7,80 | 2,34 | -5,11 | 0,7845 | -0,0358 | |||
| CACI / CACI International Inc | 0,00 | -10,43 | 2,31 | 16,39 | 0,7735 | 0,1138 | |||
| BRBR / BellRing Brands, Inc. | 0,04 | -5,20 | 2,30 | -26,26 | 0,7709 | -0,2665 | |||
| CNO / CNO Financial Group, Inc. | 0,06 | -6,39 | 2,24 | -13,29 | 0,7521 | -0,1087 | |||
| MSM / MSC Industrial Direct Co., Inc. | 0,03 | -3,54 | 2,19 | 5,59 | 0,7348 | 0,0441 | |||
| HTO / H2O America | 0,04 | -5,19 | 2,15 | -9,89 | 0,7206 | -0,0732 | |||
| PNW / Pinnacle West Capital Corporation | 0,02 | -2,75 | 2,10 | -8,64 | 0,7052 | -0,0610 | |||
| UNF / UniFirst Corporation | 0,01 | -7,96 | 2,07 | -0,43 | 0,6936 | 0,0022 | |||
| ITT / ITT Inc. | 0,01 | 2,07 | 0,6923 | 0,6923 | |||||
| EHC / Encompass Health Corporation | 0,02 | -5,13 | 2,05 | 14,88 | 0,6859 | 0,0933 | |||
| RJF / Raymond James Financial, Inc. | 0,01 | 2,04 | 0,6828 | 0,6828 | |||||
| FSLR / First Solar, Inc. | 0,01 | 1,86 | 0,6224 | 0,6224 | |||||
| PAG / Penske Automotive Group, Inc. | 0,01 | -5,94 | 1,82 | 12,21 | 0,6097 | 0,0706 | |||
| BBH Overnight Sweep / STIV (N/A) | 1,81 | 0,6065 | 0,6065 | ||||||
| AXTA / Axalta Coating Systems Ltd. | 0,06 | 0,82 | 1,81 | -9,78 | 0,6062 | -0,0605 | |||
| SF / Stifel Financial Corp. | 0,02 | -5,14 | 1,76 | 4,39 | 0,5901 | 0,0294 | |||
| NBTB / NBT Bancorp Inc. | 0,04 | 6,44 | 1,68 | 3,13 | 0,5628 | 0,0210 | |||
| GO / Grocery Outlet Holding Corp. | 0,13 | 1,65 | 0,5513 | 0,5513 | |||||
| ARI / Apollo Commercial Real Estate Finance, Inc. | 0,17 | -8,10 | 1,64 | -7,05 | 0,5484 | -0,0371 | |||
| FCPT / Four Corners Property Trust, Inc. | 0,06 | -5,83 | 1,63 | -11,67 | 0,5453 | -0,0676 | |||
| HOG / Harley-Davidson, Inc. | 0,07 | -1,16 | 1,61 | -7,63 | 0,5395 | -0,0401 | |||
| ALRM / Alarm.com Holdings, Inc. | 0,03 | 1,54 | 0,5168 | 0,5168 | |||||
| MTCH / Match Group, Inc. | 0,05 | -6,78 | 1,54 | -7,67 | 0,5165 | -0,0389 | |||
| RAMP / LiveRamp Holdings, Inc. | 0,05 | 0,46 | 1,50 | 27,01 | 0,5027 | 0,1098 | |||
| SAH / Sonic Automotive, Inc. | 0,02 | -13,19 | 1,47 | 21,88 | 0,4910 | 0,0910 | |||
| ORA / Ormat Technologies, Inc. | 0,02 | -11,26 | 1,42 | 5,05 | 0,4742 | 0,0261 | |||
| AIN / Albany International Corp. | 0,02 | -11,43 | 1,39 | -10,02 | 0,4665 | -0,0481 | |||
| MGM / MGM Resorts International | 0,04 | -17,77 | 1,36 | -4,63 | 0,4560 | -0,0184 | |||
| AHCO / AdaptHealth Corp. | 0,14 | -7,45 | 1,34 | -19,49 | 0,4486 | -0,1044 | |||
| ROL / Rollins, Inc. | 0,02 | -7,41 | 1,31 | -3,31 | 0,4402 | -0,0116 | |||
| POST / Post Holdings, Inc. | 0,01 | -10,50 | 1,22 | -16,12 | 0,4099 | -0,0752 | |||
| DV / DoubleVerify Holdings, Inc. | 0,08 | -9,28 | 1,21 | 1,51 | 0,4058 | 0,0093 | |||
| CSGS / CSG Systems International, Inc. | 0,02 | 1,17 | 0,3906 | 0,3906 | |||||
| GSIG / Goldman Sachs ETF Trust - Goldman Sachs Access Investment Grade Corporate 1-5 Year Bond ETF | 0,01 | 1,10 | 0,3678 | 0,3678 | |||||
| WFRD / Weatherford International plc | 0,02 | -4,33 | 1,09 | -10,12 | 0,3661 | -0,0381 | |||
| EEFT / Euronet Worldwide, Inc. | 0,01 | 5,68 | 1,09 | 0,28 | 0,3655 | 0,0037 | |||
| EVTC / EVERTEC, Inc. | 0,03 | 1,08 | 0,3626 | 0,3626 | |||||
| GTY / Getty Realty Corp. | 0,04 | -7,21 | 1,06 | -17,70 | 0,3552 | -0,0734 | |||
| ADUS / Addus HomeCare Corporation | 0,01 | -6,78 | 1,05 | 8,57 | 0,3523 | 0,0303 | |||
| OFG / OFG Bancorp | 0,02 | -9,77 | 1,05 | -3,58 | 0,3522 | -0,0100 | |||
| LKFN / Lakeland Financial Corporation | 0,02 | -4,52 | 0,99 | -1,30 | 0,3311 | -0,0018 | |||
| EZPW / EZCORP, Inc. | 0,07 | -6,15 | 0,97 | -11,52 | 0,3246 | -0,0394 | |||
| YETI / YETI Holdings, Inc. | 0,03 | 0,96 | 0,3226 | 0,3226 | |||||
| SXC / SunCoke Energy, Inc. | 0,11 | -10,21 | 0,94 | -16,19 | 0,3142 | -0,0578 | |||
| PLAB / Photronics, Inc. | 0,05 | -8,17 | 0,91 | -16,68 | 0,3063 | -0,0587 | |||
| CXM / Sprinklr, Inc. | 0,10 | 0,85 | 0,2862 | 0,2862 | |||||
| WABC / Westamerica Bancorporation | 0,02 | -6,52 | 0,78 | -10,60 | 0,2630 | -0,0288 | |||
| INVX / Innovex International, Inc. | 0,05 | -8,16 | 0,78 | -20,10 | 0,2612 | -0,0633 | |||
| DGII / Digi International Inc. | 0,02 | -4,55 | 0,72 | 19,57 | 0,2398 | 0,0408 | |||
| SITC / SITE Centers Corp. | 0,06 | -12,15 | 0,68 | -22,60 | 0,2272 | -0,0642 | |||
| HSII / Heidrick & Struggles International, Inc. | 0,01 | -6,44 | 0,58 | 0,00 | 0,1936 | 0,0014 | |||
| MGPI / MGP Ingredients, Inc. | 0,02 | -16,13 | 0,51 | -14,48 | 0,1703 | -0,0273 | |||
| AAT / American Assets Trust, Inc. | 0,03 | -10,34 | 0,50 | -12,06 | 0,1662 | -0,0214 | |||
| SCVL / Shoe Carnival, Inc. | 0,02 | -7,85 | 0,44 | -21,57 | 0,1475 | -0,0392 | |||
| MCW / Mister Car Wash, Inc. | 0,07 | -2,47 | 0,42 | -25,80 | 0,1411 | -0,0474 | |||
| CXW / CoreCivic, Inc. | 0,00 | -100,00 | 0,00 | -100,00 | -0,5054 | ||||
| RS / Reliance, Inc. | 0,00 | -100,00 | 0,00 | -100,00 | -1,6585 | ||||
| RS / Reliance, Inc. | 0,00 | -100,00 | 0,00 | -100,00 | -1,6585 | ||||
| AMCR / Amcor plc | 0,00 | -100,00 | 0,00 | -100,00 | -0,9937 | ||||
| CATY / Cathay General Bancorp | 0,00 | -100,00 | 0,00 | -100,00 | -0,7372 | ||||
| AMR / Alpha Metallurgical Resources, Inc. | 0,00 | -100,00 | 0,00 | -100,00 | -0,6864 |