Statistiques de base
| Valeur du portefeuille | $ 373 020 726 |
| Positions actuelles | 80 |
Dernières positions, performances, ASG (à partir des dépôts 13F, 13D)
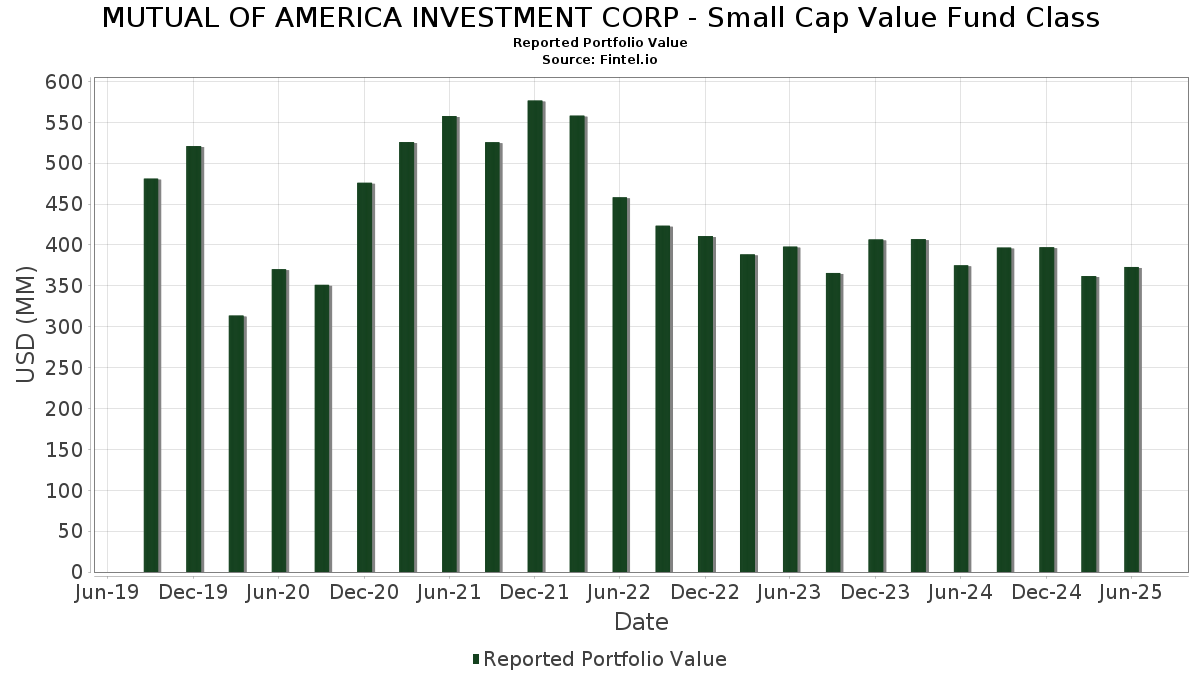
MUTUAL OF AMERICA INVESTMENT CORP - Small Cap Value Fund Class a déclaré un total de 80 positions dans ses derniers dépôts auprès de la SEC. La valeur la plus récente du portefeuille est calculée à 373 020 726 USD. Les actifs sous gestion réels (ASG) sont cette valeur plus les liquidités (qui ne sont pas divulguées). Les principales positions de MUTUAL OF AMERICA INVESTMENT CORP - Small Cap Value Fund Class sont American Healthcare REIT, Inc. (US:AHR) , Stock Yards Bancorp, Inc. (US:SYBT) , Mueller Industries, Inc. (US:MLI) , Essent Group Ltd. (US:ESNT) , and VSE Corporation (US:VSEC) . Les nouvelles positions de MUTUAL OF AMERICA INVESTMENT CORP - Small Cap Value Fund Class incluent RLI Corp. (US:RLI) , Core Scientific, Inc. (US:CORZ) , Simpson Manufacturing Co., Inc. (US:SSD) , Installed Building Products, Inc. (US:IBP) , and Curbline Properties Corp. (US:CURB) .
Meilleures augmentations ce trimestre
Nous utilisons la variation de l'allocation du portefeuille car il s'agit de l'indicateur le plus significatif. Les changements peuvent être dus à des transactions ou à des variations de prix des actions.
| Titre | Actions (en millions) |
Valeur ($ en millions) |
% du portefeuille | ΔPortefeuille % |
|---|---|---|---|---|
| 0,09 | 6,37 | 1,7047 | 1,7047 | |
| 0,24 | 4,10 | 1,0965 | 1,0965 | |
| 0,02 | 3,63 | 0,9718 | 0,9718 | |
| 0,02 | 3,51 | 0,9397 | 0,9397 | |
| 0,15 | 3,32 | 0,8873 | 0,8873 | |
| 0,06 | 3,30 | 0,8821 | 0,8821 | |
| 3,00 | 0,8023 | 0,8023 | ||
| 0,03 | 2,74 | 0,7326 | 0,7326 | |
| 0,09 | 2,72 | 0,7282 | 0,7282 | |
| 0,07 | 2,43 | 0,6493 | 0,6493 |
Principales baisses ce trimestre
Nous utilisons la variation de l'allocation du portefeuille car il s'agit de l'indicateur le plus significatif. Les changements peuvent être dus à des transactions ou à des variations de prix des actions.
| Titre | Actions (en millions) |
Valeur ($ en millions) |
% du portefeuille | ΔPortefeuille % |
|---|---|---|---|---|
| 0,05 | 3,42 | 0,9148 | -0,9331 | |
| 0,10 | 3,65 | 0,9776 | -0,6138 | |
| 0,09 | 4,63 | 1,2392 | -0,2990 | |
| 0,14 | 5,34 | 1,4299 | -0,2688 | |
| 0,22 | 2,52 | 0,6742 | -0,2412 | |
| 0,07 | 5,52 | 1,4768 | -0,2399 | |
| 0,06 | 2,25 | 0,6033 | -0,2324 | |
| 0,07 | 5,60 | 1,4994 | -0,2131 | |
| 0,07 | 6,20 | 1,6580 | -0,1628 | |
| 0,01 | 1,77 | 0,4744 | -0,1383 |
Déclarations 13F et dépôts de fonds
Ce formulaire a été déposé le 2025-08-25 pour la période de déclaration 2025-06-30. Cliquez sur l'icône du lien pour voir l'historique complet des transactions.
Mettre à niveau pour débloquer les données premium et exporter vers Excel ![]() .
.
| Titre | Type | Prix moyen de l'action | Actions (en millions) |
ΔActions (%) |
ΔActions (%) |
Valeur ($ en millions) |
Portefeuille (%) |
ΔPortefeuille (%) |
|
|---|---|---|---|---|---|---|---|---|---|
| AHR / American Healthcare REIT, Inc. | 0,29 | -3,12 | 10,81 | 17,48 | 2,8926 | 0,3523 | |||
| SYBT / Stock Yards Bancorp, Inc. | 0,12 | -1,10 | 9,87 | 13,11 | 2,6422 | 0,2323 | |||
| MLI / Mueller Industries, Inc. | 0,12 | 4,78 | 9,74 | 9,36 | 2,6072 | 0,1477 | |||
| ESNT / Essent Group Ltd. | 0,14 | -3,16 | 8,59 | 1,90 | 2,2998 | -0,0289 | |||
| VSEC / VSE Corporation | 0,06 | 4,78 | 8,30 | 14,38 | 2,2205 | 0,2176 | |||
| STVN / Stevanato Group S.p.A. | 0,34 | 4,78 | 8,24 | 25,35 | 2,2060 | 0,3905 | |||
| TDS / Telephone and Data Systems, Inc. | 0,21 | 39,53 | 7,63 | 28,16 | 2,0429 | 0,3982 | |||
| NPO / Enpro Inc. | 0,04 | -7,10 | 7,47 | 9,98 | 1,9998 | 0,1241 | |||
| WTFC / Wintrust Financial Corporation | 0,06 | 4,78 | 7,22 | 15,50 | 1,9331 | 0,2066 | |||
| HWC / Hancock Whitney Corporation | 0,12 | -1,43 | 7,16 | 7,87 | 1,9154 | 0,0835 | |||
| UMBF / UMB Financial Corporation | 0,07 | -3,90 | 7,06 | -0,04 | 1,8897 | -0,0606 | |||
| GABC / German American Bancorp, Inc. | 0,18 | 4,78 | 6,97 | 7,61 | 1,8663 | 0,0769 | |||
| EFSC / Enterprise Financial Services Corp | 0,12 | -0,75 | 6,89 | 1,77 | 1,8433 | -0,0255 | |||
| FA / First Advantage Corporation | 0,41 | -5,14 | 6,88 | 11,82 | 1,8402 | 0,1425 | |||
| FFIN / First Financial Bankshares, Inc. | 0,19 | 22,35 | 6,71 | 22,57 | 1,7948 | 0,2839 | |||
| UFPI / UFP Industries, Inc. | 0,07 | 4,78 | 6,63 | -2,74 | 1,7741 | -0,1077 | |||
| RLI / RLI Corp. | 0,09 | 6,37 | 1,7047 | 1,7047 | |||||
| TTMI / TTM Technologies, Inc. | 0,15 | -19,07 | 6,32 | 61,08 | 1,6912 | 0,6079 | |||
| SSB / SouthState Corporation | 0,07 | 16,80 | 6,30 | 15,80 | 1,6852 | 0,1839 | |||
| BLFS / BioLife Solutions, Inc. | 0,29 | 21,61 | 6,29 | 14,68 | 1,6837 | 0,1692 | |||
| MTN / Vail Resorts, Inc. | 0,04 | -1,14 | 6,28 | -2,94 | 1,6810 | -0,1056 | |||
| SIGI / Selective Insurance Group, Inc. | 0,07 | -0,75 | 6,20 | -6,05 | 1,6580 | -0,1628 | |||
| JHG / Janus Henderson Group plc | 0,16 | 7,60 | 6,18 | 15,61 | 1,6551 | 0,1781 | |||
| NOG / Northern Oil and Gas, Inc. | 0,21 | 4,78 | 5,93 | -1,74 | 1,5868 | -0,0792 | |||
| PR / Permian Resources Corporation | 0,41 | 4,78 | 5,62 | 3,04 | 1,5046 | -0,0019 | |||
| WH / Wyndham Hotels & Resorts, Inc. | 0,07 | 0,67 | 5,60 | -9,67 | 1,4994 | -0,2131 | |||
| SR / Spire Inc. | 0,08 | 71,16 | 5,57 | 59,64 | 1,4896 | 0,5270 | |||
| TMHC / Taylor Morrison Home Corporation | 0,09 | -0,70 | 5,55 | 1,57 | 1,4853 | -0,0231 | |||
| SFBS / ServisFirst Bancshares, Inc. | 0,07 | -5,42 | 5,52 | -11,24 | 1,4768 | -0,2399 | |||
| HTO / H2O America | 0,11 | 39,24 | 5,51 | 32,33 | 1,4758 | 0,3251 | |||
| KRG / Kite Realty Group Trust | 0,24 | -0,05 | 5,51 | 1,19 | 1,4746 | -0,0287 | |||
| SBRA / Sabra Health Care REIT, Inc. | 0,30 | -2,86 | 5,48 | 2,53 | 1,4668 | -0,0091 | |||
| OVV / Ovintiv Inc. | 0,14 | -2,32 | 5,34 | -13,17 | 1,4299 | -0,2688 | |||
| KWR / Quaker Chemical Corporation | 0,05 | 4,78 | 5,21 | -5,12 | 1,3941 | -0,1217 | |||
| BKH / Black Hills Corporation | 0,09 | 4,89 | 5,08 | -2,98 | 1,3592 | -0,0861 | |||
| ARLO / Arlo Technologies, Inc. | 0,29 | -3,33 | 4,92 | 66,14 | 1,3158 | 0,4986 | |||
| NWE / NorthWestern Energy Group, Inc. | 0,09 | 25,89 | 4,85 | 11,62 | 1,2986 | 0,0981 | |||
| TCBK / TriCo Bancshares | 0,11 | -3,53 | 4,63 | -2,28 | 1,2395 | -0,0690 | |||
| ASH / Ashland Inc. | 0,09 | -2,00 | 4,63 | -16,89 | 1,2392 | -0,2990 | |||
| CUZ / Cousins Properties Incorporated | 0,14 | 4,78 | 4,30 | 6,67 | 1,1512 | 0,0377 | |||
| ACA / Arcosa, Inc. | 0,05 | -16,22 | 4,26 | -5,81 | 1,1411 | -0,1087 | |||
| CORZ / Core Scientific, Inc. | 0,24 | 4,10 | 1,0965 | 1,0965 | |||||
| BANF / BancFirst Corporation | 0,03 | -30,72 | 3,86 | 21,41 | 1,0337 | 0,4848 | |||
| SF / Stifel Financial Corp. | 0,04 | 4,78 | 3,78 | 15,36 | 1,0110 | 0,1069 | |||
| MLR / Miller Industries, Inc. | 0,08 | 4,78 | 3,77 | 9,96 | 1,0080 | 0,0622 | |||
| SUPN / Supernus Pharmaceuticals, Inc. | 0,12 | 4,78 | 3,75 | 0,86 | 1,0045 | -0,0231 | |||
| FOXF / Fox Factory Holding Corp. | 0,14 | 4,78 | 3,67 | 16,49 | 0,9833 | 0,1122 | |||
| PCH / PotlatchDeltic Corporation | 0,10 | -25,47 | 3,65 | -36,63 | 0,9776 | -0,6138 | |||
| SSD / Simpson Manufacturing Co., Inc. | 0,02 | 3,63 | 0,9718 | 0,9718 | |||||
| MIDD / The Middleby Corporation | 0,02 | 4,78 | 3,52 | -0,73 | 0,9433 | -0,0370 | |||
| IBP / Installed Building Products, Inc. | 0,02 | 3,51 | 0,9397 | 0,9397 | |||||
| CORT / Corcept Therapeutics Incorporated | 0,05 | -20,52 | 3,42 | -48,92 | 0,9148 | -0,9331 | |||
| DGII / Digi International Inc. | 0,10 | -5,15 | 3,32 | 18,80 | 0,8898 | 0,1171 | |||
| CURB / Curbline Properties Corp. | 0,15 | 3,32 | 0,8873 | 0,8873 | |||||
| XHR / Xenia Hotels & Resorts, Inc. | 0,26 | 4,78 | 3,31 | 12,01 | 0,8863 | 0,0699 | |||
| MRCY / Mercury Systems, Inc. | 0,06 | 3,30 | 0,8821 | 0,8821 | |||||
| TRNO / Terreno Realty Corporation | 0,06 | 4,78 | 3,26 | -7,07 | 0,8732 | -0,0962 | |||
| NOMD / Nomad Foods Limited | 0,19 | 4,78 | 3,17 | -9,40 | 0,8488 | -0,1178 | |||
| VCEL / Vericel Corporation | 0,07 | 4,78 | 3,07 | -0,10 | 0,8224 | -0,0267 | |||
| United States Treasury Bill / DBT (US912797PZ47) | 3,00 | 0,8023 | 0,8023 | ||||||
| GDEN / Golden Entertainment, Inc. | 0,10 | 0,00 | 2,95 | 11,52 | 0,7904 | 0,0592 | |||
| CWGL / Crimson Wine Group, Ltd. | 0,51 | 0,00 | 2,79 | -4,52 | 0,7465 | -0,0601 | |||
| IOSP / Innospec Inc. | 0,03 | 2,74 | 0,7326 | 0,7326 | |||||
| EPRT / Essential Properties Realty Trust, Inc. | 0,09 | 2,72 | 0,7282 | 0,7282 | |||||
| LBRT / Liberty Energy Inc. | 0,22 | 4,78 | 2,52 | -24,01 | 0,6742 | -0,2412 | |||
| VNT / Vontier Corporation | 0,07 | 2,43 | 0,6493 | 0,6493 | |||||
| RNA / Avidity Biosciences, Inc. | 0,08 | 4,78 | 2,36 | 0,81 | 0,6322 | -0,0148 | |||
| NE / Noble Corporation plc | 0,09 | 4,78 | 2,36 | 17,35 | 0,6319 | 0,0765 | |||
| FWRG / First Watch Restaurant Group, Inc. | 0,15 | -5,67 | 2,34 | -9,10 | 0,6257 | -0,0847 | |||
| OMCL / Omnicell, Inc. | 0,08 | 4,78 | 2,28 | -11,89 | 0,6109 | -0,1044 | |||
| PJT / PJT Partners Inc. | 0,01 | 2,28 | 0,6103 | 0,6103 | |||||
| TARS / Tarsus Pharmaceuticals, Inc. | 0,06 | -5,56 | 2,25 | -25,51 | 0,6033 | -0,2324 | |||
| CTO / CTO Realty Growth, Inc. | 0,13 | 4,78 | 2,21 | -6,37 | 0,5903 | -0,0600 | |||
| MTRN / Materion Corporation | 0,03 | 4,78 | 2,15 | 1,94 | 0,5757 | -0,0071 | |||
| ICHR / Ichor Holdings, Ltd. | 0,10 | 4,78 | 1,98 | -8,98 | 0,5289 | -0,0706 | |||
| KRYS / Krystal Biotech, Inc. | 0,01 | 4,78 | 1,77 | -20,14 | 0,4744 | -0,1383 | |||
| SLNO / Soleno Therapeutics, Inc. | 0,02 | 4,78 | 1,64 | 22,87 | 0,4401 | 0,0705 | |||
| ANNX / Annexon, Inc. | 0,49 | 4,78 | 1,18 | 30,28 | 0,3156 | 0,0657 | |||
| XENE / Xenon Pharmaceuticals Inc. | 0,04 | 1,18 | 0,3148 | 0,3148 | |||||
| DIRXX / Dreyfus Treasury Securities Cash Management - Dreyfus Treasury Securities Cash Management Institutional Shares | 0,85 | 0,85 | 0,2276 | 0,2276 |