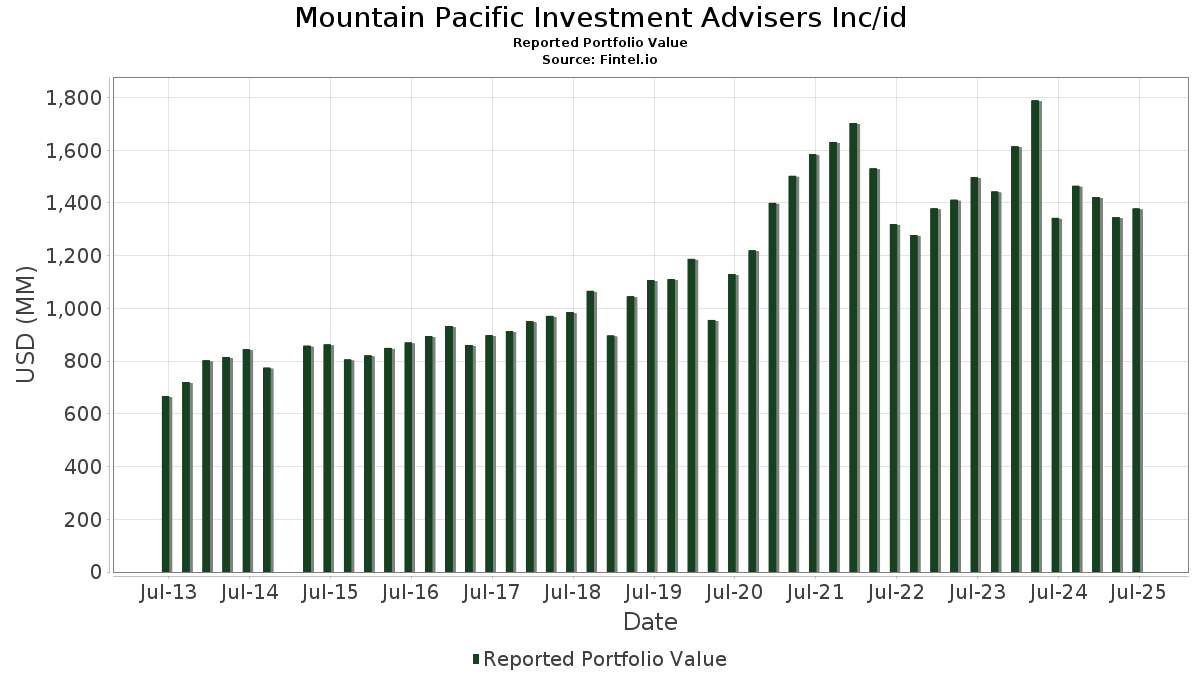
Statistiques de base
| Valeur du portefeuille | $ 1 378 481 121 |
| Positions actuelles | 139 |
Dernières positions, performances, ASG (à partir des dépôts 13F, 13D)
Mountain Pacific Investment Advisers Inc/id a déclaré un total de 139 positions dans ses derniers dépôts auprès de la SEC. La valeur la plus récente du portefeuille est calculée à 1 378 481 121 USD. Les actifs sous gestion réels (ASG) sont cette valeur plus les liquidités (qui ne sont pas divulguées). Les principales positions de Mountain Pacific Investment Advisers Inc/id sont Amphenol Corporation (US:APH) , Fiserv, Inc. (US:FI) , AMETEK, Inc. (US:AME) , Arthur J. Gallagher & Co. (US:AJG) , and Vertiv Holdings Co (US:VRT) . Les nouvelles positions de Mountain Pacific Investment Advisers Inc/id incluent Stride, Inc. (US:LRN) , Ralliant Corporation (US:RAL) , Glacier Bancorp, Inc. (US:GBCI) , GE Vernova Inc. (US:GEV) , and .
Meilleures augmentations ce trimestre
Nous utilisons la variation de l'allocation du portefeuille car il s'agit de l'indicateur le plus significatif. Les changements peuvent être dus à des transactions ou à des variations de prix des actions.
| Titre | Actions (en millions) |
Valeur ($ en millions) |
% du portefeuille | ΔPortefeuille % |
|---|---|---|---|---|
| 0,96 | 94,88 | 6,8832 | 1,6054 | |
| 0,40 | 51,07 | 3,7045 | 1,5313 | |
| 0,08 | 41,27 | 2,9936 | 1,1394 | |
| 0,23 | 14,53 | 1,0542 | 0,5310 | |
| 0,04 | 5,41 | 0,3924 | 0,3924 | |
| 0,09 | 34,50 | 2,5027 | 0,3568 | |
| 0,10 | 24,15 | 1,7519 | 0,3337 | |
| 0,03 | 10,76 | 0,7803 | 0,3266 | |
| 0,21 | 15,36 | 1,1144 | 0,3031 | |
| 0,07 | 3,46 | 0,2506 | 0,2506 |
Principales baisses ce trimestre
Nous utilisons la variation de l'allocation du portefeuille car il s'agit de l'indicateur le plus significatif. Les changements peuvent être dus à des transactions ou à des variations de prix des actions.
| Titre | Actions (en millions) |
Valeur ($ en millions) |
% du portefeuille | ΔPortefeuille % |
|---|---|---|---|---|
| 0,43 | 73,35 | 5,3207 | -1,8617 | |
| 0,18 | 56,33 | 4,0867 | -0,5658 | |
| 0,21 | 11,14 | 0,8084 | -0,4931 | |
| 0,29 | 27,44 | 1,9906 | -0,4053 | |
| 0,04 | 16,29 | 1,1815 | -0,3694 | |
| 0,18 | 25,03 | 1,8154 | -0,2723 | |
| 0,09 | 48,88 | 3,5459 | -0,2693 | |
| 0,20 | 40,29 | 2,9226 | -0,2522 | |
| 0,01 | 1,99 | 0,1442 | -0,2456 | |
| 0,24 | 42,37 | 3,0739 | -0,1837 |
Déclarations 13F et dépôts de fonds
Ce formulaire a été déposé le 2025-07-18 pour la période de déclaration 2025-06-30. Cliquez sur l'icône du lien pour voir l'historique complet des transactions.
Mettre à niveau pour débloquer les données premium et exporter vers Excel ![]() .
.
| Titre | Type | Prix moyen de l'action | Actions (en millions) |
ΔActions (%) |
ΔActions (%) |
Valeur ($ en millions) |
Portefeuille (%) |
ΔPortefeuille (%) |
|
|---|---|---|---|---|---|---|---|---|---|
| APH / Amphenol Corporation | 0,96 | -11,23 | 94,88 | 33,65 | 6,8832 | 1,6054 | |||
| FI / Fiserv, Inc. | 0,43 | -2,76 | 73,35 | -24,08 | 5,3207 | -1,8617 | |||
| AME / AMETEK, Inc. | 0,36 | -2,26 | 64,37 | 2,75 | 4,6696 | 0,0124 | |||
| AJG / Arthur J. Gallagher & Co. | 0,18 | -2,92 | 56,33 | -9,99 | 4,0867 | -0,5658 | |||
| VRT / Vertiv Holdings Co | 0,40 | -1,78 | 51,07 | 74,69 | 3,7045 | 1,5313 | |||
| VRSK / Verisk Analytics, Inc. | 0,16 | -2,02 | 49,51 | 2,55 | 3,5915 | 0,0025 | |||
| ROP / Roper Technologies, Inc. | 0,09 | -0,94 | 48,88 | -4,75 | 3,5459 | -0,2693 | |||
| ATR / AptarGroup, Inc. | 0,30 | -1,37 | 47,41 | 3,98 | 3,4389 | 0,0498 | |||
| IEX / IDEX Corporation | 0,24 | -0,33 | 42,37 | -3,30 | 3,0739 | -0,1837 | |||
| FIX / Comfort Systems USA, Inc. | 0,08 | -0,54 | 41,27 | 65,45 | 2,9936 | 1,1394 | |||
| DHR / Danaher Corporation | 0,20 | -2,10 | 40,29 | -5,66 | 2,9226 | -0,2522 | |||
| XYL / Xylem Inc. | 0,31 | -0,71 | 40,22 | 7,51 | 2,9177 | 0,1366 | |||
| GGG / Graco Inc. | 0,44 | -0,82 | 37,49 | 2,10 | 2,7194 | -0,0100 | |||
| RBC / RBC Bearings Incorporated | 0,09 | -0,06 | 34,50 | 19,51 | 2,5027 | 0,3568 | |||
| FAST / Fastenal Company | 0,77 | 96,93 | 32,17 | 6,65 | 2,3336 | 0,0914 | |||
| AIZ / Assurant, Inc. | 0,15 | 0,86 | 29,93 | -5,04 | 2,1713 | -0,1719 | |||
| DCI / Donaldson Company, Inc. | 0,43 | -5,32 | 29,63 | -2,09 | 2,1492 | -0,1002 | |||
| NDSN / Nordson Corporation | 0,14 | -0,75 | 29,31 | 5,47 | 2,1263 | 0,0604 | |||
| FIS / Fidelity National Information Services, Inc. | 0,35 | -2,31 | 28,47 | 6,49 | 2,0657 | 0,0779 | |||
| CHD / Church & Dwight Co., Inc. | 0,29 | -2,47 | 27,44 | -14,86 | 1,9906 | -0,4053 | |||
| RPM / RPM International Inc. | 0,24 | -0,43 | 26,27 | -5,46 | 1,9060 | -0,1599 | |||
| CSW / CSW Industrials, Inc. | 0,09 | 0,00 | 25,91 | -1,61 | 1,8797 | -0,0781 | |||
| LSTR / Landstar System, Inc. | 0,18 | -3,72 | 25,03 | -10,89 | 1,8154 | -0,2723 | |||
| CLH / Clean Harbors, Inc. | 0,11 | 0,03 | 24,74 | 17,32 | 1,7946 | 0,2270 | |||
| UFPT / UFP Technologies, Inc. | 0,10 | 4,58 | 24,15 | 26,59 | 1,7519 | 0,3337 | |||
| MSA / MSA Safety Incorporated | 0,14 | -0,56 | 23,01 | 13,57 | 1,6689 | 0,1629 | |||
| KAI / Kadant Inc. | 0,06 | -0,23 | 17,88 | -5,99 | 1,2972 | -0,1169 | |||
| FCN / FTI Consulting, Inc. | 0,11 | -0,15 | 17,16 | -1,72 | 1,2449 | -0,0532 | |||
| TMO / Thermo Fisher Scientific Inc. | 0,04 | -4,19 | 16,29 | -21,93 | 1,1815 | -0,3694 | |||
| NVT / nVent Electric plc | 0,21 | 0,73 | 15,36 | 40,76 | 1,1144 | 0,3031 | |||
| PRGS / Progress Software Corporation | 0,23 | 66,61 | 14,53 | 106,49 | 1,0542 | 0,5310 | |||
| AIT / Applied Industrial Technologies, Inc. | 0,06 | 0,70 | 14,21 | 3,88 | 1,0309 | 0,0139 | |||
| BSV / Vanguard Bond Index Funds - Vanguard Short-Term Bond ETF | 0,17 | -1,57 | 13,70 | -1,04 | 0,9938 | -0,0354 | |||
| WINA / Winmark Corporation | 0,03 | 9,56 | 12,76 | 30,16 | 0,9258 | 0,1968 | |||
| FTV / Fortive Corporation | 0,21 | -10,64 | 11,14 | -36,35 | 0,8084 | -0,4931 | |||
| MUSA / Murphy USA Inc. | 0,03 | 103,53 | 10,76 | 76,24 | 0,7803 | 0,3266 | |||
| COST / Costco Wholesale Corporation | 0,01 | -0,10 | 9,97 | 4,57 | 0,7234 | 0,0144 | |||
| ECL / Ecolab Inc. | 0,03 | -5,85 | 9,11 | 0,07 | 0,6610 | -0,0159 | |||
| MMSI / Merit Medical Systems, Inc. | 0,09 | 34,10 | 8,78 | 18,59 | 0,6372 | 0,0866 | |||
| VCSH / Vanguard Scottsdale Funds - Vanguard Short-Term Corporate Bond ETF | 0,10 | -5,06 | 7,56 | -4,38 | 0,5482 | -0,0394 | |||
| SPGI / S&P Global Inc. | 0,01 | -10,41 | 7,55 | -7,02 | 0,5475 | -0,0560 | |||
| CNMD / CONMED Corporation | 0,14 | 3,68 | 7,28 | -10,59 | 0,5282 | -0,0772 | |||
| JPM / JPMorgan Chase & Co. | 0,02 | -3,53 | 6,39 | 14,02 | 0,4639 | 0,0469 | |||
| MSFT / Microsoft Corporation | 0,01 | -0,30 | 6,12 | 32,12 | 0,4438 | 0,0995 | |||
| VLTO / Veralto Corporation | 0,06 | -3,01 | 5,59 | 0,47 | 0,4055 | -0,0081 | |||
| LRN / Stride, Inc. | 0,04 | 5,41 | 0,3924 | 0,3924 | |||||
| MOD / Modine Manufacturing Company | 0,05 | -0,03 | 5,26 | 28,30 | 0,3812 | 0,0767 | |||
| XOM / Exxon Mobil Corporation | 0,04 | 0,54 | 4,04 | -8,86 | 0,2932 | -0,0365 | |||
| ADP / Automatic Data Processing, Inc. | 0,01 | -3,36 | 3,99 | -2,47 | 0,2893 | -0,0146 | |||
| PNR / Pentair plc | 0,04 | -0,85 | 3,89 | 16,35 | 0,2824 | 0,0337 | |||
| AAPL / Apple Inc. | 0,02 | -18,84 | 3,77 | -25,04 | 0,2732 | -0,1003 | |||
| RAL / Ralliant Corporation | 0,07 | 3,46 | 0,2506 | 0,2506 | |||||
| ABT / Abbott Laboratories | 0,03 | -5,58 | 3,45 | -3,17 | 0,2505 | -0,0147 | |||
| BND / Vanguard Bond Index Funds - Vanguard Total Bond Market ETF | 0,05 | -1,07 | 3,40 | -0,85 | 0,2468 | -0,0082 | |||
| WAT / Waters Corporation | 0,01 | -12,67 | 3,10 | -17,30 | 0,2251 | -0,0538 | |||
| VGSH / Vanguard Scottsdale Funds - Vanguard Short-Term Treasury ETF | 0,05 | 3,68 | 3,09 | 3,84 | 0,2239 | 0,0029 | |||
| ABBV / AbbVie Inc. | 0,02 | -6,86 | 3,03 | -17,50 | 0,2196 | -0,0531 | |||
| USB / U.S. Bancorp | 0,06 | -21,51 | 2,70 | -15,88 | 0,1960 | -0,0428 | |||
| VUSB / Vanguard Bond Index Funds - Vanguard Ultra-Short Bond ETF | 0,05 | -0,96 | 2,69 | -0,92 | 0,1953 | -0,0067 | |||
| JNJ / Johnson & Johnson | 0,02 | -2,56 | 2,48 | -10,23 | 0,1795 | -0,0255 | |||
| ITW / Illinois Tool Works Inc. | 0,01 | -2,45 | 2,36 | -2,76 | 0,1715 | -0,0092 | |||
| SNA / Snap-on Incorporated | 0,01 | 0,00 | 2,23 | -7,65 | 0,1620 | -0,0178 | |||
| PG / The Procter & Gamble Company | 0,01 | -5,28 | 2,18 | -11,46 | 0,1581 | -0,0249 | |||
| WMT / Walmart Inc. | 0,02 | 0,07 | 2,12 | 11,46 | 0,1539 | 0,0124 | |||
| GNRC / Generac Holdings Inc. | 0,01 | -1,12 | 2,08 | 11,82 | 0,1510 | 0,0126 | |||
| RRX / Regal Rexnord Corporation | 0,01 | -70,23 | 1,99 | -62,09 | 0,1442 | -0,2456 | |||
| CBSH / Commerce Bancshares, Inc. | 0,03 | -8,48 | 1,88 | -8,58 | 0,1361 | -0,0164 | |||
| AMGN / Amgen Inc. | 0,01 | -0,93 | 1,78 | -11,23 | 0,1291 | -0,0199 | |||
| RSP / Invesco Exchange-Traded Fund Trust - Invesco S&P 500 Equal Weight ETF | 0,01 | -1,88 | 1,71 | 2,95 | 0,1240 | 0,0006 | |||
| WAB / Westinghouse Air Brake Technologies Corporation | 0,01 | -4,72 | 1,69 | 9,97 | 0,1224 | 0,0084 | |||
| MU / Micron Technology, Inc. | 0,01 | -17,08 | 1,56 | 17,62 | 0,1129 | 0,0145 | |||
| ZBRA / Zebra Technologies Corporation | 0,01 | -6,42 | 1,55 | 2,12 | 0,1121 | -0,0004 | |||
| VNT / Vontier Corporation | 0,04 | 3,30 | 1,49 | 16,07 | 0,1080 | 0,0126 | |||
| BRK.A / Berkshire Hathaway Inc. | 0,00 | 0,00 | 1,46 | -8,71 | 0,1057 | -0,0130 | |||
| TFX / Teleflex Incorporated | 0,01 | -25,31 | 1,35 | -36,07 | 0,0983 | -0,0592 | |||
| SPY / SPDR S&P 500 ETF | 0,00 | 0,00 | 1,31 | 10,54 | 0,0951 | 0,0069 | |||
| ETN / Eaton Corporation plc | 0,00 | 0,00 | 1,23 | 31,30 | 0,0889 | 0,0195 | |||
| RTX / RTX Corporation | 0,01 | -11,97 | 1,20 | -2,91 | 0,0870 | -0,0049 | |||
| ROST / Ross Stores, Inc. | 0,01 | 0,00 | 1,17 | -0,17 | 0,0851 | -0,0023 | |||
| WFC / Wells Fargo & Company | 0,01 | -18,69 | 1,15 | -9,25 | 0,0833 | -0,0108 | |||
| IBM / International Business Machines Corporation | 0,00 | 0,00 | 1,08 | 18,51 | 0,0785 | 0,0106 | |||
| BIV / Vanguard Bond Index Funds - Vanguard Intermediate-Term Bond ETF | 0,01 | -13,12 | 1,06 | -12,21 | 0,0772 | -0,0130 | |||
| HD / The Home Depot, Inc. | 0,00 | 0,00 | 1,05 | 0,00 | 0,0763 | -0,0019 | |||
| COF / Capital One Financial Corporation | 0,00 | 4,56 | 0,99 | 24,09 | 0,0718 | 0,0125 | |||
| V / Visa Inc. | 0,00 | -28,02 | 0,87 | -27,10 | 0,0629 | -0,0255 | |||
| VTI / Vanguard Index Funds - Vanguard Total Stock Market ETF | 0,00 | 0,00 | 0,84 | 10,58 | 0,0607 | 0,0044 | |||
| CAT / Caterpillar Inc. | 0,00 | 2,38 | 0,84 | 20,49 | 0,0606 | 0,0091 | |||
| AWK / American Water Works Company, Inc. | 0,01 | -3,28 | 0,82 | -8,79 | 0,0595 | -0,0074 | |||
| BRK.B / Berkshire Hathaway Inc. | 0,00 | -11,95 | 0,81 | -19,66 | 0,0584 | -0,0161 | |||
| FITB / Fifth Third Bancorp | 0,02 | 0,00 | 0,75 | 4,91 | 0,0543 | 0,0013 | |||
| MTB / M&T Bank Corporation | 0,00 | -33,21 | 0,73 | -27,54 | 0,0533 | -0,0221 | |||
| AMAT / Applied Materials, Inc. | 0,00 | 0,00 | 0,73 | 26,33 | 0,0533 | 0,0100 | |||
| ACIW / ACI Worldwide, Inc. | 0,02 | 0,00 | 0,72 | -16,00 | 0,0522 | -0,0115 | |||
| MCD / McDonald's Corporation | 0,00 | 0,00 | 0,70 | -6,52 | 0,0510 | -0,0049 | |||
| SIGI / Selective Insurance Group, Inc. | 0,01 | -10,51 | 0,70 | -15,31 | 0,0506 | -0,0106 | |||
| PEP / PepsiCo, Inc. | 0,01 | -5,54 | 0,68 | -16,87 | 0,0490 | -0,0114 | |||
| LLY / Eli Lilly and Company | 0,00 | 137,75 | 0,66 | 124,23 | 0,0477 | 0,0259 | |||
| RY / Royal Bank of Canada | 0,00 | -16,60 | 0,62 | -2,65 | 0,0453 | -0,0024 | |||
| HON / Honeywell International Inc. | 0,00 | -1,90 | 0,60 | 7,73 | 0,0435 | 0,0022 | |||
| VOO / Vanguard Index Funds - Vanguard S&P 500 ETF | 0,00 | -8,44 | 0,59 | 1,21 | 0,0424 | -0,0005 | |||
| GBCI / Glacier Bancorp, Inc. | 0,01 | 0,56 | 0,0408 | 0,0408 | |||||
| KO / The Coca-Cola Company | 0,01 | 0,00 | 0,56 | -1,07 | 0,0404 | -0,0015 | |||
| CNI / Canadian National Railway Company | 0,01 | 0,00 | 0,55 | 6,85 | 0,0396 | 0,0016 | |||
| NFLX / Netflix, Inc. | 0,00 | 0,00 | 0,54 | 43,43 | 0,0389 | 0,0111 | |||
| CHRW / C.H. Robinson Worldwide, Inc. | 0,01 | -21,43 | 0,53 | -26,40 | 0,0383 | -0,0150 | |||
| MSM / MSC Industrial Direct Co., Inc. | 0,01 | 0,00 | 0,53 | 9,56 | 0,0383 | 0,0024 | |||
| AXP / American Express Company | 0,00 | 0,00 | 0,52 | 18,55 | 0,0381 | 0,0052 | |||
| TSLA / Tesla, Inc. | 0,00 | 0,00 | 0,52 | 22,48 | 0,0380 | 0,0062 | |||
| BDX / Becton, Dickinson and Company | 0,00 | -23,49 | 0,52 | -42,51 | 0,0379 | -0,0296 | |||
| CARR / Carrier Global Corporation | 0,01 | 0,00 | 0,52 | 15,27 | 0,0379 | 0,0043 | |||
| DGX / Quest Diagnostics Incorporated | 0,00 | 0,00 | 0,52 | 6,12 | 0,0378 | 0,0013 | |||
| PNC / The PNC Financial Services Group, Inc. | 0,00 | 0,00 | 0,51 | 6,04 | 0,0370 | 0,0012 | |||
| TRV / The Travelers Companies, Inc. | 0,00 | 2,75 | 0,50 | 3,95 | 0,0363 | 0,0005 | |||
| NVDA / NVIDIA Corporation | 0,00 | 0,00 | 0,49 | 46,11 | 0,0354 | 0,0105 | |||
| QQQ / Invesco QQQ Trust, Series 1 | 0,00 | 0,00 | 0,48 | 17,65 | 0,0349 | 0,0045 | |||
| UNP / Union Pacific Corporation | 0,00 | -22,46 | 0,48 | -24,44 | 0,0346 | -0,0123 | |||
| EMR / Emerson Electric Co. | 0,00 | 0,00 | 0,44 | 21,61 | 0,0319 | 0,0050 | |||
| PAYX / Paychex, Inc. | 0,00 | 0,00 | 0,41 | -5,52 | 0,0298 | -0,0026 | |||
| AMZN / Amazon.com, Inc. | 0,00 | -4,19 | 0,38 | 10,59 | 0,0273 | 0,0020 | |||
| CSCO / Cisco Systems, Inc. | 0,01 | 0,00 | 0,37 | 12,39 | 0,0270 | 0,0024 | |||
| MA / Mastercard Incorporated | 0,00 | 0,00 | 0,35 | 2,61 | 0,0257 | 0,0000 | |||
| GE / General Electric Company | 0,00 | 17,82 | 0,35 | 51,98 | 0,0251 | 0,0081 | |||
| GOOGL / Alphabet Inc. | 0,00 | -40,62 | 0,33 | -32,39 | 0,0243 | -0,0125 | |||
| HSIC / Henry Schein, Inc. | 0,00 | 0,00 | 0,33 | 6,49 | 0,0238 | 0,0009 | |||
| CVX / Chevron Corporation | 0,00 | -11,61 | 0,33 | -24,25 | 0,0238 | -0,0084 | |||
| RSG / Republic Services, Inc. | 0,00 | 0,00 | 0,32 | 1,89 | 0,0234 | -0,0001 | |||
| WRB / W. R. Berkley Corporation | 0,00 | 0,00 | 0,31 | 3,31 | 0,0227 | 0,0002 | |||
| SYK / Stryker Corporation | 0,00 | 0,00 | 0,29 | 6,55 | 0,0213 | 0,0008 | |||
| MIDD / The Middleby Corporation | 0,00 | -37,44 | 0,29 | -40,86 | 0,0209 | -0,0153 | |||
| MRK / Merck & Co., Inc. | 0,00 | 0,00 | 0,29 | -11,66 | 0,0209 | -0,0034 | |||
| PRU / Prudential Financial, Inc. | 0,00 | 17,86 | 0,28 | 13,20 | 0,0206 | 0,0020 | |||
| BAC / Bank of America Corporation | 0,01 | -40,03 | 0,28 | -32,02 | 0,0201 | -0,0102 | |||
| COP / ConocoPhillips | 0,00 | 0,00 | 0,26 | -14,71 | 0,0190 | -0,0038 | |||
| OTIS / Otis Worldwide Corporation | 0,00 | -8,74 | 0,24 | -12,27 | 0,0176 | -0,0030 | |||
| TROW / T. Rowe Price Group, Inc. | 0,00 | 0,00 | 0,23 | 5,43 | 0,0169 | 0,0004 | |||
| TFC / Truist Financial Corporation | 0,01 | 0,00 | 0,23 | 4,55 | 0,0167 | 0,0003 | |||
| GEV / GE Vernova Inc. | 0,00 | 0,22 | 0,0160 | 0,0160 | |||||
| VZ / Verizon Communications Inc. | 0,01 | -6,85 | 0,22 | -11,02 | 0,0158 | -0,0024 | |||
| IWD / iShares Trust - iShares Russell 1000 Value ETF | 0,00 | 0,20 | 0,0148 | 0,0148 | |||||
| GOOG / Alphabet Inc. | 0,00 | -100,00 | 0,00 | 0,0000 | |||||
| FNF / Fidelity National Financial, Inc. | 0,00 | -100,00 | 0,00 | 0,0000 | |||||
| CRL / Charles River Laboratories International, Inc. | 0,00 | -100,00 | 0,00 | 0,0000 | |||||
| INTC / Intel Corporation | 0,00 | -100,00 | 0,00 | 0,0000 | |||||
| CSX / CSX Corporation | 0,00 | -100,00 | 0,00 | 0,0000 | |||||
| ZD / Ziff Davis, Inc. | 0,00 | -100,00 | 0,00 | 0,0000 |