Statistiques de base
| Valeur du portefeuille | $ 9 014 856 807 |
| Positions actuelles | 75 |
Dernières positions, performances, ASG (à partir des dépôts 13F, 13D)
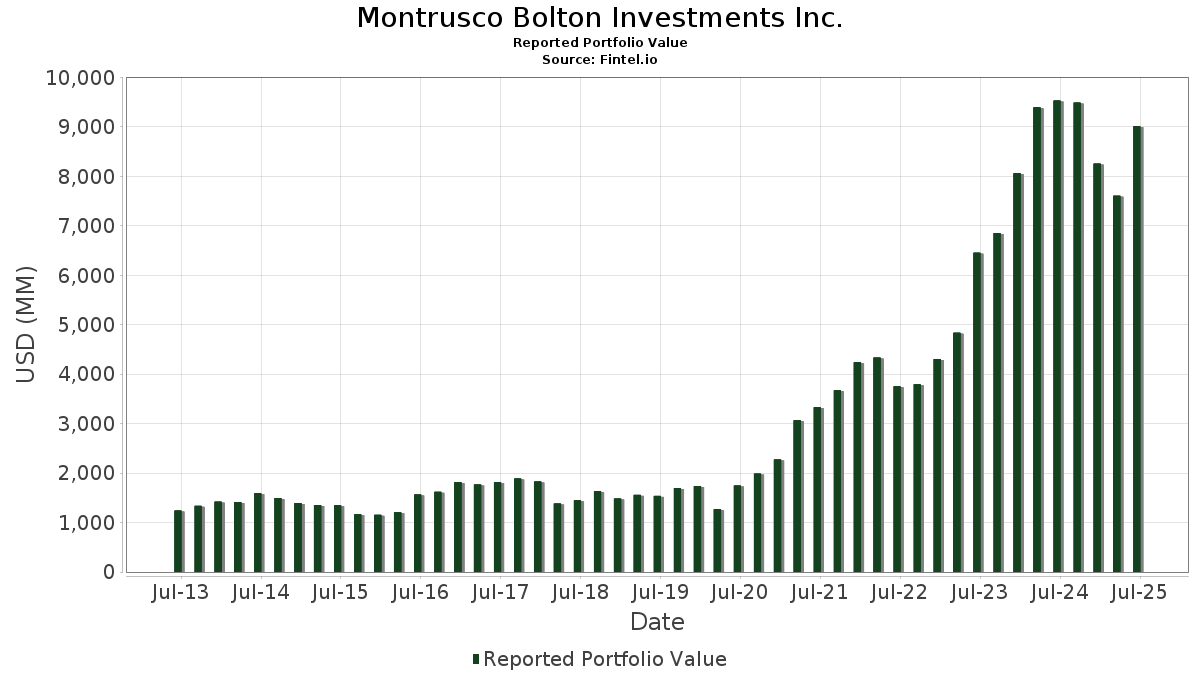
Montrusco Bolton Investments Inc. a déclaré un total de 75 positions dans ses derniers dépôts auprès de la SEC. La valeur la plus récente du portefeuille est calculée à 9 014 856 807 USD. Les actifs sous gestion réels (ASG) sont cette valeur plus les liquidités (qui ne sont pas divulguées). Les principales positions de Montrusco Bolton Investments Inc. sont Microsoft Corporation (US:MSFT) , Direxion Shares ETF Trust - Direxion Daily NVDA Bear 1X Shares (US:NVDD) , Amazon.com, Inc. (US:AMZN) , Meta Platforms, Inc. (US:META) , and JPMorgan Chase & Co. (US:JPM) . Les nouvelles positions de Montrusco Bolton Investments Inc. incluent Ryan Specialty Holdings, Inc. (US:RYAN) , Fortinet, Inc. (US:FTNT) , CBIZ, Inc. (US:CBZ) , BRP Inc. (US:DOOO) , and Pool Corporation (US:POOL) .
Meilleures augmentations ce trimestre
Nous utilisons la variation de l'allocation du portefeuille car il s'agit de l'indicateur le plus significatif. Les changements peuvent être dus à des transactions ou à des variations de prix des actions.
| Titre | Actions (en millions) |
Valeur ($ en millions) |
% du portefeuille | ΔPortefeuille % |
|---|---|---|---|---|
| 1,72 | 485,80 | 5,3889 | 5,3889 | |
| 3,21 | 213,85 | 2,3722 | 2,3722 | |
| 0,69 | 492,22 | 5,4601 | 1,7096 | |
| 1,02 | 108,06 | 1,1986 | 1,1986 | |
| 2,56 | 244,22 | 2,7091 | 1,1008 | |
| 0,43 | 224,15 | 2,4865 | 0,9091 | |
| 0,86 | 184,60 | 2,0477 | 0,8993 | |
| 2,67 | 573,57 | 6,3625 | 0,8077 | |
| 4,76 | 735,80 | 8,1621 | 0,7928 | |
| 2,31 | 419,45 | 4,6529 | 0,7595 |
Principales baisses ce trimestre
Nous utilisons la variation de l'allocation du portefeuille car il s'agit de l'indicateur le plus significatif. Les changements peuvent être dus à des transactions ou à des variations de prix des actions.
| Titre | Actions (en millions) |
Valeur ($ en millions) |
% du portefeuille | ΔPortefeuille % |
|---|---|---|---|---|
| 0,00 | 0,00 | -2,7698 | ||
| 0,37 | 205,45 | 2,2790 | -2,5948 | |
| 0,00 | 0,00 | -2,5606 | ||
| 0,00 | 0,00 | -2,1334 | ||
| 3,50 | 216,03 | 2,3964 | -1,5958 | |
| 5,11 | 279,93 | 3,1052 | -1,2505 | |
| 0,35 | 363,63 | 4,0336 | -0,8536 | |
| 0,90 | 184,26 | 2,0439 | -0,7059 | |
| 1,79 | 345,80 | 3,8359 | -0,6670 | |
| 1,72 | 837,14 | 9,2862 | -0,6097 |
Déclarations 13F et dépôts de fonds
Ce formulaire a été déposé le 2025-07-25 pour la période de déclaration 2025-06-30. Cliquez sur l'icône du lien pour voir l'historique complet des transactions.
Mettre à niveau pour débloquer les données premium et exporter vers Excel ![]() .
.
| Titre | Type | Prix moyen de l'action | Actions (en millions) |
ΔActions (%) |
ΔActions (%) |
Valeur ($ en millions) |
Portefeuille (%) |
ΔPortefeuille (%) |
|
|---|---|---|---|---|---|---|---|---|---|
| MSFT / Microsoft Corporation | 1,72 | -16,59 | 837,14 | 11,19 | 9,2862 | -0,6097 | |||
| NVDD / Direxion Shares ETF Trust - Direxion Daily NVDA Bear 1X Shares | 4,76 | -10,12 | 735,80 | 31,24 | 8,1621 | 0,7928 | |||
| AMZN / Amazon.com, Inc. | 2,67 | 16,99 | 573,57 | 35,72 | 6,3625 | 0,8077 | |||
| META / Meta Platforms, Inc. | 0,69 | 35,12 | 492,22 | 72,50 | 5,4601 | 1,7096 | |||
| JPM / JPMorgan Chase & Co. | 1,72 | 485,80 | 5,3889 | 5,3889 | |||||
| GOOGL / Alphabet Inc. | 2,61 | 3,07 | 450,52 | 18,76 | 4,9976 | 0,0113 | |||
| WCN / Waste Connections, Inc. | 2,31 | 46,55 | 419,45 | 41,61 | 4,6529 | 0,7595 | |||
| BLK / BlackRock, Inc. | 0,35 | -11,54 | 363,63 | -2,20 | 4,0336 | -0,8536 | |||
| DHR / Danaher Corporation | 1,79 | 4,23 | 345,80 | 0,94 | 3,8359 | -0,6670 | |||
| ROL / Rollins, Inc. | 5,11 | -19,64 | 279,93 | -15,53 | 3,1052 | -1,2505 | |||
| CMG / Chipotle Mexican Grill, Inc. | 5,12 | 5,51 | 279,34 | 18,58 | 3,0987 | 0,0022 | |||
| UBER / Uber Technologies, Inc. | 2,91 | -10,94 | 264,42 | 13,91 | 2,9332 | -0,1180 | |||
| LRCX / Lam Research Corporation | 2,56 | 48,38 | 244,22 | 99,60 | 2,7091 | 1,1008 | |||
| IDXX / IDEXX Laboratories, Inc. | 0,43 | 50,26 | 224,15 | 86,78 | 2,4865 | 0,9091 | |||
| VLO / Valero Energy Corporation | 1,66 | -3,07 | 223,68 | -1,35 | 2,4812 | -0,4990 | |||
| PSA / Public Storage | 0,77 | 7,66 | 220,26 | 6,31 | 2,4433 | -0,2801 | |||
| MNST / Monster Beverage Corporation | 3,50 | -34,74 | 216,03 | -28,87 | 2,3964 | -1,5958 | |||
| RYAN / Ryan Specialty Holdings, Inc. | 3,21 | 213,85 | 2,3722 | 2,3722 | |||||
| SNPS / Synopsys, Inc. | 0,42 | 39,98 | 209,34 | 67,84 | 2,3222 | 0,6827 | |||
| MA / Mastercard Incorporated | 0,37 | -46,01 | 205,45 | -44,59 | 2,2790 | -2,5948 | |||
| TSM / Taiwan Semiconductor Manufacturing Company Limited - Depositary Receipt (Common Stock) | 0,86 | 55,80 | 184,60 | 111,28 | 2,0477 | 0,8993 | |||
| AAPL / Apple Inc. | 0,90 | -4,64 | 184,26 | -11,92 | 2,0439 | -0,7059 | |||
| ADBE / Adobe Inc. | 0,42 | 27,19 | 160,32 | 29,46 | 1,7784 | 0,1507 | |||
| SHW / The Sherwin-Williams Company | 0,44 | -0,36 | 149,36 | -1,70 | 1,6569 | -0,3402 | |||
| FTNT / Fortinet, Inc. | 1,02 | 108,06 | 1,1986 | 1,1986 | |||||
| ZTS / Zoetis Inc. | 0,49 | -17,22 | 76,86 | -17,39 | 0,8526 | -0,3704 | |||
| SYY / Sysco Corporation | 0,83 | 12,06 | 63,08 | 13,10 | 0,6998 | -0,0334 | |||
| RY / Royal Bank of Canada | 0,42 | 26,19 | 55,82 | 47,36 | 0,6193 | 0,1213 | |||
| TSCO / Tractor Supply Company | 0,93 | 49,13 | 0,5450 | 0,5450 | |||||
| LLY / Eli Lilly and Company | 0,06 | 46,59 | 0,5168 | 0,5168 | |||||
| WMT / Walmart Inc. | 0,47 | 7,12 | 46,34 | 19,30 | 0,5141 | 0,0035 | |||
| TD / The Toronto-Dominion Bank | 0,53 | -7,39 | 39,17 | 13,46 | 0,4345 | -0,0193 | |||
| GIB / CGI Inc. | 0,36 | 418,35 | 37,38 | 444,30 | 0,4146 | 0,3244 | |||
| CNI / Canadian National Railway Company | 0,27 | 22,38 | 27,66 | 30,79 | 0,3068 | 0,0289 | |||
| SLF / Sun Life Financial Inc. | 0,37 | 4,61 | 24,46 | 21,39 | 0,2713 | 0,0065 | |||
| SU / Suncor Energy Inc. | 0,62 | 2,11 | 23,07 | -1,40 | 0,2559 | -0,0516 | |||
| ENB / Enbridge Inc. | 0,49 | -35,75 | 22,33 | -34,29 | 0,2477 | -0,1990 | |||
| GDXD / MicroSectors Gold Miners -3X Inverse Leveraged ETNs due June 29, 2040 | 0,19 | -19,98 | 21,44 | -7,32 | 0,2379 | -0,0662 | |||
| AEM / Agnico Eagle Mines Limited | 0,17 | 20,46 | 0,2270 | 0,2270 | |||||
| TFII / TFI International Inc. | 0,23 | 415,68 | 20,25 | 496,79 | 0,2246 | 0,1800 | |||
| RBA / RB Global, Inc. | 0,19 | 19,72 | 0,2187 | 0,2187 | |||||
| CIGI / Colliers International Group Inc. | 0,14 | 40,89 | 18,08 | 52,03 | 0,2006 | 0,0442 | |||
| BIP / Brookfield Infrastructure Partners L.P. - Limited Partnership | 0,53 | -10,12 | 17,74 | 1,02 | 0,1968 | -0,0340 | |||
| FSV / FirstService Corporation | 0,10 | 8,32 | 17,64 | 13,78 | 0,1957 | -0,0081 | |||
| BAM / Brookfield Asset Management Ltd. | 0,31 | -25,76 | 17,31 | -15,28 | 0,1920 | -0,0766 | |||
| CBZ / CBIZ, Inc. | 0,23 | 16,74 | 0,1857 | 0,1857 | |||||
| CAE / CAE Inc. | 0,56 | 16,39 | 0,1819 | 0,1819 | |||||
| NGD / New Gold Inc. | 3,20 | -27,15 | 15,89 | -2,22 | 0,1762 | -0,0373 | |||
| TU / TELUS Corporation | 0,89 | -24,30 | 14,19 | -15,40 | 0,1574 | -0,0631 | |||
| ERO / Ero Copper Corp. | 0,77 | -1,89 | 12,93 | 36,55 | 0,1434 | 0,0190 | |||
| GRPU / Granite Real Estate Investment Trust | 0,25 | -4,33 | 12,91 | 4,12 | 0,1432 | -0,0198 | |||
| SAND / Sandstorm Gold Ltd. | 1,30 | 12,17 | 0,1350 | 0,1350 | |||||
| PBA / Pembina Pipeline Corporation | 0,32 | -20,26 | 12,12 | -25,29 | 0,1344 | -0,0788 | |||
| DSGX / The Descartes Systems Group Inc. | 0,12 | 176,45 | 11,92 | 178,49 | 0,1322 | 0,0760 | |||
| GIL / Gildan Activewear Inc. | 0,24 | 11,80 | 0,1309 | 0,1309 | |||||
| DOOO / BRP Inc. | 0,23 | 11,14 | 0,1236 | 0,1236 | |||||
| POOL / Pool Corporation | 0,04 | 10,86 | 0,1204 | 0,1204 | |||||
| AGI / Alamos Gold Inc. | 0,40 | 10,66 | 0,1183 | 0,1183 | |||||
| OR / OR Royalties Inc. | 0,40 | 10,32 | 0,1144 | 0,1144 | |||||
| ATS / ATS Corporation | 0,32 | 10,15 | 0,1126 | 0,1126 | |||||
| WPM / Wheaton Precious Metals Corp. | 0,11 | -60,49 | 10,14 | -54,30 | 0,1124 | -0,1791 | |||
| CNM / Core & Main, Inc. | 0,16 | 9,85 | 0,1093 | 0,1093 | |||||
| NFLX / Netflix, Inc. | 0,01 | 7,35 | 9,62 | 54,15 | 0,1067 | 0,0247 | |||
| UFPT / UFP Technologies, Inc. | 0,04 | 9,49 | 0,1052 | 0,1052 | |||||
| FNV / Franco-Nevada Corporation | 0,05 | -63,58 | 8,99 | -62,05 | 0,0997 | -0,2116 | |||
| BNT / Brookfield Wealth Solutions Ltd. | 0,13 | -20,15 | 8,31 | -5,71 | 0,0922 | -0,0237 | |||
| APG / APi Group Corporation | 0,14 | 7,19 | 0,0798 | 0,0798 | |||||
| TRI / Thomson Reuters Corporation | 0,03 | -4,56 | 6,29 | 11,02 | 0,0697 | -0,0047 | |||
| SHOP / Shopify Inc. | 0,05 | 18,55 | 5,22 | 43,48 | 0,0580 | 0,0101 | |||
| EGO / Eldorado Gold Corporation | 0,25 | -42,34 | 5,14 | -30,32 | 0,0570 | -0,0399 | |||
| BKFOF / Brookfield Corporation - Preferred Stock | 0,06 | -22,05 | 3,48 | -7,97 | 0,0386 | -0,0111 | |||
| PG / The Procter & Gamble Company | 0,01 | -3,86 | 2,35 | -10,11 | 0,0260 | -0,0083 | |||
| CP / Canadian Pacific Kansas City Limited | 0,03 | 6,02 | 2,18 | 19,79 | 0,0242 | 0,0003 | |||
| 0A8V / Lightspeed Commerce Inc. | 0,04 | 0,46 | 0,0051 | 0,0051 | |||||
| WINA / Winmark Corporation | 0,00 | 0,23 | 0,0025 | 0,0025 | |||||
| AMGN / Amgen Inc. | 0,00 | -100,00 | 0,00 | -100,00 | -2,7698 | ||||
| TXN / Texas Instruments Incorporated | 0,00 | -100,00 | 0,00 | -100,00 | -2,1334 | ||||
| CFR / Cullen/Frost Bankers, Inc. | 0,00 | -100,00 | 0,00 | 0,0000 | |||||
| BBU / Brookfield Business Partners L.P. - Limited Partnership | 0,00 | -100,00 | 0,00 | -100,00 | -0,0095 | ||||
| OR / OR Royalties Inc. | 0,00 | -100,00 | 0,00 | 0,0000 | |||||
| GRMN / Garmin Ltd. | 0,00 | -100,00 | 0,00 | 0,0000 | |||||
| TFPM / Triple Flag Precious Metals Corp. | 0,00 | -100,00 | 0,00 | 0,0000 | |||||
| MMC / Marsh & McLennan Companies, Inc. | 0,00 | -100,00 | 0,00 | -100,00 | -2,5606 |