Statistiques de base
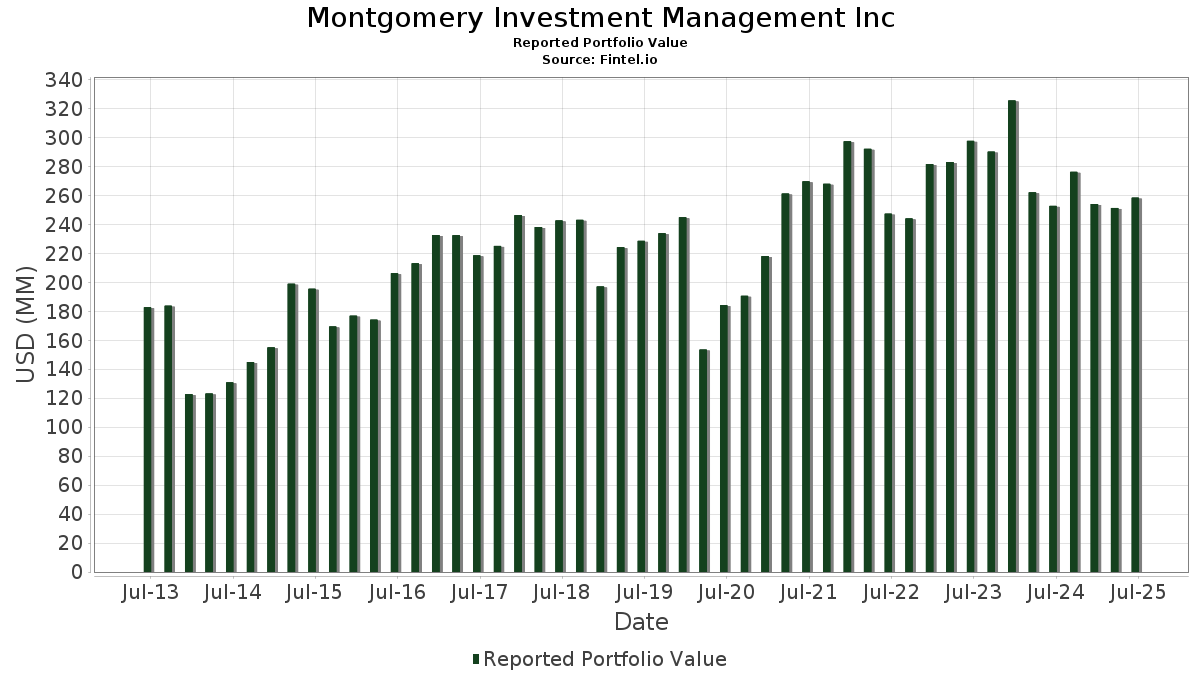
| Valeur du portefeuille | $ 258 390 795 |
| Positions actuelles | 95 |
Dernières positions, performances, ASG (à partir des dépôts 13F, 13D)
Montgomery Investment Management Inc a déclaré un total de 95 positions dans ses derniers dépôts auprès de la SEC. La valeur la plus récente du portefeuille est calculée à 258 390 795 USD. Les actifs sous gestion réels (ASG) sont cette valeur plus les liquidités (qui ne sont pas divulguées). Les principales positions de Montgomery Investment Management Inc sont United Rentals, Inc. (US:URI) , VSE Corporation (US:VSEC) , Truist Financial Corporation (US:TFC) , Deere & Company (US:DE) , and International Business Machines Corporation (US:IBM) . Les nouvelles positions de Montgomery Investment Management Inc incluent PulteGroup, Inc. (US:PHM) , GE Vernova Inc. (US:GEV) , .
Meilleures augmentations ce trimestre
Nous utilisons la variation de l'allocation du portefeuille car il s'agit de l'indicateur le plus significatif. Les changements peuvent être dus à des transactions ou à des variations de prix des actions.
| Titre | Actions (en millions) |
Valeur ($ en millions) |
% du portefeuille | ΔPortefeuille % |
|---|---|---|---|---|
| 0,09 | 8,81 | 3,4097 | 1,5662 | |
| 0,03 | 25,61 | 9,9112 | 1,1847 | |
| 0,04 | 11,05 | 4,2772 | 0,5279 | |
| 0,01 | 5,16 | 1,9977 | 0,3801 | |
| 0,15 | 19,42 | 7,5174 | 0,3474 | |
| 0,01 | 5,95 | 2,3014 | 0,3214 | |
| 0,01 | 5,58 | 2,1593 | 0,2732 | |
| 0,02 | 1,60 | 0,6184 | 0,2658 | |
| 0,01 | 0,63 | 0,2449 | 0,2449 | |
| 0,05 | 4,63 | 1,7924 | 0,2238 |
Principales baisses ce trimestre
Nous utilisons la variation de l'allocation du portefeuille car il s'agit de l'indicateur le plus significatif. Les changements peuvent être dus à des transactions ou à des variations de prix des actions.
| Titre | Actions (en millions) |
Valeur ($ en millions) |
% du portefeuille | ΔPortefeuille % |
|---|---|---|---|---|
| 0,09 | 8,38 | 3,2415 | -0,7424 | |
| 0,04 | 6,18 | 2,3932 | -0,6812 | |
| 0,05 | 10,25 | 3,9680 | -0,6228 | |
| 0,04 | 6,07 | 2,3500 | -0,6206 | |
| 0,03 | 1,76 | 0,6821 | -0,5230 | |
| 0,11 | 5,70 | 2,2065 | -0,4212 | |
| 0,06 | 6,01 | 2,3245 | -0,3519 | |
| 0,04 | 3,51 | 1,3579 | -0,2788 | |
| 0,00 | 10,78 | 4,1703 | -0,2662 | |
| 0,07 | 7,48 | 2,8943 | -0,2326 |
Déclarations 13F et dépôts de fonds
Ce formulaire a été déposé le 2025-07-18 pour la période de déclaration 2025-06-30. Cliquez sur l'icône du lien pour voir l'historique complet des transactions.
Mettre à niveau pour débloquer les données premium et exporter vers Excel ![]() .
.
| Titre | Type | Prix moyen de l'action | Actions (en millions) |
ΔActions (%) |
ΔActions (%) |
Valeur ($ en millions) |
Portefeuille (%) |
ΔPortefeuille (%) |
|
|---|---|---|---|---|---|---|---|---|---|
| URI / United Rentals, Inc. | 0,03 | -2,86 | 25,61 | 16,78 | 9,9112 | 1,1847 | |||
| VSEC / VSE Corporation | 0,15 | -1,24 | 19,42 | 7,80 | 7,5174 | 0,3474 | |||
| TFC / Truist Financial Corporation | 0,32 | -3,72 | 13,75 | 0,59 | 5,3197 | -0,1181 | |||
| DE / Deere & Company | 0,03 | -5,25 | 13,03 | 2,65 | 5,0438 | -0,0083 | |||
| IBM / International Business Machines Corporation | 0,04 | -1,06 | 11,05 | 17,29 | 4,2772 | 0,5279 | |||
| NVR / NVR, Inc. | 0,00 | -5,20 | 10,78 | -3,35 | 4,1703 | -0,2662 | |||
| AAPL / Apple Inc. | 0,05 | -3,78 | 10,25 | -11,13 | 3,9680 | -0,6228 | |||
| SGOV / iShares Trust - iShares 0-3 Month Treasury Bond ETF | 0,09 | 90,13 | 8,81 | 90,20 | 3,4097 | 1,5662 | |||
| COP / ConocoPhillips | 0,09 | -2,10 | 8,38 | -16,34 | 3,2415 | -0,7424 | |||
| LEN / Lennar Corporation | 0,07 | -1,24 | 7,48 | -4,84 | 2,8943 | -0,2326 | |||
| CVX / Chevron Corporation | 0,04 | -6,49 | 6,18 | -19,96 | 2,3932 | -0,6812 | |||
| FANG / Diamondback Energy, Inc. | 0,04 | -5,35 | 6,07 | -18,66 | 2,3500 | -0,6206 | |||
| LENB / Lennar Corp. - Class B | 0,06 | -7,46 | 6,01 | -10,70 | 2,3245 | -0,3519 | |||
| MSFT / Microsoft Corporation | 0,01 | -9,81 | 5,95 | 19,52 | 2,3014 | 0,3214 | |||
| BAC / Bank of America Corporation | 0,12 | -7,21 | 5,79 | 5,22 | 2,2392 | 0,0511 | |||
| GIS / General Mills, Inc. | 0,11 | -0,36 | 5,70 | -13,66 | 2,2065 | -0,4212 | |||
| CAT / Caterpillar Inc. | 0,01 | 0,00 | 5,58 | 17,70 | 2,1593 | 0,2732 | |||
| NOW / ServiceNow, Inc. | 0,01 | -1,66 | 5,16 | 26,96 | 1,9977 | 0,3801 | |||
| FCX / Freeport-McMoRan Inc. | 0,11 | -5,85 | 4,89 | 7,81 | 1,8913 | 0,0875 | |||
| PSX / Phillips 66 | 0,04 | -3,70 | 4,65 | -6,96 | 1,8005 | -0,1893 | |||
| CF / CF Industries Holdings, Inc. | 0,05 | -0,20 | 4,63 | 17,51 | 1,7924 | 0,2238 | |||
| VLO / Valero Energy Corporation | 0,03 | -1,00 | 3,98 | 0,76 | 1,5393 | -0,0315 | |||
| MRK / Merck & Co., Inc. | 0,04 | -3,27 | 3,51 | -14,71 | 1,3579 | -0,2788 | |||
| IVV / iShares Trust - iShares Core S&P 500 ETF | 0,01 | 11,08 | 3,18 | 22,73 | 1,2308 | 0,1997 | |||
| JNJ / Johnson & Johnson | 0,02 | -2,66 | 2,78 | -10,37 | 1,0777 | -0,1582 | |||
| PNC / The PNC Financial Services Group, Inc. | 0,01 | 0,00 | 2,68 | 6,10 | 1,0368 | 0,0317 | |||
| SNV / Synovus Financial Corp. | 0,05 | -9,62 | 2,43 | 0,04 | 0,9412 | -0,0258 | |||
| ABBV / AbbVie Inc. | 0,01 | 0,00 | 2,42 | -11,42 | 0,9371 | -0,1505 | |||
| BRK.A / Berkshire Hathaway Inc. | 0,00 | 0,00 | 2,19 | -8,73 | 0,8462 | -0,1070 | |||
| SU / Suncor Energy Inc. | 0,06 | -1,40 | 2,11 | -4,62 | 0,8160 | -0,0638 | |||
| ABT / Abbott Laboratories | 0,01 | -9,22 | 2,01 | -6,90 | 0,7777 | -0,0814 | |||
| NEE / NextEra Energy, Inc. | 0,03 | -5,74 | 1,82 | -7,70 | 0,7055 | -0,0804 | |||
| MCD / McDonald's Corporation | 0,01 | 0,00 | 1,80 | -6,45 | 0,6963 | -0,0691 | |||
| RTX / RTX Corporation | 0,01 | 0,00 | 1,80 | 10,25 | 0,6951 | 0,0468 | |||
| LGIH / LGI Homes, Inc. | 0,03 | -24,91 | 1,76 | -41,81 | 0,6821 | -0,5230 | |||
| CCJ / Cameco Corporation | 0,02 | 0,00 | 1,60 | 80,45 | 0,6184 | 0,2658 | |||
| HPQ / HP Inc. | 0,06 | 0,00 | 1,51 | -11,63 | 0,5852 | -0,0960 | |||
| MRP / Millrose Properties, Inc. | 0,05 | -20,22 | 1,35 | -14,20 | 0,5241 | -0,1040 | |||
| COST / Costco Wholesale Corporation | 0,00 | 0,00 | 1,28 | 4,67 | 0,4942 | 0,0087 | |||
| LH / Labcorp Holdings Inc. | 0,00 | -12,70 | 1,26 | -1,56 | 0,4887 | -0,0216 | |||
| WMT / Walmart Inc. | 0,01 | 0,00 | 1,12 | 11,39 | 0,4319 | 0,0332 | |||
| KNF / Knife River Corporation | 0,01 | -5,70 | 1,01 | -14,67 | 0,3919 | -0,0803 | |||
| LOW / Lowe's Companies, Inc. | 0,00 | 0,00 | 0,94 | -4,86 | 0,3641 | -0,0294 | |||
| NVDA / NVIDIA Corporation | 0,01 | 15,62 | 0,94 | 68,77 | 0,3620 | 0,1412 | |||
| BHP / BHP Group Limited - Depositary Receipt (Common Stock) | 0,02 | 0,00 | 0,86 | -0,92 | 0,3341 | -0,0126 | |||
| IWM / iShares Trust - iShares Russell 2000 ETF | 0,00 | 0,00 | 0,86 | 8,28 | 0,3341 | 0,0165 | |||
| ODFL / Old Dominion Freight Line, Inc. | 0,00 | 0,00 | 0,81 | -1,82 | 0,3128 | -0,0151 | |||
| CVE / Cenovus Energy Inc. | 0,06 | 0,00 | 0,77 | -2,29 | 0,2976 | -0,0154 | |||
| DGX / Quest Diagnostics Incorporated | 0,00 | 0,00 | 0,76 | 6,15 | 0,2941 | 0,0093 | |||
| GL / Globe Life Inc. | 0,01 | 0,00 | 0,75 | -5,65 | 0,2910 | -0,0261 | |||
| MDU / MDU Resources Group, Inc. | 0,04 | 0,00 | 0,73 | -1,36 | 0,2811 | -0,0121 | |||
| WY / Weyerhaeuser Company | 0,03 | -0,16 | 0,72 | -12,38 | 0,2769 | -0,0481 | |||
| DAL / Delta Air Lines, Inc. | 0,01 | -0,69 | 0,71 | 12,03 | 0,2744 | 0,0225 | |||
| EQT / EQT Corporation | 0,01 | 0,00 | 0,70 | 9,05 | 0,2708 | 0,0157 | |||
| HON / Honeywell International Inc. | 0,00 | 0,00 | 0,68 | 9,93 | 0,2614 | 0,0170 | |||
| ECG / Everus Construction Group, Inc. | 0,01 | 0,00 | 0,67 | 71,28 | 0,2586 | 0,1034 | |||
| DRI / Darden Restaurants, Inc. | 0,00 | 0,00 | 0,65 | 4,82 | 0,2531 | 0,0051 | |||
| PHM / PulteGroup, Inc. | 0,01 | 0,63 | 0,2449 | 0,2449 | |||||
| ANET / Arista Networks Inc | 0,01 | 0,00 | 0,57 | 32,10 | 0,2217 | 0,0491 | |||
| AMZN / Amazon.com, Inc. | 0,00 | 0,00 | 0,57 | 15,38 | 0,2208 | 0,0239 | |||
| GE / General Electric Company | 0,00 | 0,00 | 0,57 | 28,73 | 0,2203 | 0,0442 | |||
| BKR / Baker Hughes Company | 0,01 | 0,00 | 0,54 | -12,76 | 0,2092 | -0,0374 | |||
| MELI / MercadoLibre, Inc. | 0,00 | 0,00 | 0,52 | 33,85 | 0,2023 | 0,0470 | |||
| LLY / Eli Lilly and Company | 0,00 | 0,00 | 0,51 | -5,60 | 0,1961 | -0,0175 | |||
| HPE / Hewlett Packard Enterprise Company | 0,02 | 0,00 | 0,50 | 32,35 | 0,1919 | 0,0430 | |||
| A / Agilent Technologies, Inc. | 0,00 | 0,00 | 0,49 | 0,82 | 0,1895 | -0,0036 | |||
| SYY / Sysco Corporation | 0,01 | 0,00 | 0,47 | 0,85 | 0,1832 | -0,0034 | |||
| RYN / Rayonier Inc. | 0,02 | 0,08 | 0,46 | -20,45 | 0,1763 | -0,0514 | |||
| PFE / Pfizer Inc. | 0,02 | -4,32 | 0,43 | -8,33 | 0,1661 | -0,0205 | |||
| FDX / FedEx Corporation | 0,00 | 0,00 | 0,40 | -6,79 | 0,1544 | -0,0159 | |||
| ENB / Enbridge Inc. | 0,01 | 0,00 | 0,39 | 2,34 | 0,1527 | -0,0008 | |||
| WCC / WESCO International, Inc. | 0,00 | -4,53 | 0,39 | 14,04 | 0,1510 | 0,0146 | |||
| AVGO / Broadcom Inc. | 0,00 | 0,22 | 0,38 | 64,94 | 0,1475 | 0,0556 | |||
| AXP / American Express Company | 0,00 | 0,00 | 0,37 | 18,35 | 0,1451 | 0,0193 | |||
| PR / Permian Resources Corporation | 0,03 | 0,00 | 0,37 | -1,61 | 0,1423 | -0,0065 | |||
| CRWD / CrowdStrike Holdings, Inc. | 0,00 | -35,91 | 0,37 | -7,32 | 0,1421 | -0,0157 | |||
| SHOP / Shopify Inc. | 0,00 | 0,00 | 0,35 | 20,98 | 0,1339 | 0,0199 | |||
| SLB / Schlumberger Limited | 0,01 | 0,00 | 0,34 | -19,28 | 0,1300 | -0,0353 | |||
| EXE / Expand Energy Corporation | 0,00 | 0,00 | 0,32 | 4,92 | 0,1240 | 0,0026 | |||
| BRK.B / Berkshire Hathaway Inc. | 0,00 | 0,00 | 0,31 | -8,90 | 0,1192 | -0,0152 | |||
| VWO / Vanguard International Equity Index Funds - Vanguard FTSE Emerging Markets ETF | 0,01 | 0,00 | 0,31 | 9,29 | 0,1187 | 0,0070 | |||
| PM / Philip Morris International Inc. | 0,00 | 0,00 | 0,31 | 14,66 | 0,1184 | 0,0123 | |||
| KEYS / Keysight Technologies, Inc. | 0,00 | 0,00 | 0,30 | 9,39 | 0,1173 | 0,0071 | |||
| GEV / GE Vernova Inc. | 0,00 | 0,29 | 0,1124 | 0,1124 | |||||
| DELL / Dell Technologies Inc. | 0,00 | 0,00 | 0,29 | 34,88 | 0,1124 | 0,0265 | |||
| TTD / The Trade Desk, Inc. | 0,00 | 0,00 | 0,29 | 31,65 | 0,1114 | 0,0243 | |||
| OVV / Ovintiv Inc. | 0,01 | 0,00 | 0,27 | -10,93 | 0,1042 | -0,0163 | |||
| BTE / Baytex Energy Corp. | 0,15 | 0,00 | 0,27 | -19,82 | 0,1036 | -0,0291 | |||
| AR / Antero Resources Corporation | 0,01 | 0,00 | 0,24 | -0,42 | 0,0920 | -0,0030 | |||
| HAL / Halliburton Company | 0,01 | 0,00 | 0,23 | -19,72 | 0,0883 | -0,0247 | |||
| CRGY / Crescent Energy Company | 0,02 | 0,00 | 0,21 | -23,66 | 0,0827 | -0,0284 | |||
| GOOG / Alphabet Inc. | 0,00 | 0,21 | 0,0825 | 0,0825 | |||||
| CMCSA / Comcast Corporation | 0,01 | 0,00 | 0,21 | -3,23 | 0,0815 | -0,0051 | |||
| RF / Regions Financial Corporation | 0,01 | 0,21 | 0,0808 | 0,0808 | |||||
| UNP / Union Pacific Corporation | 0,00 | -35,71 | 0,21 | -37,27 | 0,0801 | -0,0515 | |||
| FRT / Federal Realty Investment Trust | 0,00 | -100,00 | 0,00 | 0,0000 | |||||
| MVF / BlackRock MuniVest Fund, Inc. | 0,00 | -100,00 | 0,00 | 0,0000 |