Statistiques de base
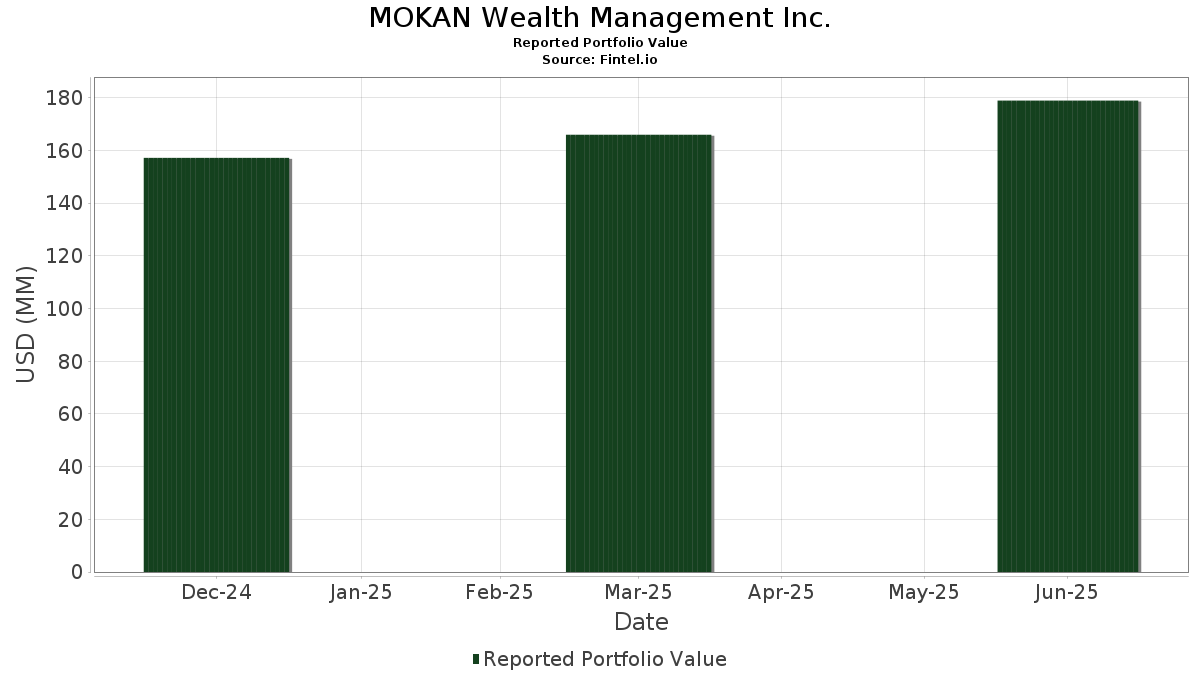
| Valeur du portefeuille | $ 178 926 588 |
| Positions actuelles | 82 |
Dernières positions, performances, ASG (à partir des dépôts 13F, 13D)
MOKAN Wealth Management Inc. a déclaré un total de 82 positions dans ses derniers dépôts auprès de la SEC. La valeur la plus récente du portefeuille est calculée à 178 926 588 USD. Les actifs sous gestion réels (ASG) sont cette valeur plus les liquidités (qui ne sont pas divulguées). Les principales positions de MOKAN Wealth Management Inc. sont Vanguard Scottsdale Funds - Vanguard Short-Term Treasury ETF (US:VGSH) , SPDR Series Trust - SPDR Bloomberg 1-3 Month T-Bill ETF (US:BIL) , SPDR Series Trust - SPDR Bloomberg 3-12 Month T-Bill ETF (US:BILS) , Broadcom Inc. (US:AVGO) , and Vanguard World Fund - Vanguard Information Technology ETF (US:VGT) . Les nouvelles positions de MOKAN Wealth Management Inc. incluent Allegion plc (US:ALLE) , PulteGroup, Inc. (MX:PHM) , PPG Industries, Inc. (US:PPG) , Avery Dennison Corporation (US:AVY) , and Conagra Brands, Inc. (US:CAG) .
Meilleures augmentations ce trimestre
Nous utilisons la variation de l'allocation du portefeuille car il s'agit de l'indicateur le plus significatif. Les changements peuvent être dus à des transactions ou à des variations de prix des actions.
| Titre | Actions (en millions) |
Valeur ($ en millions) |
% du portefeuille | ΔPortefeuille % |
|---|---|---|---|---|
| 0,03 | 7,71 | 4,3065 | 1,1278 | |
| 0,01 | 1,38 | 0,7731 | 0,7731 | |
| 0,01 | 1,37 | 0,7669 | 0,7669 | |
| 0,01 | 1,37 | 0,7634 | 0,7634 | |
| 0,01 | 1,31 | 0,7334 | 0,7334 | |
| 0,00 | 1,26 | 0,7058 | 0,7058 | |
| 0,02 | 3,29 | 1,8393 | 0,4717 | |
| 0,03 | 0,60 | 0,3350 | 0,3350 | |
| 0,06 | 4,70 | 2,6277 | 0,2035 | |
| 0,04 | 4,23 | 2,3668 | 0,1632 |
Principales baisses ce trimestre
Nous utilisons la variation de l'allocation du portefeuille car il s'agit de l'indicateur le plus significatif. Les changements peuvent être dus à des transactions ou à des variations de prix des actions.
| Titre | Actions (en millions) |
Valeur ($ en millions) |
% du portefeuille | ΔPortefeuille % |
|---|---|---|---|---|
| 0,05 | 4,09 | 2,2880 | -1,0374 | |
| 0,00 | 0,72 | 0,4009 | -0,7618 | |
| 0,01 | 4,03 | 2,2512 | -0,6667 | |
| 0,01 | 6,59 | 3,6824 | -0,6560 | |
| 0,01 | 0,75 | 0,4202 | -0,6074 | |
| 0,03 | 5,79 | 3,2352 | -0,4479 | |
| 0,01 | 6,81 | 3,8043 | -0,3585 | |
| 0,00 | 0,26 | 0,1427 | -0,2814 | |
| 0,02 | 3,16 | 1,7684 | -0,2301 | |
| 0,02 | 4,68 | 2,6129 | -0,2098 |
Déclarations 13F et dépôts de fonds
Ce formulaire a été déposé le 2025-07-25 pour la période de déclaration 2025-06-30. Cliquez sur l'icône du lien pour voir l'historique complet des transactions.
Mettre à niveau pour débloquer les données premium et exporter vers Excel ![]() .
.
| Titre | Type | Prix moyen de l'action | Actions (en millions) |
ΔActions (%) |
ΔActions (%) |
Valeur ($ en millions) |
Portefeuille (%) |
ΔPortefeuille (%) |
|
|---|---|---|---|---|---|---|---|---|---|
| VGSH / Vanguard Scottsdale Funds - Vanguard Short-Term Treasury ETF | 0,21 | 8,25 | 12,37 | 8,42 | 6,9146 | 0,0387 | |||
| BIL / SPDR Series Trust - SPDR Bloomberg 1-3 Month T-Bill ETF | 0,13 | 8,64 | 12,24 | 8,65 | 6,8420 | 0,0525 | |||
| BILS / SPDR Series Trust - SPDR Bloomberg 3-12 Month T-Bill ETF | 0,11 | 7,51 | 11,04 | 7,45 | 6,1724 | -0,0209 | |||
| AVGO / Broadcom Inc. | 0,03 | -11,32 | 7,71 | 46,07 | 4,3065 | 1,1278 | |||
| VGT / Vanguard World Fund - Vanguard Information Technology ETF | 0,01 | -19,44 | 6,81 | -1,48 | 3,8043 | -0,3585 | |||
| BRK.B / Berkshire Hathaway Inc. | 0,01 | 0,29 | 6,59 | -8,49 | 3,6824 | -0,6560 | |||
| MSFT / Microsoft Corporation | 0,01 | -19,47 | 6,01 | 6,64 | 3,3572 | -0,0367 | |||
| AAPL / Apple Inc. | 0,03 | 2,54 | 5,79 | -5,30 | 3,2352 | -0,4479 | |||
| MRK / Merck & Co., Inc. | 0,06 | 32,50 | 4,70 | 16,85 | 2,6277 | 0,2035 | |||
| AMZN / Amazon.com, Inc. | 0,02 | -13,40 | 4,68 | -0,19 | 2,6129 | -0,2098 | |||
| WMT / Walmart Inc. | 0,04 | 3,97 | 4,23 | 15,78 | 2,3668 | 0,1632 | |||
| COP / ConocoPhillips | 0,05 | -13,19 | 4,09 | -25,82 | 2,2880 | -1,0374 | |||
| VUG / Vanguard Index Funds - Vanguard Growth ETF | 0,01 | -29,64 | 4,03 | -16,83 | 2,2512 | -0,6667 | |||
| SCHD / Schwab Strategic Trust - Schwab U.S. Dividend Equity ETF | 0,15 | 4,86 | 4,00 | -0,62 | 2,2330 | -0,1893 | |||
| MCD / McDonald's Corporation | 0,01 | 8,70 | 3,47 | 1,64 | 1,9408 | -0,1177 | |||
| ABBV / AbbVie Inc. | 0,02 | 21,49 | 3,40 | 7,64 | 1,8981 | -0,0031 | |||
| NVDA / NVIDIA Corporation | 0,02 | -0,54 | 3,29 | 45,04 | 1,8393 | 0,4717 | |||
| GOOG / Alphabet Inc. | 0,02 | -15,94 | 3,16 | -4,58 | 1,7684 | -0,2301 | |||
| ABT / Abbott Laboratories | 0,02 | 11,94 | 2,99 | 14,77 | 1,6726 | 0,1012 | |||
| COST / Costco Wholesale Corporation | 0,00 | 9,10 | 2,85 | 13,89 | 1,5902 | 0,0847 | |||
| UNH / UnitedHealth Group Incorporated | 0,01 | 63,87 | 2,74 | -2,32 | 1,5319 | -0,1593 | |||
| GJR / Strats Trust For Procter & Gambel Security - Preferred Security | 0,02 | 13,70 | 2,44 | 6,36 | 1,3648 | -0,0191 | |||
| HD / The Home Depot, Inc. | 0,01 | 13,22 | 2,35 | 13,11 | 1,3121 | 0,0615 | |||
| JNJ / Johnson & Johnson | 0,01 | 18,96 | 2,16 | 9,61 | 1,2051 | 0,0197 | |||
| EOG / EOG Resources, Inc. | 0,02 | 20,45 | 2,15 | 12,31 | 1,2034 | 0,0483 | |||
| GILD / Gilead Sciences, Inc. | 0,02 | 18,87 | 2,15 | 17,60 | 1,1993 | 0,1002 | |||
| CBOE / Cboe Global Markets, Inc. | 0,01 | 4,74 | 2,13 | 7,84 | 1,1917 | -0,0000 | |||
| HSY / The Hershey Company | 0,01 | 20,05 | 2,11 | 16,48 | 1,1809 | 0,0876 | |||
| PEP / PepsiCo, Inc. | 0,02 | 30,36 | 2,09 | 14,84 | 1,1677 | 0,0714 | |||
| VTV / Vanguard Index Funds - Vanguard Value ETF | 0,01 | 10,84 | 2,04 | 13,37 | 1,1422 | 0,0560 | |||
| SNA / Snap-on Incorporated | 0,01 | 15,00 | 2,01 | 6,34 | 1,1257 | -0,0160 | |||
| VIG / Vanguard Specialized Funds - Vanguard Dividend Appreciation ETF | 0,01 | 9,47 | 1,72 | 15,49 | 0,9627 | 0,0639 | |||
| QCOM / QUALCOMM Incorporated | 0,01 | 14,93 | 1,51 | 19,16 | 0,8449 | 0,0803 | |||
| YUM / Yum! Brands, Inc. | 0,01 | 21,57 | 1,45 | 14,55 | 0,8101 | 0,0478 | |||
| V / Visa Inc. | 0,00 | 7,02 | 1,45 | 8,56 | 0,8078 | 0,0053 | |||
| EXPD / Expeditors International of Washington, Inc. | 0,01 | 17,45 | 1,44 | 11,66 | 0,8027 | 0,0277 | |||
| MA / Mastercard Incorporated | 0,00 | 6,27 | 1,42 | 8,92 | 0,7918 | 0,0084 | |||
| ITW / Illinois Tool Works Inc. | 0,01 | 15,66 | 1,41 | 15,25 | 0,7901 | 0,0513 | |||
| ALLE / Allegion plc | 0,01 | 1,38 | 0,7731 | 0,7731 | |||||
| PHM / PulteGroup, Inc. | 0,01 | 1,37 | 0,7669 | 0,7669 | |||||
| PPG / PPG Industries, Inc. | 0,01 | 1,37 | 0,7634 | 0,7634 | |||||
| AON / Aon plc | 0,00 | 20,35 | 1,32 | 7,47 | 0,7402 | -0,0027 | |||
| AVY / Avery Dennison Corporation | 0,01 | 1,31 | 0,7334 | 0,7334 | |||||
| PAYX / Paychex, Inc. | 0,01 | 7,26 | 1,30 | 1,17 | 0,7264 | -0,0474 | |||
| ACN / Accenture plc | 0,00 | 1,26 | 0,7058 | 0,7058 | |||||
| ZTS / Zoetis Inc. | 0,01 | 10,23 | 1,24 | 4,39 | 0,6908 | -0,0227 | |||
| VOO / Vanguard Index Funds - Vanguard S&P 500 ETF | 0,00 | 17,24 | 1,22 | 29,48 | 0,6825 | 0,1137 | |||
| GOOGL / Alphabet Inc. | 0,01 | 2,68 | 1,14 | 16,92 | 0,6374 | 0,0496 | |||
| VYM / Vanguard Whitehall Funds - Vanguard High Dividend Yield ETF | 0,01 | 4,38 | 0,96 | 7,97 | 0,5378 | 0,0004 | |||
| RTX / RTX Corporation | 0,01 | -0,40 | 0,87 | 9,75 | 0,4850 | 0,0088 | |||
| CSCO / Cisco Systems, Inc. | 0,01 | 9,15 | 0,78 | 22,71 | 0,4350 | 0,0529 | |||
| LMT / Lockheed Martin Corporation | 0,00 | 5,28 | 0,77 | 8,97 | 0,4278 | 0,0045 | |||
| TROW / T. Rowe Price Group, Inc. | 0,01 | -58,07 | 0,75 | -55,95 | 0,4202 | -0,6074 | |||
| CME / CME Group Inc. | 0,00 | -64,21 | 0,72 | -62,83 | 0,4009 | -0,7618 | |||
| VZ / Verizon Communications Inc. | 0,02 | 9,35 | 0,71 | 4,41 | 0,3975 | -0,0132 | |||
| DGX / Quest Diagnostics Incorporated | 0,00 | 13,50 | 0,69 | 20,60 | 0,3834 | 0,0408 | |||
| VICI / VICI Properties Inc. | 0,02 | 14,93 | 0,68 | 14,86 | 0,3806 | 0,0233 | |||
| USB / U.S. Bancorp | 0,01 | 13,22 | 0,68 | 21,33 | 0,3789 | 0,0423 | |||
| FOXA / Fox Corporation | 0,01 | 14,74 | 0,67 | 13,68 | 0,3764 | 0,0191 | |||
| CL / Colgate-Palmolive Company | 0,01 | 14,69 | 0,67 | 11,33 | 0,3734 | 0,0115 | |||
| KMB / Kimberly-Clark Corporation | 0,01 | 13,74 | 0,66 | 2,96 | 0,3692 | -0,0172 | |||
| CF / CF Industries Holdings, Inc. | 0,01 | -7,35 | 0,66 | 9,27 | 0,3689 | 0,0047 | |||
| MO / Altria Group, Inc. | 0,01 | 6,92 | 0,66 | 4,44 | 0,3680 | -0,0119 | |||
| GIS / General Mills, Inc. | 0,01 | 26,25 | 0,65 | 9,40 | 0,3647 | 0,0052 | |||
| XOM / Exxon Mobil Corporation | 0,01 | 5,34 | 0,62 | -4,60 | 0,3481 | -0,0449 | |||
| CAG / Conagra Brands, Inc. | 0,03 | 0,60 | 0,3350 | 0,3350 | |||||
| KO / The Coca-Cola Company | 0,01 | 0,26 | 0,59 | -1,01 | 0,3308 | -0,0292 | |||
| TSLA / Tesla, Inc. | 0,00 | 4,71 | 0,54 | 28,37 | 0,3039 | 0,0485 | |||
| TMUS / T-Mobile US, Inc. | 0,00 | 0,40 | 0,48 | -10,45 | 0,2688 | -0,0544 | |||
| HRB / H&R Block, Inc. | 0,01 | 0,67 | 0,34 | 0,59 | 0,1902 | -0,0136 | |||
| NEE / NextEra Energy, Inc. | 0,00 | -0,38 | 0,33 | -2,40 | 0,1827 | -0,0191 | |||
| VXUS / Vanguard STAR Funds - Vanguard Total International Stock ETF | 0,00 | 0,71 | 0,28 | 12,30 | 0,1583 | 0,0060 | |||
| META / Meta Platforms, Inc. | 0,00 | 2,43 | 0,28 | 31,46 | 0,1570 | 0,0281 | |||
| CVX / Chevron Corporation | 0,00 | 3,77 | 0,27 | -11,11 | 0,1521 | -0,0325 | |||
| PANW / Palo Alto Networks, Inc. | 0,00 | 8,23 | 0,27 | 30,14 | 0,1521 | 0,0257 | |||
| CRH / CRH plc | 0,00 | -65,24 | 0,26 | -63,73 | 0,1427 | -0,2814 | |||
| LOW / Lowe's Companies, Inc. | 0,00 | 19,04 | 0,24 | 13,08 | 0,1357 | 0,0066 | |||
| BA / The Boeing Company | 0,00 | 0,24 | 0,1355 | 0,1355 | |||||
| PM / Philip Morris International Inc. | 0,00 | 0,23 | 0,1259 | 0,1259 | |||||
| JBL / Jabil Inc. | 0,00 | 0,22 | 0,1227 | 0,1227 | |||||
| DY / Dycom Industries, Inc. | 0,00 | 0,21 | 0,1198 | 0,1198 | |||||
| FLEX / Flex Ltd. | 0,00 | 0,20 | 0,1124 | 0,1124 | |||||
| MDLZ / Mondelez International, Inc. | 0,00 | -100,00 | 0,00 | 0,0000 | |||||
| BLK / BlackRock, Inc. | 0,00 | -100,00 | 0,00 | 0,0000 | |||||
| DVN / Devon Energy Corporation | 0,00 | -100,00 | 0,00 | 0,0000 |