Statistiques de base
| Valeur du portefeuille | $ 192 006 |
| Positions actuelles | 108 |
Dernières positions, performances, ASG (à partir des dépôts 13F, 13D)
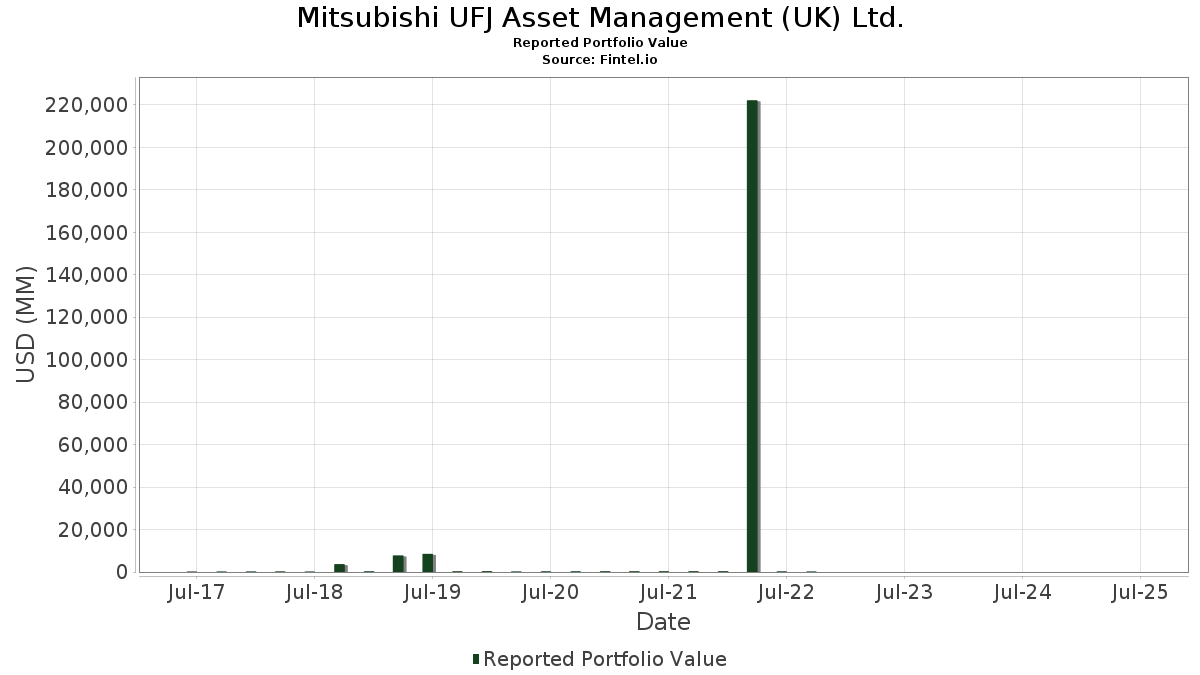
Mitsubishi UFJ Asset Management (UK) Ltd. a déclaré un total de 108 positions dans ses derniers dépôts auprès de la SEC. La valeur la plus récente du portefeuille est calculée à 192 006 USD. Les actifs sous gestion réels (ASG) sont cette valeur plus les liquidités (qui ne sont pas divulguées). Les principales positions de Mitsubishi UFJ Asset Management (UK) Ltd. sont iShares Trust - iShares MSCI Kokusai ETF (US:TOK) , Vanguard Admiral Funds - Vanguard S&P Small-Cap 600 ETF (US:VIOO) , NVIDIA Corporation (US:NVDA) , Microsoft Corporation (US:MSFT) , and Meta Platforms, Inc. (US:META) . Les nouvelles positions de Mitsubishi UFJ Asset Management (UK) Ltd. incluent Huntington Ingalls Industries, Inc. (US:HII) , VanEck ETF Trust - VanEck Gold Miners ETF (US:GDX) , .
Meilleures augmentations ce trimestre
Nous utilisons la variation de l'allocation du portefeuille car il s'agit de l'indicateur le plus significatif. Les changements peuvent être dus à des transactions ou à des variations de prix des actions.
| Titre | Actions (en millions) |
Valeur ($ en millions) |
% du portefeuille | ΔPortefeuille % |
|---|---|---|---|---|
| 0,01 | 0,01 | 3,3061 | 1,3653 | |
| 0,01 | 0,00 | 2,0098 | 1,3276 | |
| 0,01 | 0,00 | 2,3791 | 1,1786 | |
| 0,15 | 0,02 | 10,1101 | 1,1434 | |
| 0,01 | 0,00 | 1,0552 | 1,0552 | |
| 0,01 | 0,00 | 1,1901 | 0,9391 | |
| 0,05 | 0,01 | 4,1145 | 0,8764 | |
| 0,01 | 0,00 | 1,1208 | 0,7601 | |
| 0,00 | 0,00 | 1,3921 | 0,7001 | |
| 0,01 | 0,00 | 0,9942 | 0,6879 |
Principales baisses ce trimestre
Nous utilisons la variation de l'allocation du portefeuille car il s'agit de l'indicateur le plus significatif. Les changements peuvent être dus à des transactions ou à des variations de prix des actions.
| Titre | Actions (en millions) |
Valeur ($ en millions) |
% du portefeuille | ΔPortefeuille % |
|---|---|---|---|---|
| 0,02 | 0,00 | 2,1369 | -1,8448 | |
| 0,00 | 0,00 | 0,2104 | -1,5344 | |
| 0,10 | 0,01 | 5,0509 | -1,4915 | |
| 0,02 | 0,00 | 0,7422 | -1,2253 | |
| 0,01 | 0,00 | 0,8182 | -0,9418 | |
| 0,01 | 0,01 | 3,3421 | -0,8585 | |
| 0,01 | 0,00 | 1,0562 | -0,7483 | |
| 0,01 | 0,00 | 0,5396 | -0,5061 | |
| 0,01 | 0,00 | 0,2531 | -0,4786 | |
| 0,00 | 0,00 | 0,7734 | -0,4694 |
Déclarations 13F et dépôts de fonds
Ce formulaire a été déposé le 2025-07-18 pour la période de déclaration 2025-06-30. Cliquez sur l'icône du lien pour voir l'historique complet des transactions.
Mettre à niveau pour débloquer les données premium et exporter vers Excel ![]() .
.
| Titre | Type | Prix moyen de l'action | Actions (en millions) |
ΔActions (%) |
ΔActions (%) |
Valeur ($ en millions) |
Portefeuille (%) |
ΔPortefeuille (%) |
|
|---|---|---|---|---|---|---|---|---|---|
| TOK / iShares Trust - iShares MSCI Kokusai ETF | 0,15 | 6,42 | 0,02 | 18,75 | 10,1101 | 1,1434 | |||
| VIOO / Vanguard Admiral Funds - Vanguard S&P Small-Cap 600 ETF | 0,10 | -23,24 | 0,01 | -25,00 | 5,0509 | -1,4915 | |||
| NVDA / NVIDIA Corporation | 0,05 | -9,09 | 0,01 | 40,00 | 4,1145 | 0,8764 | |||
| MSFT / Microsoft Corporation | 0,01 | -37,38 | 0,01 | -14,29 | 3,3421 | -0,8585 | |||
| META / Meta Platforms, Inc. | 0,01 | 38,71 | 0,01 | 100,00 | 3,3061 | 1,3653 | |||
| SPSM / SPDR Series Trust - SPDR Portfolio S&P 600 Small Cap ETF | 0,14 | 0,00 | 0,01 | 20,00 | 3,1634 | 0,0063 | |||
| JPM / JPMorgan Chase & Co. | 0,02 | -9,52 | 0,01 | 0,00 | 2,8687 | 0,0706 | |||
| AMZN / Amazon.com, Inc. | 0,02 | -18,25 | 0,00 | -20,00 | 2,5593 | -0,2724 | |||
| INTU / Intuit Inc. | 0,01 | 61,11 | 0,00 | 100,00 | 2,3791 | 1,1786 | |||
| IJR / iShares Trust - iShares Core S&P Small-Cap ETF | 0,04 | 0,00 | 0,00 | 0,00 | 2,3338 | 0,0051 | |||
| AAPL / Apple Inc. | 0,02 | -39,39 | 0,00 | -42,86 | 2,1369 | -1,8448 | |||
| XLP / The Select Sector SPDR Trust - The Consumer Staples Select Sector SPDR Fund | 0,05 | -14,36 | 0,00 | -25,00 | 2,0114 | -0,4597 | |||
| AVGO / Broadcom Inc. | 0,01 | 86,67 | 0,00 | 200,00 | 2,0098 | 1,3276 | |||
| GOOGL / Alphabet Inc. | 0,02 | -18,18 | 0,00 | 0,00 | 1,6520 | -0,1960 | |||
| BRK.A / Berkshire Hathaway Inc. | 0,00 | 0,00 | 0,00 | -33,33 | 1,5182 | -0,2168 | |||
| GILD / Gilead Sciences, Inc. | 0,03 | 13,04 | 0,00 | 0,00 | 1,5015 | 0,1017 | |||
| NOW / ServiceNow, Inc. | 0,00 | 62,50 | 0,00 | 100,00 | 1,3921 | 0,7001 | |||
| TJX / The TJX Companies, Inc. | 0,02 | 40,00 | 0,00 | 100,00 | 1,3505 | 0,3580 | |||
| SNOW / Snowflake Inc. | 0,01 | 4,55 | 0,00 | 100,00 | 1,3401 | 0,4666 | |||
| XOM / Exxon Mobil Corporation | 0,02 | 57,14 | 0,00 | 100,00 | 1,2354 | 0,3309 | |||
| ETN / Eaton Corporation plc | 0,01 | 276,47 | 0,00 | 1,1901 | 0,9391 | ||||
| TSLA / Tesla, Inc. | 0,01 | 16,95 | 0,00 | 100,00 | 1,1416 | 0,3111 | |||
| TSM / Taiwan Semiconductor Manufacturing Company Limited - Depositary Receipt (Common Stock) | 0,01 | 137,50 | 0,00 | 1,1208 | 0,7601 | ||||
| RTX / RTX Corporation | 0,01 | -6,45 | 0,00 | 0,00 | 1,1026 | -0,0126 | |||
| CB / Chubb Limited | 0,01 | -36,36 | 0,00 | -33,33 | 1,0562 | -0,7483 | |||
| XLK / The Select Sector SPDR Trust - The Technology Select Sector SPDR Fund | 0,01 | 0,00 | 1,0552 | 1,0552 | |||||
| V / Visa Inc. | 0,01 | 175,00 | 0,00 | 1,0172 | 0,6364 | ||||
| CRM / Salesforce, Inc. | 0,01 | 233,33 | 0,00 | 0,9942 | 0,6879 | ||||
| XLU / The Select Sector SPDR Trust - The Utilities Select Sector SPDR Fund | 0,02 | 15,00 | 0,00 | 0,00 | 0,9781 | 0,1215 | |||
| EQT / EQT Corporation | 0,03 | 0,00 | 0,00 | 0,00 | 0,9114 | 0,0407 | |||
| SCHW / The Charles Schwab Corporation | 0,02 | 58,33 | 0,00 | 0,9031 | 0,3930 | ||||
| SCI / Service Corporation International | 0,02 | 0,00 | 0,00 | 0,00 | 0,8901 | -0,0247 | |||
| HMN / Horace Mann Educators Corporation | 0,04 | 0,00 | 0,00 | 0,00 | 0,8505 | -0,0317 | |||
| ITRI / Itron, Inc. | 0,01 | 0,00 | 0,00 | 0,00 | 0,8229 | 0,1401 | |||
| BA / The Boeing Company | 0,01 | -60,53 | 0,00 | -66,67 | 0,8182 | -0,9418 | |||
| GTLS / Chart Industries, Inc. | 0,01 | 0,00 | 0,00 | 0,00 | 0,8146 | 0,0698 | |||
| LLY / Eli Lilly and Company | 0,00 | 0,00 | 0,00 | 0,00 | 0,8120 | -0,0854 | |||
| ATO / Atmos Energy Corporation | 0,01 | 0,00 | 0,00 | 0,00 | 0,8026 | -0,0372 | |||
| MGY / Magnolia Oil & Gas Corporation | 0,07 | 0,00 | 0,00 | 0,00 | 0,7963 | -0,1369 | |||
| AZO / AutoZone, Inc. | 0,00 | -33,33 | 0,00 | -50,00 | 0,7734 | -0,4694 | |||
| CVS / CVS Health Corporation | 0,02 | 16,67 | 0,00 | 0,00 | 0,7547 | 0,0920 | |||
| EVTC / EVERTEC, Inc. | 0,04 | 0,00 | 0,00 | 0,00 | 0,7510 | -0,0480 | |||
| VNQ / Vanguard Specialized Funds - Vanguard Real Estate ETF | 0,02 | -60,00 | 0,00 | -66,67 | 0,7422 | -1,2253 | |||
| MASI / Masimo Corporation | 0,01 | 0,00 | 0,00 | 0,00 | 0,7010 | -0,0231 | |||
| EGP / EastGroup Properties, Inc. | 0,01 | 0,00 | 0,00 | 0,00 | 0,6963 | -0,0690 | |||
| DGX / Quest Diagnostics Incorporated | 0,01 | -12,50 | 0,00 | 0,00 | 0,6547 | -0,0808 | |||
| OFG / OFG Bancorp | 0,03 | 0,00 | 0,00 | 0,00 | 0,6463 | 0,0157 | |||
| DIS / The Walt Disney Company | 0,01 | 0,00 | 0,6458 | 0,6458 | |||||
| BMI / Badger Meter, Inc. | 0,01 | 0,00 | 0,00 | 0,6380 | 0,1214 | ||||
| MMM / 3M Company | 0,01 | -20,00 | 0,00 | 0,00 | 0,6344 | -0,1636 | |||
| UNH / UnitedHealth Group Incorporated | 0,00 | 1 800,00 | 0,00 | 0,6172 | 0,5601 | ||||
| EXLS / ExlService Holdings, Inc. | 0,03 | 0,00 | 0,00 | 0,00 | 0,6156 | -0,0770 | |||
| FSS / Federal Signal Corporation | 0,01 | 0,00 | 0,00 | 0,6099 | 0,1704 | ||||
| BLK / BlackRock, Inc. | 0,00 | -21,43 | 0,00 | 0,00 | 0,6010 | -0,1187 | |||
| OLLI / Ollie's Bargain Outlet Holdings, Inc. | 0,01 | 0,00 | 0,00 | 0,5833 | 0,0461 | ||||
| LANC / Lancaster Colony Corporation | 0,01 | 0,00 | 0,00 | 0,00 | 0,5666 | -0,0325 | |||
| VST / Vistra Corp. | 0,01 | 833,33 | 0,00 | 0,5651 | 0,5271 | ||||
| NUE / Nucor Corporation | 0,01 | -50,00 | 0,00 | 0,00 | 0,5396 | -0,5061 | |||
| GE / General Electric Company | 0,00 | -55,56 | 0,00 | 0,00 | 0,5364 | -0,4419 | |||
| ANET / Arista Networks Inc | 0,01 | -37,50 | 0,00 | 0,00 | 0,5328 | -0,1408 | |||
| SAFT / Safety Insurance Group, Inc. | 0,01 | 0,00 | 0,00 | 0,5167 | -0,0190 | ||||
| WBS / Webster Financial Corporation | 0,02 | 0,00 | 0,00 | 0,5120 | 0,0079 | ||||
| ISRG / Intuitive Surgical, Inc. | 0,00 | -10,00 | 0,00 | 0,5094 | -0,0290 | ||||
| LNG / Cheniere Energy, Inc. | 0,00 | 0,00 | 0,00 | 0,5073 | 0,0043 | ||||
| CRWD / CrowdStrike Holdings, Inc. | 0,00 | -36,67 | 0,00 | -100,00 | 0,5042 | -0,0706 | |||
| CACI / CACI International Inc | 0,00 | 0,00 | 0,00 | 0,4963 | 0,0976 | ||||
| BYD / Boyd Gaming Corporation | 0,01 | 0,00 | 0,00 | 0,4890 | 0,0599 | ||||
| MOS / The Mosaic Company | 0,03 | 525,00 | 0,00 | 0,4750 | 0,4163 | ||||
| XLI / The Select Sector SPDR Trust - The Industrial Select Sector SPDR Fund | 0,01 | 50,00 | 0,00 | 0,4609 | 0,1763 | ||||
| AMT / American Tower Corporation | 0,00 | -20,00 | 0,00 | -100,00 | 0,4604 | -0,1306 | |||
| HII / Huntington Ingalls Industries, Inc. | 0,00 | 0,00 | 0,3771 | 0,3771 | |||||
| STE / STERIS plc | 0,00 | -25,00 | 0,00 | 0,3755 | -0,1172 | ||||
| NGVT / Ingevity Corporation | 0,02 | 0,00 | 0,00 | 0,3588 | 0,0150 | ||||
| GDX / VanEck ETF Trust - VanEck Gold Miners ETF | 0,01 | 0,00 | 0,3526 | 0,3526 | |||||
| LW / Lamb Weston Holdings, Inc. | 0,01 | 0,00 | 0,3510 | 0,3510 | |||||
| GMED / Globus Medical, Inc. | 0,01 | 0,00 | 0,00 | 0,3380 | -0,0993 | ||||
| MRK / Merck & Co., Inc. | 0,01 | 0,00 | 0,00 | 0,3297 | -0,0603 | ||||
| FBP / First BanCorp. | 0,03 | 0,00 | 0,00 | 0,3146 | 0,0126 | ||||
| KO / The Coca-Cola Company | 0,01 | -20,00 | 0,00 | 0,2948 | -0,0942 | ||||
| MMC / Marsh & McLennan Companies, Inc. | 0,00 | -54,55 | 0,00 | -100,00 | 0,2849 | -0,4441 | |||
| GEV / GE Vernova Inc. | 0,00 | 0,00 | 0,00 | 0,2755 | 0,1098 | ||||
| CCJ / Cameco Corporation | 0,01 | 0,00 | 0,2708 | 0,2708 | |||||
| FCX / Freeport-McMoRan Inc. | 0,01 | -20,00 | 0,00 | 0,2708 | -0,0377 | ||||
| HCSG / Healthcare Services Group, Inc. | 0,03 | 0,00 | 0,00 | 0,2661 | 0,0798 | ||||
| GJR / Strats Trust For Procter & Gambel Security - Preferred Security | 0,00 | 45,45 | 0,00 | 0,2656 | 0,0619 | ||||
| NEE / NextEra Energy, Inc. | 0,01 | -63,16 | 0,00 | -100,00 | 0,2531 | -0,4786 | |||
| CEG / Constellation Energy Corporation | 0,00 | -25,00 | 0,00 | 0,2521 | 0,0332 | ||||
| BOOT / Boot Barn Holdings, Inc. | 0,00 | 0,00 | 0,00 | 0,2375 | 0,0626 | ||||
| JJSF / J&J Snack Foods Corp. | 0,00 | 0,00 | 0,00 | 0,2365 | -0,0498 | ||||
| SLB / Schlumberger Limited | 0,01 | -50,00 | 0,00 | -100,00 | 0,2286 | -0,3618 | |||
| MDLZ / Mondelez International, Inc. | 0,01 | -25,00 | 0,00 | 0,2109 | -0,0840 | ||||
| XLV / The Select Sector SPDR Trust - The Health Care Select Sector SPDR Fund | 0,00 | -86,36 | 0,00 | -100,00 | 0,2104 | -1,5344 | |||
| CHH / Choice Hotels International, Inc. | 0,00 | 0,00 | 0,00 | 0,1984 | -0,0178 | ||||
| BURL / Burlington Stores, Inc. | 0,00 | 0,00 | 0,00 | 0,1818 | -0,0122 | ||||
| ANIP / ANI Pharmaceuticals, Inc. | 0,01 | 0,00 | 0,00 | 0,1698 | -0,0122 | ||||
| USRT / iShares Trust - iShares Core U.S. REIT ETF | 0,01 | 0,00 | 0,00 | 0,1677 | -0,0105 | ||||
| OTIS / Otis Worldwide Corporation | 0,00 | 0,00 | 0,00 | 0,1547 | -0,0137 | ||||
| WMT / Walmart Inc. | 0,00 | -75,00 | 0,00 | -100,00 | 0,1526 | -0,4194 | |||
| SFM / Sprouts Farmers Market, Inc. | 0,00 | 0,00 | 0,00 | 0,1458 | 0,0051 | ||||
| SPSC / SPS Commerce, Inc. | 0,00 | 0,00 | 0,00 | 0,1417 | -0,0023 | ||||
| CVCO / Cavco Industries, Inc. | 0,00 | 0,00 | 0,00 | 0,1130 | -0,0282 | ||||
| TILE / Interface, Inc. | 0,01 | 0,00 | 0,00 | 0,1089 | 0,0013 | ||||
| PM / Philip Morris International Inc. | 0,00 | 0,00 | 0,00 | 0,0948 | 0,0084 | ||||
| MU / Micron Technology, Inc. | 0,00 | -90,00 | 0,00 | 0,0641 | -0,4080 | ||||
| LIVN / LivaNova PLC | 0,00 | -50,00 | 0,00 | 0,0589 | -0,0476 | ||||
| COST / Costco Wholesale Corporation | 0,00 | 0,00 | 0,00 | 0,0516 | -0,0000 | ||||
| WTRG / Essential Utilities, Inc. | 0,00 | 0,00 | 0,00 | 0,0385 | -0,0044 | ||||
| LNTH / Lantheus Holdings, Inc. | 0,00 | 0,00 | 0,00 | 0,0130 | -0,0027 | ||||
| PANW / Palo Alto Networks, Inc. | 0,00 | -100,00 | 0,00 | 0,0000 | |||||
| IART / Integra LifeSciences Holdings Corporation | 0,00 | -100,00 | 0,00 | 0,0000 | |||||
| JNJ / Johnson & Johnson | 0,00 | -100,00 | 0,00 | 0,0000 | |||||
| DXCM / DexCom, Inc. | 0,00 | -100,00 | 0,00 | 0,0000 | |||||
| AXP / American Express Company | 0,00 | -100,00 | 0,00 | 0,0000 | -0,2922 | ||||
| NEO / NeoGenomics, Inc. | 0,00 | -100,00 | 0,00 | 0,0000 | |||||
| TMO / Thermo Fisher Scientific Inc. | 0,00 | -100,00 | 0,00 | 0,0000 | |||||
| CAG / Conagra Brands, Inc. | 0,00 | -100,00 | 0,00 | 0,0000 | |||||
| VRTX / Vertex Pharmaceuticals Incorporated | 0,00 | -100,00 | 0,00 | 0,0000 | |||||
| TMUS / T-Mobile US, Inc. | 0,00 | -100,00 | 0,00 | 0,0000 |