Statistiques de base
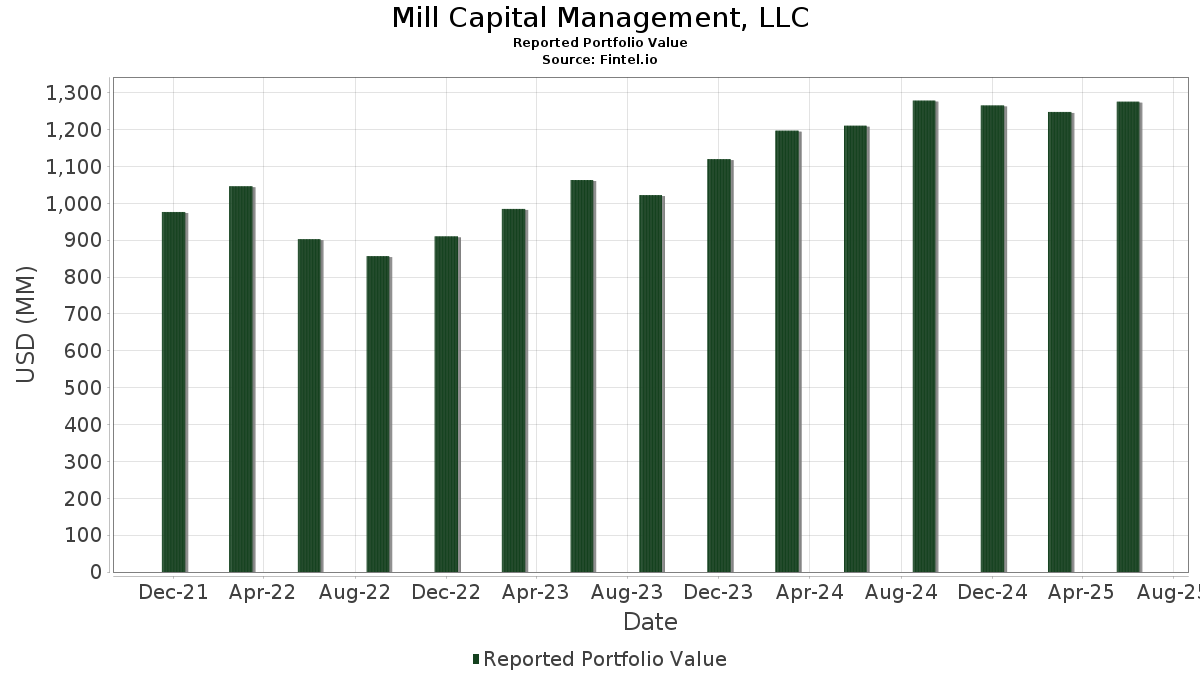
| Valeur du portefeuille | $ 1 275 738 845 |
| Positions actuelles | 120 |
Dernières positions, performances, ASG (à partir des dépôts 13F, 13D)
Mill Capital Management, LLC a déclaré un total de 120 positions dans ses derniers dépôts auprès de la SEC. La valeur la plus récente du portefeuille est calculée à 1 275 738 845 USD. Les actifs sous gestion réels (ASG) sont cette valeur plus les liquidités (qui ne sont pas divulguées). Les principales positions de Mill Capital Management, LLC sont Apple Inc. (US:AAPL) , Microsoft Corporation (US:MSFT) , Berkshire Hathaway Inc. (US:BRK.A) , Visa Inc. (US:V) , and Alphabet Inc. (US:GOOG) . Les nouvelles positions de Mill Capital Management, LLC incluent SPDR Series Trust - SPDR Portfolio Aggregate Bond ETF (US:SPAB) , .
Meilleures augmentations ce trimestre
Nous utilisons la variation de l'allocation du portefeuille car il s'agit de l'indicateur le plus significatif. Les changements peuvent être dus à des transactions ou à des variations de prix des actions.
| Titre | Actions (en millions) |
Valeur ($ en millions) |
% du portefeuille | ΔPortefeuille % |
|---|---|---|---|---|
| 0,21 | 102,25 | 8,0153 | 1,6184 | |
| 0,20 | 59,18 | 4,6390 | 0,5464 | |
| 0,38 | 67,36 | 5,2798 | 0,5262 | |
| 0,01 | 32,74 | 2,5662 | 0,4777 | |
| 0,16 | 19,76 | 1,5490 | 0,4354 | |
| 0,13 | 39,99 | 3,1349 | 0,4335 | |
| 0,19 | 41,73 | 3,2714 | 0,3954 | |
| 0,03 | 39,70 | 3,1119 | 0,2092 | |
| 0,02 | 14,34 | 1,1244 | 0,1859 | |
| 0,06 | 15,48 | 1,2136 | 0,1838 |
Principales baisses ce trimestre
Nous utilisons la variation de l'allocation du portefeuille car il s'agit de l'indicateur le plus significatif. Les changements peuvent être dus à des transactions ou à des variations de prix des actions.
| Titre | Actions (en millions) |
Valeur ($ en millions) |
% du portefeuille | ΔPortefeuille % |
|---|---|---|---|---|
| 0,00 | 87,46 | 6,8553 | -0,9508 | |
| 0,54 | 110,66 | 8,6742 | -0,9042 | |
| 0,05 | 15,69 | 1,2302 | -0,7742 | |
| 0,08 | 32,24 | 2,5271 | -0,6243 | |
| 0,14 | 23,45 | 1,8379 | -0,5638 | |
| 0,08 | 37,16 | 2,9126 | -0,4087 | |
| 0,36 | 39,16 | 3,0694 | -0,3852 | |
| 0,44 | 21,62 | 1,6951 | -0,2962 | |
| 0,20 | 69,90 | 5,4794 | -0,2014 | |
| 0,60 | 21,29 | 1,6691 | -0,1482 |
Déclarations 13F et dépôts de fonds
Ce formulaire a été déposé le 2025-08-04 pour la période de déclaration 2025-06-30. Cliquez sur l'icône du lien pour voir l'historique complet des transactions.
Mettre à niveau pour débloquer les données premium et exporter vers Excel ![]() .
.
| Titre | Type | Prix moyen de l'action | Actions (en millions) |
ΔActions (%) |
ΔActions (%) |
Valeur ($ en millions) |
Portefeuille (%) |
ΔPortefeuille (%) |
|
|---|---|---|---|---|---|---|---|---|---|
| AAPL / Apple Inc. | 0,54 | 0,24 | 110,66 | -7,42 | 8,6742 | -0,9042 | |||
| MSFT / Microsoft Corporation | 0,21 | -3,32 | 102,25 | 28,10 | 8,0153 | 1,6184 | |||
| BRK.A / Berkshire Hathaway Inc. | 0,00 | -1,64 | 87,46 | -10,22 | 6,8553 | -0,9508 | |||
| V / Visa Inc. | 0,20 | -2,66 | 69,90 | -1,39 | 5,4794 | -0,2014 | |||
| GOOG / Alphabet Inc. | 0,38 | 0,01 | 67,36 | 13,55 | 5,2798 | 0,5262 | |||
| JPM / JPMorgan Chase & Co. | 0,20 | -1,95 | 59,18 | 15,88 | 4,6390 | 0,5464 | |||
| AMZN / Amazon.com, Inc. | 0,19 | 0,85 | 41,73 | 16,29 | 3,2714 | 0,3954 | |||
| AXP / American Express Company | 0,13 | 0,07 | 39,99 | 18,64 | 3,1349 | 0,4335 | |||
| TDG / TransDigm Group Incorporated | 0,03 | -0,30 | 39,70 | 9,60 | 3,1119 | 0,2092 | |||
| XOM / Exxon Mobil Corporation | 0,36 | 0,21 | 39,16 | -9,17 | 3,0694 | -0,3852 | |||
| BRK.B / Berkshire Hathaway Inc. | 0,08 | -1,71 | 37,16 | -10,35 | 2,9126 | -0,4087 | |||
| BKNG / Booking Holdings Inc. | 0,01 | -0,04 | 32,74 | 25,62 | 2,5662 | 0,4777 | |||
| TMO / Thermo Fisher Scientific Inc. | 0,08 | 0,61 | 32,24 | -18,02 | 2,5271 | -0,6243 | |||
| UNP / Union Pacific Corporation | 0,13 | 0,52 | 29,78 | -2,10 | 2,3343 | -0,1033 | |||
| AMT / American Tower Corporation | 0,12 | 0,46 | 26,98 | 2,03 | 2,1148 | -0,0041 | |||
| ICE / Intercontinental Exchange, Inc. | 0,14 | 0,35 | 25,86 | 6,74 | 2,0272 | 0,0855 | |||
| FI / Fiserv, Inc. | 0,14 | 0,21 | 23,45 | -21,77 | 1,8379 | -0,5638 | |||
| CPRT / Copart, Inc. | 0,44 | 0,36 | 21,62 | -12,97 | 1,6951 | -0,2962 | |||
| CMCSA / Comcast Corporation | 0,60 | -2,92 | 21,29 | -6,10 | 1,6691 | -0,1482 | |||
| MU / Micron Technology, Inc. | 0,16 | 0,26 | 19,76 | 42,21 | 1,5490 | 0,4354 | |||
| ZTS / Zoetis Inc. | 0,12 | 0,57 | 19,40 | -4,75 | 1,5211 | -0,1115 | |||
| VRSN / VeriSign, Inc. | 0,07 | 0,27 | 19,22 | 14,07 | 1,5062 | 0,1563 | |||
| LIN / Linde plc | 0,04 | 0,26 | 18,54 | 1,02 | 1,4535 | -0,0174 | |||
| CPAY / Corpay, Inc. | 0,05 | 0,36 | 18,23 | -4,51 | 1,4289 | -0,1008 | |||
| JNJ / Johnson & Johnson | 0,12 | 0,61 | 18,05 | -7,33 | 1,4149 | -0,1461 | |||
| LH / Labcorp Holdings Inc. | 0,06 | 0,41 | 16,70 | 13,25 | 1,3093 | 0,1274 | |||
| UNH / UnitedHealth Group Incorporated | 0,05 | 5,34 | 15,69 | -37,25 | 1,2302 | -0,7742 | |||
| LHX / L3Harris Technologies, Inc. | 0,06 | 0,53 | 15,48 | 20,48 | 1,2136 | 0,1838 | |||
| CRM / Salesforce, Inc. | 0,05 | 1,05 | 14,94 | 2,68 | 1,1709 | 0,0051 | |||
| ASML / ASML Holding N.V. - Depositary Receipt (Common Stock) | 0,02 | 1,27 | 14,34 | 22,48 | 1,1244 | 0,1859 | |||
| GOOGL / Alphabet Inc. | 0,08 | -0,00 | 14,18 | 13,96 | 1,1116 | 0,1144 | |||
| PM / Philip Morris International Inc. | 0,07 | -2,77 | 13,17 | 11,56 | 1,0321 | 0,0863 | |||
| OTIS / Otis Worldwide Corporation | 0,13 | 0,33 | 12,70 | -3,73 | 0,9952 | -0,0617 | |||
| TT / Trane Technologies plc | 0,02 | 0,00 | 7,80 | 29,84 | 0,6113 | 0,1299 | |||
| WFC / Wells Fargo & Company | 0,09 | 0,00 | 6,82 | 11,60 | 0,5348 | 0,0449 | |||
| MRK / Merck & Co., Inc. | 0,08 | -2,32 | 6,70 | -13,86 | 0,5249 | -0,0980 | |||
| PG / The Procter & Gamble Company | 0,04 | 0,00 | 6,00 | -6,50 | 0,4700 | -0,0440 | |||
| GE / General Electric Company | 0,02 | 0,00 | 4,97 | 28,59 | 0,3899 | 0,0799 | |||
| ETN / Eaton Corporation plc | 0,01 | 0,00 | 4,21 | 31,34 | 0,3302 | 0,0732 | |||
| PFE / Pfizer Inc. | 0,17 | -3,04 | 4,14 | -7,25 | 0,3247 | -0,0332 | |||
| CVX / Chevron Corporation | 0,03 | 0,00 | 3,97 | -14,40 | 0,3113 | -0,0605 | |||
| ELV / Elevance Health, Inc. | 0,01 | 0,00 | 3,94 | -10,59 | 0,3092 | -0,0443 | |||
| MDLZ / Mondelez International, Inc. | 0,05 | -4,85 | 3,50 | -5,45 | 0,2746 | -0,0222 | |||
| CAT / Caterpillar Inc. | 0,01 | 0,00 | 3,49 | 17,73 | 0,2738 | 0,0360 | |||
| ORCL / Oracle Corporation | 0,02 | 0,00 | 3,43 | 56,38 | 0,2690 | 0,0931 | |||
| MLM / Martin Marietta Materials, Inc. | 0,01 | 0,00 | 3,42 | 14,82 | 0,2679 | 0,0294 | |||
| LRCX / Lam Research Corporation | 0,04 | 0,00 | 3,41 | 33,88 | 0,2671 | 0,0631 | |||
| DUK / Duke Energy Corporation | 0,03 | 0,02 | 3,07 | -3,25 | 0,2408 | -0,0136 | |||
| HD / The Home Depot, Inc. | 0,01 | 0,00 | 2,69 | 0,04 | 0,2112 | -0,0046 | |||
| KO / The Coca-Cola Company | 0,04 | -1,80 | 2,52 | -3,00 | 0,1979 | -0,0107 | |||
| YUM / Yum! Brands, Inc. | 0,02 | 0,00 | 2,52 | -5,83 | 0,1977 | -0,0169 | |||
| RSG / Republic Services, Inc. | 0,01 | 0,00 | 2,49 | 1,84 | 0,1953 | -0,0008 | |||
| SHEL / Shell plc - Depositary Receipt (Common Stock) | 0,03 | 0,00 | 2,41 | -3,91 | 0,1889 | -0,0121 | |||
| NSC / Norfolk Southern Corporation | 0,01 | -0,47 | 2,34 | 7,59 | 0,1833 | 0,0091 | |||
| GEV / GE Vernova Inc. | 0,00 | -0,27 | 2,32 | 72,88 | 0,1819 | 0,0743 | |||
| BMY / Bristol-Myers Squibb Company | 0,05 | 0,00 | 2,20 | -24,11 | 0,1722 | -0,0598 | |||
| MMM / 3M Company | 0,01 | 0,00 | 2,01 | 3,67 | 0,1573 | 0,0022 | |||
| TXN / Texas Instruments Incorporated | 0,01 | 0,00 | 1,97 | 15,52 | 0,1546 | 0,0178 | |||
| SYK / Stryker Corporation | 0,00 | 0,00 | 1,91 | 6,30 | 0,1494 | 0,0057 | |||
| GSCE / GS Connect S&P GSCI Enhanced Commodity Total Return ETN | 0,00 | -0,35 | 1,80 | 29,07 | 0,1410 | 0,0293 | |||
| COP / ConocoPhillips | 0,02 | 0,00 | 1,69 | -14,54 | 0,1327 | -0,0261 | |||
| EMR / Emerson Electric Co. | 0,01 | 0,00 | 1,68 | 21,68 | 0,1320 | 0,0210 | |||
| NEE / NextEra Energy, Inc. | 0,02 | 0,00 | 1,67 | -2,06 | 0,1306 | -0,0057 | |||
| BAC / Bank of America Corporation | 0,04 | 0,00 | 1,66 | 13,44 | 0,1304 | 0,0128 | |||
| MCD / McDonald's Corporation | 0,01 | 0,00 | 1,50 | -6,49 | 0,1175 | -0,0109 | |||
| DIS / The Walt Disney Company | 0,01 | 0,00 | 1,46 | 25,69 | 0,1147 | 0,0214 | |||
| LLY / Eli Lilly and Company | 0,00 | -0,06 | 1,40 | -5,71 | 0,1101 | -0,0092 | |||
| TJX / The TJX Companies, Inc. | 0,01 | -15,94 | 1,30 | -14,79 | 0,1021 | -0,0204 | |||
| CME / CME Group Inc. | 0,00 | 0,00 | 1,24 | 3,94 | 0,0972 | 0,0016 | |||
| IR / Ingersoll Rand Inc. | 0,01 | 0,00 | 1,24 | 3,87 | 0,0969 | 0,0016 | |||
| MSI / Motorola Solutions, Inc. | 0,00 | 0,00 | 1,22 | -4,00 | 0,0959 | -0,0062 | |||
| IBM / International Business Machines Corporation | 0,00 | 0,00 | 1,21 | 18,57 | 0,0951 | 0,0131 | |||
| LOW / Lowe's Companies, Inc. | 0,01 | 0,00 | 1,12 | -4,83 | 0,0880 | -0,0066 | |||
| FCNCA / First Citizens BancShares, Inc. | 0,00 | 0,00 | 1,03 | 5,55 | 0,0805 | 0,0025 | |||
| L / Loews Corporation | 0,01 | 0,00 | 1,03 | -0,29 | 0,0805 | -0,0020 | |||
| IAU / iShares Gold Trust | 0,02 | 0,00 | 1,01 | 5,74 | 0,0794 | 0,0027 | |||
| BDX / Becton, Dickinson and Company | 0,01 | 0,00 | 0,95 | -24,82 | 0,0748 | -0,0269 | |||
| CB / Chubb Limited | 0,00 | 0,00 | 0,93 | -4,02 | 0,0729 | -0,0048 | |||
| KMB / Kimberly-Clark Corporation | 0,01 | 0,00 | 0,91 | -9,36 | 0,0714 | -0,0091 | |||
| HON / Honeywell International Inc. | 0,00 | 0,00 | 0,88 | 9,98 | 0,0691 | 0,0049 | |||
| ABBV / AbbVie Inc. | 0,00 | 0,00 | 0,81 | -11,44 | 0,0638 | -0,0098 | |||
| IWR / iShares Trust - iShares Russell Mid-Cap ETF | 0,01 | 0,00 | 0,80 | 8,09 | 0,0629 | 0,0034 | |||
| DEO / Diageo plc - Depositary Receipt (Common Stock) | 0,01 | -15,17 | 0,80 | -18,30 | 0,0626 | -0,0158 | |||
| FITB / Fifth Third Bancorp | 0,02 | -4,18 | 0,71 | 0,57 | 0,0554 | -0,0009 | |||
| PEP / PepsiCo, Inc. | 0,01 | -4,08 | 0,70 | -15,50 | 0,0547 | -0,0115 | |||
| SPAB / SPDR Series Trust - SPDR Portfolio Aggregate Bond ETF | 0,03 | 0,65 | 0,0510 | 0,0510 | |||||
| ZBH / Zimmer Biomet Holdings, Inc. | 0,01 | 0,00 | 0,62 | -19,48 | 0,0483 | -0,0130 | |||
| CMI / Cummins Inc. | 0,00 | 0,00 | 0,55 | 4,61 | 0,0427 | 0,0009 | |||
| NVS / Novartis AG - Depositary Receipt (Common Stock) | 0,00 | 0,00 | 0,54 | 8,70 | 0,0421 | 0,0024 | |||
| GEHC / GE HealthCare Technologies Inc. | 0,01 | -0,03 | 0,52 | -8,26 | 0,0410 | -0,0047 | |||
| WEC / WEC Energy Group, Inc. | 0,00 | 0,00 | 0,50 | -4,38 | 0,0394 | -0,0027 | |||
| PSX / Phillips 66 | 0,00 | 0,00 | 0,49 | -3,33 | 0,0388 | -0,0023 | |||
| BP / BP p.l.c. - Depositary Receipt (Common Stock) | 0,02 | 0,00 | 0,49 | -11,31 | 0,0387 | -0,0060 | |||
| AVGO / Broadcom Inc. | 0,00 | 0,00 | 0,48 | 64,51 | 0,0378 | 0,0143 | |||
| EQR / Equity Residential | 0,01 | 0,00 | 0,42 | -5,82 | 0,0331 | -0,0028 | |||
| EBGEF / Enbridge Inc. - Preferred Stock | 0,01 | 0,00 | 0,42 | 2,45 | 0,0328 | 0,0000 | |||
| ORI / Old Republic International Corporation | 0,01 | 0,77 | 0,42 | -1,18 | 0,0327 | -0,0011 | |||
| GRMN / Garmin Ltd. | 0,00 | 0,00 | 0,42 | -3,92 | 0,0327 | -0,0021 | |||
| PNC / The PNC Financial Services Group, Inc. | 0,00 | 0,00 | 0,39 | 6,32 | 0,0303 | 0,0011 | |||
| LNC / Lincoln National Corporation | 0,01 | 0,00 | 0,35 | -3,54 | 0,0278 | -0,0017 | |||
| SPY / SPDR S&P 500 ETF | 0,00 | 11,73 | 0,35 | 23,49 | 0,0272 | 0,0047 | |||
| DD / DuPont de Nemours, Inc. | 0,00 | -6,91 | 0,34 | -14,36 | 0,0267 | -0,0052 | |||
| WMT / Walmart Inc. | 0,00 | 0,00 | 0,34 | 11,26 | 0,0264 | 0,0022 | |||
| YUMC / Yum China Holdings, Inc. | 0,01 | -4,36 | 0,32 | -17,90 | 0,0252 | -0,0062 | |||
| ADP / Automatic Data Processing, Inc. | 0,00 | 0,00 | 0,31 | 0,98 | 0,0242 | -0,0003 | |||
| DGX / Quest Diagnostics Incorporated | 0,00 | 0,00 | 0,29 | 6,20 | 0,0228 | 0,0008 | |||
| RF / Regions Financial Corporation | 0,01 | 0,00 | 0,28 | 8,14 | 0,0219 | 0,0012 | |||
| TRV / The Travelers Companies, Inc. | 0,00 | 0,00 | 0,27 | 1,14 | 0,0210 | -0,0002 | |||
| SUSA / iShares Trust - iShares ESG Optimized MSCI USA ETF | 0,00 | 0,00 | 0,24 | 10,09 | 0,0189 | 0,0014 | |||
| BLK / BlackRock, Inc. | 0,00 | 0,00 | 0,24 | 11,27 | 0,0186 | 0,0014 | |||
| CTVA / Corteva, Inc. | 0,00 | -10,80 | 0,23 | 5,61 | 0,0178 | 0,0006 | |||
| TSLA / Tesla, Inc. | 0,00 | 0,23 | 0,0177 | 0,0177 | |||||
| SSB / SouthState Corporation | 0,00 | 0,00 | 0,22 | -0,88 | 0,0176 | -0,0005 | |||
| ITW / Illinois Tool Works Inc. | 0,00 | 0,00 | 0,21 | -0,47 | 0,0166 | -0,0004 | |||
| MO / Altria Group, Inc. | 0,00 | -51,12 | 0,20 | -52,47 | 0,0159 | -0,0182 | |||
| IVV / iShares Trust - iShares Core S&P 500 ETF | 0,00 | 0,00 | 0,16 | 10,71 | 0,0122 | 0,0009 | |||
| IWF / iShares Trust - iShares Russell 1000 Growth ETF | 0,00 | 0,00 | 0,08 | 16,67 | 0,0067 | 0,0009 | |||
| IJK / iShares Trust - iShares S&P Mid-Cap 400 Growth ETF | 0,00 | -25,00 | 0,08 | -18,18 | 0,0064 | -0,0016 | |||
| IWP / iShares Trust - iShares Russell Mid-Cap Growth ETF | 0,00 | 0,00 | 0,08 | 19,70 | 0,0062 | 0,0008 | |||
| IWM / iShares Trust - iShares Russell 2000 ETF | 0,00 | 0,00 | 0,05 | 9,52 | 0,0036 | 0,0002 | |||
| IJR / iShares Trust - iShares Core S&P Small-Cap ETF | 0,00 | -100,00 | 0,00 | 0,0000 |