Statistiques de base
| Valeur du portefeuille | $ 2 728 198 980 |
| Positions actuelles | 129 |
Dernières positions, performances, ASG (à partir des dépôts 13F, 13D)
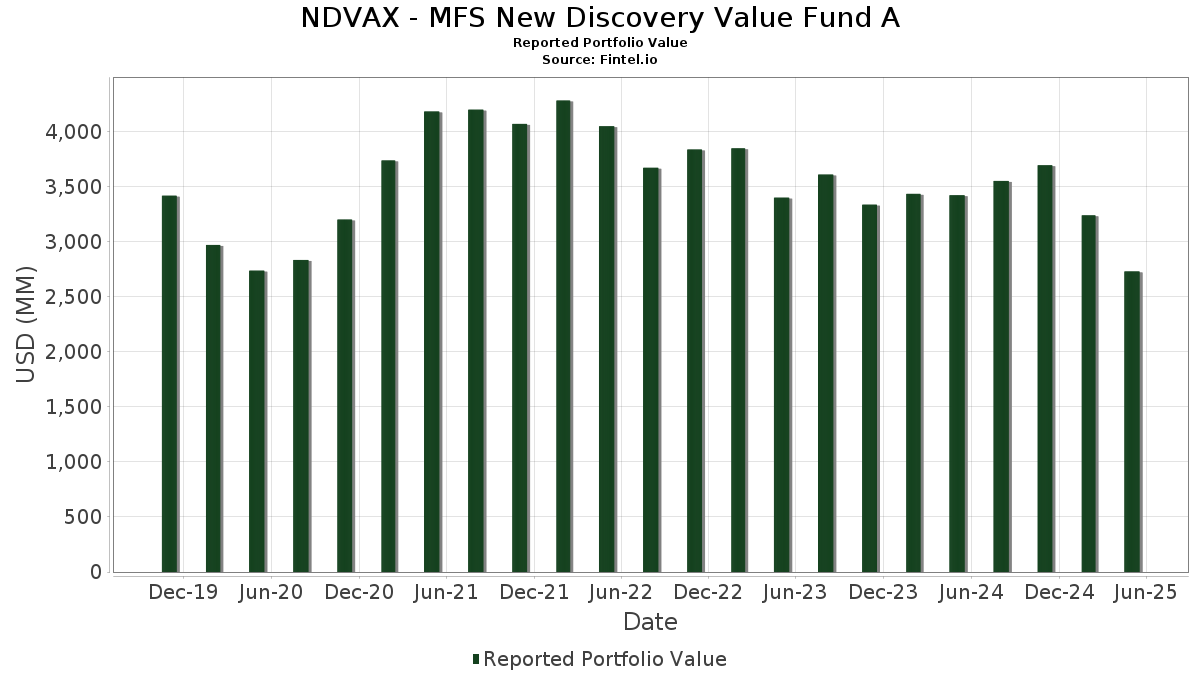
NDVAX - MFS New Discovery Value Fund A a déclaré un total de 129 positions dans ses derniers dépôts auprès de la SEC. La valeur la plus récente du portefeuille est calculée à 2 728 198 980 USD. Les actifs sous gestion réels (ASG) sont cette valeur plus les liquidités (qui ne sont pas divulguées). Les principales positions de NDVAX - MFS New Discovery Value Fund A sont Air Lease Corporation (US:AL) , Portland General Electric Company (US:POR) , Popular, Inc. (US:BPOP) , Prestige Consumer Healthcare Inc. (US:PBH) , and Prosperity Bancshares, Inc. (US:PB) . Les nouvelles positions de NDVAX - MFS New Discovery Value Fund A incluent Hancock Whitney Corporation (US:HWC) , SmartStop Self Storage REIT, Inc. (US:SMA) , Four Corners Property Trust, Inc. (US:FCPT) , Rexford Industrial Realty, Inc. (US:REXR) , and Nexstar Media Group, Inc. (DE:NXZ) .
Meilleures augmentations ce trimestre
Nous utilisons la variation de l'allocation du portefeuille car il s'agit de l'indicateur le plus significatif. Les changements peuvent être dus à des transactions ou à des variations de prix des actions.
| Titre | Actions (en millions) |
Valeur ($ en millions) |
% du portefeuille | ΔPortefeuille % |
|---|---|---|---|---|
| 0,57 | 31,26 | 1,1491 | 1,1491 | |
| 0,72 | 26,17 | 0,9619 | 0,9619 | |
| 0,81 | 22,48 | 0,8263 | 0,8263 | |
| 0,63 | 22,07 | 0,8115 | 0,8115 | |
| 0,11 | 18,20 | 0,6690 | 0,6690 | |
| 0,24 | 17,62 | 0,6476 | 0,6476 | |
| 0,57 | 17,19 | 0,6318 | 0,6318 | |
| 0,88 | 16,79 | 0,6172 | 0,6172 | |
| 0,13 | 16,76 | 0,6160 | 0,6160 | |
| 0,25 | 15,74 | 0,5788 | 0,5788 |
Principales baisses ce trimestre
Nous utilisons la variation de l'allocation du portefeuille car il s'agit de l'indicateur le plus significatif. Les changements peuvent être dus à des transactions ou à des variations de prix des actions.
| Titre | Actions (en millions) |
Valeur ($ en millions) |
% du portefeuille | ΔPortefeuille % |
|---|---|---|---|---|
| 0,22 | 7,41 | 0,2724 | -0,5366 | |
| 33,86 | 33,86 | 1,2448 | -0,4078 | |
| 0,07 | 8,46 | 0,3110 | -0,3853 | |
| 0,00 | 0,00 | -0,3464 | ||
| 11,20 | 11,20 | 0,4117 | -0,2798 | |
| 0,09 | 1,10 | 0,0404 | -0,2655 | |
| 0,53 | 21,59 | 0,7936 | -0,2447 | |
| 0,24 | 25,20 | 0,9265 | -0,2397 | |
| 0,45 | 21,54 | 0,7920 | -0,2391 | |
| 1,22 | 28,55 | 1,0498 | -0,2169 |
Déclarations 13F et dépôts de fonds
Ce formulaire a été déposé le 2025-07-25 pour la période de déclaration 2025-05-31. Cliquez sur l'icône du lien pour voir l'historique complet des transactions.
Mettre à niveau pour débloquer les données premium et exporter vers Excel ![]() .
.
| Titre | Type | Prix moyen de l'action | Actions (en millions) |
ΔActions (%) |
ΔActions (%) |
Valeur ($ en millions) |
Portefeuille (%) |
ΔPortefeuille (%) |
|
|---|---|---|---|---|---|---|---|---|---|
| AL / Air Lease Corporation | 0,68 | -16,41 | 39,13 | 0,49 | 1,4386 | 0,2297 | |||
| POR / Portland General Electric Company | 0,91 | -7,63 | 38,50 | -12,64 | 1,4154 | 0,0473 | |||
| BPOP / Popular, Inc. | 0,37 | -7,63 | 37,92 | -4,78 | 1,3941 | 0,1578 | |||
| PBH / Prestige Consumer Healthcare Inc. | 0,43 | -7,63 | 36,97 | -6,63 | 1,3592 | 0,1300 | |||
| PB / Prosperity Bancshares, Inc. | 0,52 | -13,87 | 36,46 | -21,85 | 1,3404 | -0,1078 | |||
| PPBI / Pacific Premier Bancorp, Inc. | 1,66 | -7,63 | 35,11 | -18,03 | 1,2909 | -0,0390 | |||
| SLM / SLM Corporation | 1,07 | -24,62 | 34,73 | -19,18 | 1,2766 | -0,0571 | |||
| NWE / NorthWestern Energy Group, Inc. | 0,62 | -7,63 | 34,58 | -8,62 | 1,2711 | 0,0965 | |||
| THG / The Hanover Insurance Group, Inc. | 0,19 | -20,91 | 34,16 | -18,38 | 1,2557 | -0,0434 | |||
| US55291X1090 / MFS Institutional Money Market Portfolio | 33,86 | -36,39 | 33,86 | -36,39 | 1,2448 | -0,4078 | |||
| EPRT / Essential Properties Realty Trust, Inc. | 1,03 | -7,63 | 33,43 | -8,26 | 1,2289 | 0,0978 | |||
| NOMD / Nomad Foods Limited | 1,88 | -7,63 | 32,92 | -14,48 | 1,2104 | 0,0153 | |||
| FHB / First Hawaiian, Inc. | 1,37 | -7,63 | 32,78 | -18,04 | 1,2052 | -0,0364 | |||
| HWC / Hancock Whitney Corporation | 0,57 | 31,26 | 1,1491 | 1,1491 | |||||
| PAGP / Plains GP Holdings, L.P. - Limited Partnership | 1,76 | -7,63 | 31,04 | -24,74 | 1,1413 | -0,1392 | |||
| SLGN / Silgan Holdings Inc. | 0,56 | -7,63 | 31,04 | -6,34 | 1,1410 | 0,1123 | |||
| VNT / Vontier Corporation | 0,81 | -7,63 | 29,01 | -11,59 | 1,0663 | 0,0479 | |||
| CATY / Cathay General Bancorp | 0,68 | -7,63 | 28,99 | -15,69 | 1,0657 | -0,0017 | |||
| OPCH / Option Care Health, Inc. | 0,89 | -7,63 | 28,97 | -9,89 | 1,0651 | 0,0670 | |||
| AR / Antero Resources Corporation | 0,77 | -15,05 | 28,96 | -13,32 | 1,0647 | 0,0275 | |||
| UGI / UGI Corporation | 0,80 | -7,63 | 28,94 | -2,50 | 1,0639 | 0,1425 | |||
| FIBK / First Interstate BancSystem, Inc. | 1,05 | -12,21 | 28,58 | -22,36 | 1,0506 | -0,0920 | |||
| COLB / Columbia Banking System, Inc. | 1,22 | -19,99 | 28,55 | -30,02 | 1,0498 | -0,2169 | |||
| UCB / United Community Banks, Inc. | 0,98 | -7,63 | 28,23 | -17,64 | 1,0378 | -0,0262 | |||
| AXS / AXIS Capital Holdings Limited | 0,27 | -13,87 | 28,00 | -7,72 | 1,0294 | 0,0875 | |||
| TTMI / TTM Technologies, Inc. | 0,94 | -7,63 | 28,00 | 14,39 | 1,0293 | 0,2695 | |||
| ESI / Element Solutions Inc | 1,31 | 4,85 | 27,92 | -14,14 | 1,0265 | 0,0169 | |||
| CON / Concentra Group Holdings Parent, Inc. | 1,29 | 2,44 | 27,90 | -1,87 | 1,0257 | 0,1431 | |||
| ATMU / Atmus Filtration Technologies Inc. | 0,77 | -7,63 | 27,83 | -16,41 | 1,0230 | -0,0104 | |||
| IRT / Independence Realty Trust, Inc. | 1,48 | -7,63 | 27,53 | -21,24 | 1,0119 | -0,0729 | |||
| EWBC / East West Bancorp, Inc. | 0,29 | -17,14 | 26,90 | -19,98 | 0,9891 | -0,0546 | |||
| OGS / ONE Gas, Inc. | 0,36 | -7,63 | 26,76 | -8,11 | 0,9838 | 0,0797 | |||
| PECO / Phillips Edison & Company, Inc. | 0,75 | -7,63 | 26,67 | -11,95 | 0,9804 | 0,0401 | |||
| NATL / NCR Atleos Corporation | 1,01 | -1,77 | 26,67 | -8,43 | 0,9803 | 0,0763 | |||
| GPK / Graphic Packaging Holding Company | 1,18 | 41,45 | 26,21 | 17,80 | 0,9637 | 0,2729 | |||
| SMA / SmartStop Self Storage REIT, Inc. | 0,72 | 26,17 | 0,9619 | 0,9619 | |||||
| LOPE / Grand Canyon Education, Inc. | 0,13 | -24,90 | 25,70 | -17,37 | 0,9449 | -0,0207 | |||
| UMBF / UMB Financial Corporation | 0,24 | -28,22 | 25,20 | -32,92 | 0,9265 | -0,2397 | |||
| TCBI / Texas Capital Bancshares, Inc. | 0,35 | -14,11 | 25,00 | -22,22 | 0,9192 | -0,0787 | |||
| AIN / Albany International Corp. | 0,38 | -7,63 | 24,86 | -20,30 | 0,9139 | -0,0544 | |||
| HAYW / Hayward Holdings, Inc. | 1,78 | -7,63 | 24,82 | -11,08 | 0,9126 | 0,0460 | |||
| EBC / Eastern Bankshares, Inc. | 1,59 | -7,63 | 23,80 | -22,55 | 0,8751 | -0,0790 | |||
| FTI / TechnipFMC plc | 0,76 | -7,63 | 23,77 | -2,27 | 0,8740 | 0,1189 | |||
| HXL / Hexcel Corporation | 0,45 | -7,63 | 23,67 | -22,91 | 0,8702 | -0,0830 | |||
| BKH / Black Hills Corporation | 0,40 | -7,63 | 23,62 | -11,73 | 0,8685 | 0,0377 | |||
| NJR / New Jersey Resources Corporation | 0,51 | -7,63 | 23,58 | -12,39 | 0,8669 | 0,0314 | |||
| US7587501039 / Regal-Beloit Corp. | 0,17 | 8,13 | 23,30 | 11,50 | 0,8565 | 0,2079 | |||
| TNET / TriNet Group, Inc. | 0,28 | -7,63 | 23,19 | 4,27 | 0,8525 | 0,1621 | |||
| SIGI / Selective Insurance Group, Inc. | 0,26 | -7,63 | 23,08 | -5,52 | 0,8484 | 0,0902 | |||
| CUZ / Cousins Properties Incorporated | 0,82 | -7,63 | 23,08 | -14,52 | 0,8484 | 0,0103 | |||
| VNOM / Viper Energy, Inc. | 0,58 | -12,99 | 22,92 | -25,84 | 0,8427 | -0,1168 | |||
| BRX / Brixmor Property Group Inc. | 0,90 | -7,63 | 22,84 | -16,06 | 0,8398 | -0,0050 | |||
| NVT / nVent Electric plc | 0,35 | -7,63 | 22,76 | 0,73 | 0,8368 | 0,1353 | |||
| DAN / Dana Incorporated | 1,35 | -26,02 | 22,50 | -17,26 | 0,8270 | -0,0170 | |||
| FCPT / Four Corners Property Trust, Inc. | 0,81 | 22,48 | 0,8263 | 0,8263 | |||||
| FLS / Flowserve Corporation | 0,45 | -7,63 | 22,26 | -16,24 | 0,8183 | -0,0067 | |||
| EFN / Element Fleet Management Corp. | 0,93 | -32,80 | 22,13 | -19,96 | 0,8137 | -0,0447 | |||
| TKR / The Timken Company | 0,32 | -1,58 | 22,10 | -16,78 | 0,8126 | -0,0119 | |||
| PR / Permian Resources Corporation | 1,75 | -7,63 | 22,09 | -17,34 | 0,8121 | -0,0175 | |||
| REXR / Rexford Industrial Realty, Inc. | 0,63 | 22,07 | 0,8115 | 0,8115 | |||||
| VC / Visteon Corporation | 0,26 | -7,63 | 21,95 | -10,08 | 0,8070 | 0,0492 | |||
| WTFC / Wintrust Financial Corporation | 0,18 | -26,99 | 21,81 | -29,96 | 0,8018 | -0,1649 | |||
| ACIW / ACI Worldwide, Inc. | 0,47 | -7,63 | 21,73 | -25,50 | 0,7990 | -0,1065 | |||
| MTDR / Matador Resources Company | 0,50 | -7,63 | 21,70 | -24,10 | 0,7977 | -0,0898 | |||
| NVST / Envista Holdings Corporation | 1,18 | -7,63 | 21,62 | -15,54 | 0,7948 | 0,0002 | |||
| LKQ / LKQ Corporation | 0,53 | -32,72 | 21,59 | -35,46 | 0,7936 | -0,2447 | |||
| IP / International Paper Company | 0,45 | -23,56 | 21,54 | -35,15 | 0,7920 | -0,2391 | |||
| AVNT / Avient Corporation | 0,60 | 2,55 | 21,53 | -13,37 | 0,7914 | 0,0200 | |||
| CVBF / CVB Financial Corp. | 1,14 | 6,96 | 21,37 | -0,57 | 0,7858 | 0,1184 | |||
| ESAB / ESAB Corporation | 0,17 | -7,63 | 21,18 | -9,34 | 0,7786 | 0,0534 | |||
| LNC / Lincoln National Corporation | 0,63 | -7,63 | 21,00 | -21,52 | 0,7721 | -0,0586 | |||
| PFSI / PennyMac Financial Services, Inc. | 0,22 | -7,63 | 20,92 | -14,45 | 0,7690 | 0,0100 | |||
| NSIT / Insight Enterprises, Inc. | 0,16 | -7,63 | 20,73 | -21,73 | 0,7622 | -0,0601 | |||
| SMPL / The Simply Good Foods Company | 0,59 | -7,63 | 20,48 | -15,56 | 0,7531 | -0,0000 | |||
| THRY / Thryv Holdings, Inc. | 1,52 | 21,88 | 20,23 | -5,97 | 0,7437 | 0,0758 | |||
| PX / P10, Inc. | 1,86 | -7,63 | 20,20 | -21,45 | 0,7426 | -0,0557 | |||
| KWR / Quaker Chemical Corporation | 0,18 | 20,45 | 19,79 | -6,05 | 0,7276 | 0,0737 | |||
| ASH / Ashland Inc. | 0,39 | -7,63 | 19,14 | -24,81 | 0,7037 | -0,0866 | |||
| HAS / Hasbro, Inc. | 0,29 | -24,78 | 19,13 | -22,93 | 0,7032 | -0,0673 | |||
| KBR / KBR, Inc. | 0,36 | 9,51 | 19,00 | 16,56 | 0,6984 | 0,1925 | |||
| TRS / TriMas Corporation | 0,72 | -7,63 | 18,95 | 18,88 | 0,6968 | 0,2018 | |||
| SARO / StandardAero, Inc. | 0,64 | -7,63 | 18,63 | -4,04 | 0,6849 | 0,0822 | |||
| BRSL / Brightstar Lottery PLC | 1,24 | -7,63 | 18,26 | -23,37 | 0,6713 | -0,0684 | |||
| NXZ / Nexstar Media Group, Inc. | 0,11 | 18,20 | 0,6690 | 0,6690 | |||||
| KMPR / Kemper Corporation | 0,28 | 32,55 | 17,86 | 25,01 | 0,6566 | 0,2131 | |||
| BELFB / Bel Fuse Inc. | 0,24 | 17,62 | 0,6476 | 0,6476 | |||||
| UE / Urban Edge Properties | 0,96 | -7,63 | 17,50 | -18,57 | 0,6432 | -0,0238 | |||
| FORM / FormFactor, Inc. | 0,58 | 37,71 | 17,42 | 23,45 | 0,6404 | 0,2023 | |||
| PLXS / Plexus Corp. | 0,13 | -19,40 | 17,32 | -20,40 | 0,6369 | -0,0388 | |||
| AUB / Atlantic Union Bankshares Corporation | 0,57 | 17,19 | 0,6318 | 0,6318 | |||||
| UA / Under Armour, Inc. | 2,72 | -7,63 | 17,16 | -8,36 | 0,6309 | 0,0496 | |||
| PATK / Patrick Industries, Inc. | 0,20 | -7,63 | 17,06 | -12,46 | 0,6272 | 0,0222 | |||
| XPRO / Expro Group Holdings N.V. | 2,03 | 51,74 | 16,91 | 6,19 | 0,6216 | 0,1273 | |||
| AXTA / Axalta Coating Systems Ltd. | 0,55 | -8,49 | 16,89 | -22,16 | 0,6210 | -0,0527 | |||
| ECG / Everus Construction Group, Inc. | 0,29 | 51,97 | 16,79 | 111,56 | 0,6172 | 0,3708 | |||
| MIR / Mirion Technologies, Inc. | 0,88 | 16,79 | 0,6172 | 0,6172 | |||||
| ATGE / Adtalem Global Education Inc. | 0,13 | 16,76 | 0,6160 | 0,6160 | |||||
| DEI / Douglas Emmett, Inc. | 1,12 | -7,63 | 15,96 | -24,03 | 0,5866 | -0,0654 | |||
| CHEF / The Chefs' Warehouse, Inc. | 0,25 | 15,74 | 0,5788 | 0,5788 | |||||
| NWL / Newell Brands Inc. | 2,97 | 11,63 | 15,74 | -7,85 | 0,5786 | 0,0484 | |||
| HRI / Herc Holdings Inc. | 0,12 | -7,63 | 15,33 | -20,17 | 0,5636 | -0,0326 | |||
| TWO / Two Harbors Investment Corp. | 1,45 | -7,63 | 15,31 | -31,02 | 0,5628 | -0,1261 | |||
| BANC / Banc of California, Inc. | 1,11 | -32,59 | 15,22 | -37,81 | 0,5597 | -0,2002 | |||
| NCNO / nCino, Inc. | 0,58 | -7,63 | 15,21 | -22,41 | 0,5591 | -0,0494 | |||
| BC / Brunswick Corporation | 0,28 | -7,63 | 14,10 | -23,16 | 0,5183 | -0,0513 | |||
| STC / Stewart Information Services Corporation | 0,23 | -7,63 | 14,03 | -21,72 | 0,5157 | -0,0406 | |||
| TOL / Toll Brothers, Inc. | 0,13 | -7,63 | 13,97 | -13,75 | 0,5137 | 0,0108 | |||
| 2IY / Cushman & Wakefield plc | 1,38 | -7,63 | 13,87 | -22,08 | 0,5097 | -0,0427 | |||
| VRNT / Verint Systems Inc. | 0,73 | -7,63 | 12,78 | -28,22 | 0,4699 | -0,0829 | |||
| PTVLF / Pet Valu Holdings Ltd. | 0,55 | 12,29 | 0,4519 | 0,4519 | |||||
| MDU / MDU Resources Group, Inc. | 0,70 | -7,63 | 12,12 | -7,95 | 0,4454 | 0,0368 | |||
| UTZ / Utz Brands, Inc. | 0,91 | 12,02 | 0,4418 | 0,4418 | |||||
| COLM / Columbia Sportswear Company | 0,18 | 11,62 | 0,4273 | 0,4273 | |||||
| KAI / Kadant Inc. | 0,04 | 11,22 | 0,4123 | 0,4123 | |||||
| MGMXX / JPMorgan Trust II - JPMorgan U.S. Government Money Market Fund IM | 11,20 | -49,73 | 11,20 | -49,73 | 0,4117 | -0,2798 | |||
| CC / The Chemours Company | 1,08 | -7,63 | 10,99 | -37,41 | 0,4040 | -0,1411 | |||
| RXO / RXO, Inc. | 0,70 | -7,63 | 10,84 | -29,93 | 0,3986 | -0,0817 | |||
| EHC / Encompass Health Corporation | 0,07 | -68,76 | 8,46 | -62,29 | 0,3110 | -0,3853 | |||
| ICLR / ICON Public Limited Company | 0,06 | -7,63 | 8,36 | -36,68 | 0,3072 | -0,1024 | |||
| AHL.PRF / Aspen Insurance Holdings Limited - Preferred Security | 0,24 | 8,15 | 0,2995 | 0,2995 | |||||
| OGN / Organon & Co. | 0,85 | 3,52 | 7,88 | -35,99 | 0,2895 | -0,0924 | |||
| SDHC / Smith Douglas Homes Corp. | 0,40 | 23,92 | 7,48 | 9,93 | 0,2751 | 0,0638 | |||
| NSA / National Storage Affiliates Trust | 0,22 | -68,08 | 7,41 | -71,57 | 0,2724 | -0,5366 | |||
| HUT / Hut 8 Corp. | 0,47 | -7,63 | 7,24 | -4,38 | 0,2663 | 0,0311 | |||
| LNTH / Lantheus Holdings, Inc. | 0,08 | 5,81 | 0,2136 | 0,2136 | |||||
| ASTS / AST SpaceMobile, Inc. | 0,22 | 7,15 | 5,15 | -8,81 | 0,1894 | 0,0140 | |||
| DAVA / Endava plc - Depositary Receipt (Common Stock) | 0,20 | -54,16 | 3,12 | -70,41 | 0,1149 | -0,2129 | |||
| TTAN / ServiceTitan, Inc. | 0,03 | -38,47 | 3,05 | -28,30 | 0,1122 | -0,0199 | |||
| ZUMZ / Zumiez Inc. | 0,09 | -87,27 | 1,10 | -88,86 | 0,0404 | -0,2655 | |||
| KRMN / Karman Holdings Inc. | 0,00 | -100,00 | 0,00 | -100,00 | -0,3464 |