Statistiques de base
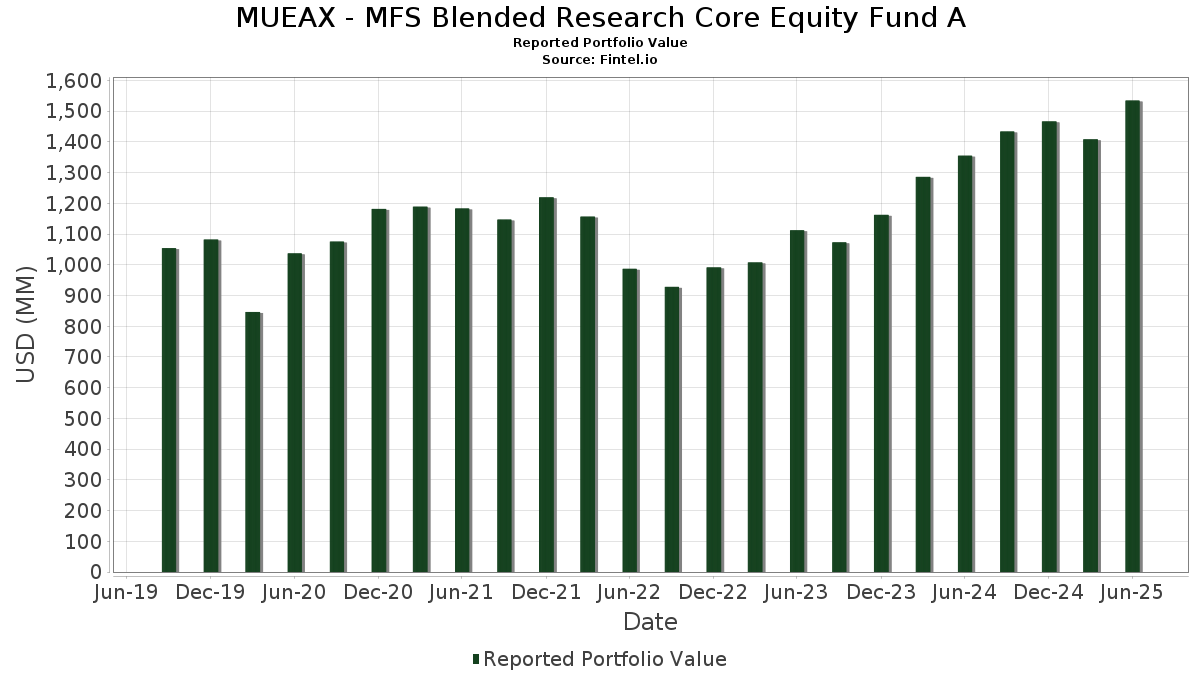
| Valeur du portefeuille | $ 1 534 577 520 |
| Positions actuelles | 109 |
Dernières positions, performances, ASG (à partir des dépôts 13F, 13D)
MUEAX - MFS Blended Research Core Equity Fund A a déclaré un total de 109 positions dans ses derniers dépôts auprès de la SEC. La valeur la plus récente du portefeuille est calculée à 1 534 577 520 USD. Les actifs sous gestion réels (ASG) sont cette valeur plus les liquidités (qui ne sont pas divulguées). Les principales positions de MUEAX - MFS Blended Research Core Equity Fund A sont NVIDIA Corporation (US:NVDA) , Microsoft Corporation (US:MSFT) , Apple Inc. (US:AAPL) , Amazon.com, Inc. (US:AMZN) , and Meta Platforms, Inc. (US:META) . Les nouvelles positions de MUEAX - MFS Blended Research Core Equity Fund A incluent Deere & Company (US:DE) , CRH plc (US:CRH) , Roblox Corporation (US:RBLX) , Ventas, Inc. (US:VTR) , and Palantir Technologies Inc. (US:PLTR) .
Meilleures augmentations ce trimestre
Nous utilisons la variation de l'allocation du portefeuille car il s'agit de l'indicateur le plus significatif. Les changements peuvent être dus à des transactions ou à des variations de prix des actions.
| Titre | Actions (en millions) |
Valeur ($ en millions) |
% du portefeuille | ΔPortefeuille % |
|---|---|---|---|---|
| 0,78 | 123,67 | 8,0550 | 1,9506 | |
| 0,02 | 27,01 | 1,7593 | 1,4552 | |
| 0,21 | 106,06 | 6,9075 | 0,9132 | |
| 0,09 | 25,89 | 1,6860 | 0,8234 | |
| 0,02 | 8,53 | 0,5556 | 0,5556 | |
| 0,05 | 9,89 | 0,6444 | 0,5269 | |
| 0,25 | 21,43 | 1,3955 | 0,5074 | |
| 0,02 | 12,50 | 0,8140 | 0,4157 | |
| 0,03 | 21,08 | 1,3729 | 0,3917 | |
| 0,33 | 71,82 | 4,6777 | 0,3563 |
Principales baisses ce trimestre
Nous utilisons la variation de l'allocation du portefeuille car il s'agit de l'indicateur le plus significatif. Les changements peuvent être dus à des transactions ou à des variations de prix des actions.
| Titre | Actions (en millions) |
Valeur ($ en millions) |
% du portefeuille | ΔPortefeuille % |
|---|---|---|---|---|
| 0,41 | 84,35 | 5,4941 | -1,0771 | |
| 0,06 | 3,17 | 0,2062 | -0,8705 | |
| 0,16 | 11,20 | 0,7297 | -0,5851 | |
| 0,14 | 25,24 | 1,6437 | -0,5528 | |
| 0,06 | 5,54 | 0,3605 | -0,4785 | |
| 0,16 | 29,35 | 1,9116 | -0,4721 | |
| 0,12 | 14,91 | 0,9714 | -0,4564 | |
| 0,20 | 6,98 | 0,4548 | -0,4079 | |
| 0,11 | 17,62 | 1,1476 | -0,3407 | |
| 0,17 | 25,90 | 1,6869 | -0,3364 |
Déclarations 13F et dépôts de fonds
Ce formulaire a été déposé le 2025-08-25 pour la période de déclaration 2025-06-30. Cliquez sur l'icône du lien pour voir l'historique complet des transactions.
Mettre à niveau pour débloquer les données premium et exporter vers Excel ![]() .
.
| Titre | Type | Prix moyen de l'action | Actions (en millions) |
ΔActions (%) |
ΔActions (%) |
Valeur ($ en millions) |
Portefeuille (%) |
ΔPortefeuille (%) |
|
|---|---|---|---|---|---|---|---|---|---|
| NVDA / NVIDIA Corporation | 0,78 | -1,47 | 123,67 | 43,64 | 8,0550 | 1,9506 | |||
| MSFT / Microsoft Corporation | 0,21 | -5,33 | 106,06 | 25,44 | 6,9075 | 0,9132 | |||
| AAPL / Apple Inc. | 0,41 | -1,47 | 84,35 | -8,99 | 5,4941 | -1,0771 | |||
| AMZN / Amazon.com, Inc. | 0,33 | 2,18 | 71,82 | 17,83 | 4,6777 | 0,3563 | |||
| META / Meta Platforms, Inc. | 0,09 | -14,43 | 63,18 | 9,58 | 4,1148 | 0,0274 | |||
| V / Visa Inc. | 0,10 | -1,47 | 34,56 | -0,17 | 2,2507 | -0,2036 | |||
| ABBV / AbbVie Inc. | 0,16 | -1,47 | 29,35 | -12,71 | 1,9116 | -0,4721 | |||
| NFLX / Netflix, Inc. | 0,02 | 338,50 | 27,01 | 529,77 | 1,7593 | 1,4552 | |||
| JNJ / Johnson & Johnson | 0,17 | -1,47 | 25,90 | -9,24 | 1,6869 | -0,3364 | |||
| AVGO / Broadcom Inc. | 0,09 | 29,23 | 25,89 | 112,77 | 1,6860 | 0,8234 | |||
| GOOGL / Alphabet Inc. | 0,14 | -28,52 | 25,24 | -18,54 | 1,6437 | -0,5528 | |||
| LRCX / Lam Research Corporation | 0,25 | -1,47 | 24,37 | 31,93 | 1,5875 | 0,2777 | |||
| CI / The Cigna Group | 0,07 | -1,47 | 23,85 | -0,99 | 1,5533 | -0,1545 | |||
| AMP / Ameriprise Financial, Inc. | 0,04 | -1,46 | 23,52 | 8,64 | 1,5320 | -0,0031 | |||
| NTRS / Northern Trust Corporation | 0,19 | -1,47 | 23,52 | 26,64 | 1,5319 | 0,2152 | |||
| SPOT / Spotify Technology S.A. | 0,03 | -1,47 | 22,27 | 37,47 | 1,4504 | 0,3018 | |||
| CRM / Salesforce, Inc. | 0,08 | -1,47 | 21,57 | 0,12 | 1,4048 | -0,1225 | |||
| C / Citigroup Inc. | 0,25 | 42,66 | 21,43 | 71,06 | 1,3955 | 0,5074 | |||
| WAB / Westinghouse Air Brake Technologies Corporation | 0,10 | -1,47 | 21,09 | 13,75 | 1,3734 | 0,0591 | |||
| MCK / McKesson Corporation | 0,03 | 39,88 | 21,08 | 52,31 | 1,3729 | 0,3917 | |||
| VRSK / Verisk Analytics, Inc. | 0,07 | -1,47 | 20,71 | 3,13 | 1,3486 | -0,0749 | |||
| ORLY / O'Reilly Automotive, Inc. | 0,22 | 1 564,63 | 20,12 | 4,73 | 1,3104 | -0,0516 | |||
| MO / Altria Group, Inc. | 0,33 | -8,71 | 19,39 | -10,83 | 1,2628 | -0,2786 | |||
| AXP / American Express Company | 0,06 | -9,86 | 18,81 | 6,86 | 1,2251 | -0,0228 | |||
| BKNG / Booking Holdings Inc. | 0,00 | -1,50 | 18,20 | 23,78 | 1,1851 | 0,1429 | |||
| WFC / Wells Fargo & Company | 0,22 | -1,47 | 17,69 | 9,97 | 1,1518 | 0,0117 | |||
| QCOM / QUALCOMM Incorporated | 0,11 | -19,04 | 17,62 | -16,06 | 1,1476 | -0,3407 | |||
| GOOG / Alphabet Inc. | 0,10 | -18,70 | 17,17 | -7,68 | 1,1181 | -0,2003 | |||
| FTI / TechnipFMC plc | 0,48 | -1,47 | 16,63 | 7,08 | 1,0831 | -0,0179 | |||
| NOW / ServiceNow, Inc. | 0,02 | -1,46 | 15,76 | 27,25 | 1,0266 | 0,1484 | |||
| AMAT / Applied Materials, Inc. | 0,08 | -1,46 | 15,15 | 24,31 | 0,9869 | 0,1227 | |||
| KMB / Kimberly-Clark Corporation | 0,12 | -18,30 | 14,91 | -25,94 | 0,9714 | -0,4564 | |||
| PSX / Phillips 66 | 0,12 | -1,47 | 14,46 | -4,81 | 0,9420 | -0,1351 | |||
| PFE / Pfizer Inc. | 0,59 | -1,47 | 14,39 | -5,75 | 0,9371 | -0,1451 | |||
| PCG / PG&E Corporation | 0,96 | 72,12 | 13,35 | 39,66 | 0,8698 | 0,1918 | |||
| ARMK / Aramark | 0,31 | -1,47 | 12,90 | 19,51 | 0,8403 | 0,0749 | |||
| BLDR / Builders FirstSource, Inc. | 0,11 | -1,47 | 12,69 | -7,97 | 0,8265 | -0,1511 | |||
| MA / Mastercard Incorporated | 0,02 | 116,99 | 12,50 | 122,46 | 0,8140 | 0,4157 | |||
| EIX / Edison International | 0,24 | 114,67 | 12,49 | 88,01 | 0,8137 | 0,3426 | |||
| GWRE / Guidewire Software, Inc. | 0,05 | -1,46 | 12,47 | 23,83 | 0,8120 | 0,0982 | |||
| VRTX / Vertex Pharmaceuticals Incorporated | 0,03 | -1,46 | 11,89 | -9,51 | 0,7746 | -0,1573 | |||
| TSLA / Tesla, Inc. | 0,04 | -36,73 | 11,80 | -22,46 | 0,7683 | -0,3102 | |||
| BRK.B / Berkshire Hathaway Inc. | 0,02 | -9,46 | 11,76 | -17,41 | 0,7657 | -0,2436 | |||
| CL / Colgate-Palmolive Company | 0,13 | -1,47 | 11,43 | -4,41 | 0,7446 | -0,1033 | |||
| RPM / RPM International Inc. | 0,10 | -1,47 | 11,27 | -6,44 | 0,7342 | -0,1200 | |||
| LDOS / Leidos Holdings, Inc. | 0,07 | -1,47 | 11,24 | 15,19 | 0,7323 | 0,0403 | |||
| NEE / NextEra Energy, Inc. | 0,16 | -38,31 | 11,20 | -39,59 | 0,7297 | -0,5851 | |||
| GEV / GE Vernova Inc. | 0,02 | -1,46 | 11,05 | 70,81 | 0,7196 | 0,2610 | |||
| GE / General Electric Company | 0,04 | -15,08 | 11,03 | 9,20 | 0,7183 | 0,0023 | |||
| TE Connectivity PLC / EC (IE000IVNQZ81) | 0,07 | -1,47 | 11,02 | 17,61 | 0,7176 | 0,0534 | |||
| EOG / EOG Resources, Inc. | 0,09 | -1,46 | 10,19 | -8,10 | 0,6640 | -0,1225 | |||
| BPOP / Popular, Inc. | 0,09 | -13,12 | 10,19 | 3,66 | 0,6637 | -0,0333 | |||
| BSX / Boston Scientific Corporation | 0,09 | -1,46 | 10,12 | 4,91 | 0,6594 | -0,0248 | |||
| WPC / W. P. Carey Inc. | 0,16 | -22,36 | 10,11 | -23,26 | 0,6586 | -0,2756 | |||
| PM / Philip Morris International Inc. | 0,05 | 420,42 | 9,89 | 497,40 | 0,6444 | 0,5269 | |||
| US55291X1090 / MFS Institutional Money Market Portfolio | 9,27 | -17,70 | 9,27 | -17,70 | 0,6037 | -0,1948 | |||
| DE / Deere & Company | 0,02 | 8,53 | 0,5556 | 0,5556 | |||||
| EQH / Equitable Holdings, Inc. | 0,15 | 161,58 | 8,46 | 181,72 | 0,5511 | 0,3381 | |||
| JLL / Jones Lang LaSalle Incorporated | 0,03 | -29,96 | 8,20 | -27,75 | 0,5338 | -0,2703 | |||
| CUZ / Cousins Properties Incorporated | 0,27 | 55,92 | 8,02 | 58,73 | 0,5221 | 0,1641 | |||
| TGT / Target Corporation | 0,08 | -27,17 | 7,54 | -31,16 | 0,4909 | -0,2853 | |||
| MDT / Medtronic plc | 0,08 | -1,47 | 7,36 | -4,42 | 0,4795 | -0,0666 | |||
| HIG / The Hartford Insurance Group, Inc. | 0,06 | -1,47 | 7,34 | 1,03 | 0,4778 | -0,0370 | |||
| GDDY / GoDaddy Inc. | 0,04 | -1,47 | 7,17 | -1,52 | 0,4672 | -0,0492 | |||
| CNH / CNH Industrial N.V. | 0,55 | -1,47 | 7,15 | 3,99 | 0,4655 | -0,0218 | |||
| ETN / Eaton Corporation plc | 0,02 | -1,46 | 7,13 | 29,40 | 0,4645 | 0,0738 | |||
| US21871X1090 / Corebridge Financial, Inc. | 0,20 | -48,97 | 6,98 | -42,61 | 0,4548 | -0,4079 | |||
| JPM / JPMorgan Chase & Co. | 0,02 | -1,46 | 6,38 | 16,45 | 0,4154 | 0,0271 | |||
| HD / The Home Depot, Inc. | 0,02 | -1,47 | 6,29 | -1,43 | 0,4096 | -0,0427 | |||
| OKTA / Okta, Inc. | 0,06 | 183,31 | 6,01 | 169,28 | 0,3916 | 0,2333 | |||
| MDLZ / Mondelez International, Inc. | 0,09 | -1,46 | 5,78 | -2,07 | 0,3764 | -0,0419 | |||
| COP / ConocoPhillips | 0,06 | -45,26 | 5,54 | -53,22 | 0,3605 | -0,4785 | |||
| RJF / Raymond James Financial, Inc. | 0,04 | -29,89 | 5,52 | -22,60 | 0,3597 | -0,1461 | |||
| CSX / CSX Corporation | 0,17 | -1,47 | 5,47 | 9,23 | 0,3560 | 0,0013 | |||
| ZM / Zoom Communications Inc. | 0,06 | 251,58 | 5,03 | 271,79 | 0,3279 | 0,2319 | |||
| EMN / Eastman Chemical Company | 0,07 | -1,47 | 5,01 | -16,50 | 0,3263 | -0,0991 | |||
| ESS / Essex Property Trust, Inc. | 0,02 | -30,99 | 4,92 | -36,21 | 0,3205 | -0,2264 | |||
| CRH / CRH plc | 0,05 | 4,53 | 0,2952 | 0,2952 | |||||
| TMUS / T-Mobile US, Inc. | 0,02 | -1,47 | 4,40 | -11,98 | 0,2867 | -0,0678 | |||
| AEE / Ameren Corporation | 0,05 | -1,46 | 4,32 | -5,74 | 0,2815 | -0,0436 | |||
| VFC / V.F. Corporation | 0,35 | -22,01 | 4,15 | -40,95 | 0,2702 | -0,2279 | |||
| HUM / Humana Inc. | 0,02 | 182,37 | 3,85 | 161,02 | 0,2508 | 0,1461 | |||
| DBX / Dropbox, Inc. | 0,13 | -1,47 | 3,66 | 5,51 | 0,2384 | -0,0076 | |||
| MAS / Masco Corporation | 0,06 | -37,47 | 3,59 | -42,12 | 0,2340 | -0,2061 | |||
| Aptiv PLC / EC (JE00BTDN8H13) | 0,05 | -1,47 | 3,56 | 12,97 | 0,2321 | 0,0085 | |||
| APH / Amphenol Corporation | 0,03 | -1,47 | 3,34 | 48,36 | 0,2177 | 0,0579 | |||
| SYF / Synchrony Financial | 0,05 | -1,46 | 3,28 | 24,21 | 0,2135 | 0,0264 | |||
| GIS / General Mills, Inc. | 0,06 | -75,95 | 3,17 | -79,16 | 0,2062 | -0,8705 | |||
| UAL / United Airlines Holdings, Inc. | 0,04 | -28,31 | 3,14 | -17,33 | 0,2048 | -0,0648 | |||
| RBLX / Roblox Corporation | 0,03 | 3,08 | 0,2009 | 0,2009 | |||||
| DG / Dollar General Corporation | 0,03 | -11,67 | 2,98 | -50,14 | 0,1940 | -0,3080 | |||
| MET / MetLife, Inc. | 0,04 | -1,47 | 2,86 | -1,31 | 0,1865 | -0,0192 | |||
| PFG / Principal Financial Group, Inc. | 0,03 | -1,46 | 2,76 | -7,23 | 0,1796 | -0,0311 | |||
| MSI / Motorola Solutions, Inc. | 0,01 | -35,37 | 2,72 | -37,92 | 0,1771 | -0,1335 | |||
| VTR / Ventas, Inc. | 0,04 | 2,44 | 0,1586 | 0,1586 | |||||
| LLY / Eli Lilly and Company | 0,00 | -37,88 | 2,43 | -41,37 | 0,1584 | -0,1356 | |||
| NRG / NRG Energy, Inc. | 0,01 | -1,47 | 2,34 | 65,82 | 0,1526 | 0,0524 | |||
| INGR / Ingredion Incorporated | 0,01 | -71,57 | 2,02 | -49,07 | 0,1319 | -0,2375 | |||
| PLTR / Palantir Technologies Inc. | 0,01 | 1,95 | 0,1272 | 0,1272 | |||||
| CB / Chubb Limited | 0,01 | -1,47 | 1,69 | -5,48 | 0,1101 | -0,0167 | |||
| MHK / Mohawk Industries, Inc. | 0,02 | -1,46 | 1,68 | -9,53 | 0,1094 | -0,0222 | |||
| EAT / Brinker International, Inc. | 0,01 | -1,46 | 1,63 | 19,18 | 0,1065 | 0,0093 | |||
| EPRT / Essential Properties Realty Trust, Inc. | 0,04 | -1,47 | 1,40 | -3,65 | 0,0912 | -0,0119 | |||
| SPG / Simon Property Group, Inc. | 0,01 | -1,46 | 1,38 | -4,62 | 0,0902 | -0,0127 | |||
| EG / Everest Group, Ltd. | 0,00 | -1,48 | 1,31 | -7,85 | 0,0856 | -0,0155 | |||
| XOM / Exxon Mobil Corporation | 0,01 | -1,47 | 1,18 | -10,70 | 0,0767 | -0,0168 | |||
| OGN / Organon & Co. | 0,11 | -1,47 | 1,11 | -35,92 | 0,0725 | -0,0507 | |||
| IQV / IQVIA Holdings Inc. | 0,01 | -1,47 | 1,11 | -11,93 | 0,0721 | -0,0170 | |||
| PEP / PepsiCo, Inc. | 0,01 | -1,47 | 1,06 | -13,26 | 0,0691 | -0,0176 |