Statistiques de base
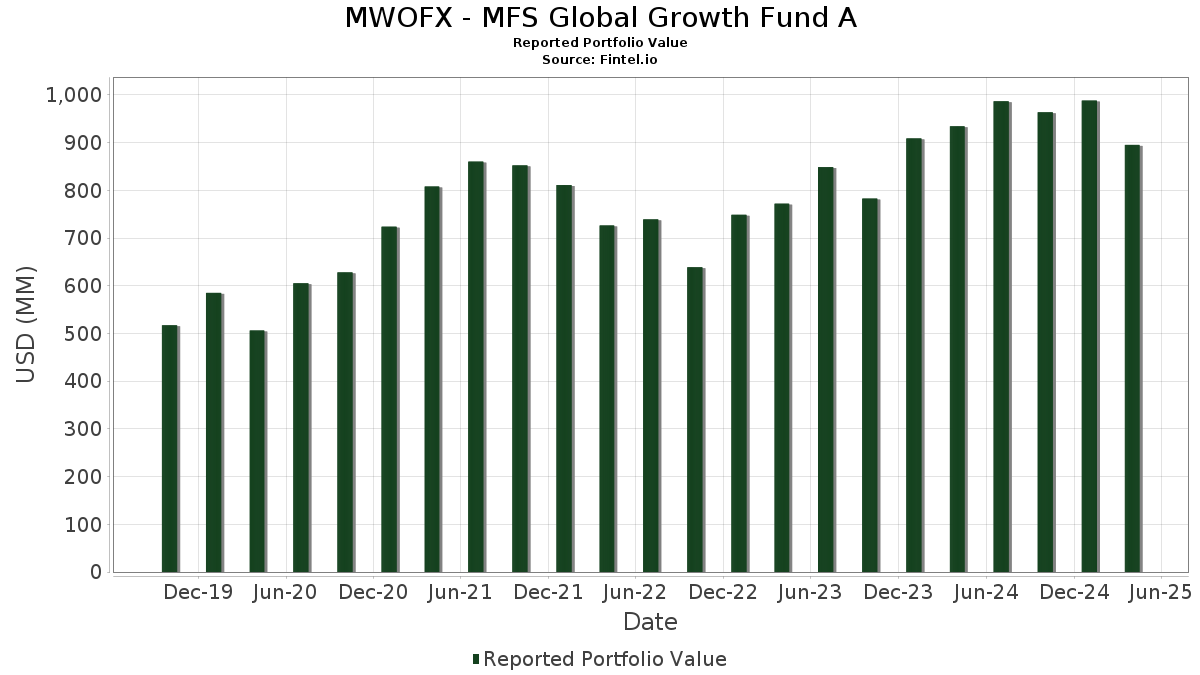
| Valeur du portefeuille | $ 895 212 291 |
| Positions actuelles | 74 |
Dernières positions, performances, ASG (à partir des dépôts 13F, 13D)
MWOFX - MFS Global Growth Fund A a déclaré un total de 74 positions dans ses derniers dépôts auprès de la SEC. La valeur la plus récente du portefeuille est calculée à 895 212 291 USD. Les actifs sous gestion réels (ASG) sont cette valeur plus les liquidités (qui ne sont pas divulguées). Les principales positions de MWOFX - MFS Global Growth Fund A sont Microsoft Corporation (US:MSFT) , Visa Inc. (US:V) , Taiwan Semiconductor Manufacturing Company Limited - Depositary Receipt (Common Stock) (US:TSM) , Tencent Holdings Limited (DE:NNND) , and HDFC Bank Ltd (IN:HDFCB) . Les nouvelles positions de MWOFX - MFS Global Growth Fund A incluent CME Group Inc. (US:CME) , Pool Corporation (US:POOL) , .
Meilleures augmentations ce trimestre
Nous utilisons la variation de l'allocation du portefeuille car il s'agit de l'indicateur le plus significatif. Les changements peuvent être dus à des transactions ou à des variations de prix des actions.
| Titre | Actions (en millions) |
Valeur ($ en millions) |
% du portefeuille | ΔPortefeuille % |
|---|---|---|---|---|
| 0,03 | 7,68 | 0,8583 | 0,8583 | |
| 0,08 | 16,63 | 1,8575 | 0,6380 | |
| 0,02 | 5,62 | 0,6276 | 0,6276 | |
| 0,24 | 19,54 | 2,1828 | 0,5891 | |
| 0,40 | 24,63 | 2,7515 | 0,5562 | |
| 0,04 | 15,91 | 1,7775 | 0,5239 | |
| 1,01 | 23,05 | 2,5744 | 0,5180 | |
| 0,09 | 19,69 | 2,1997 | 0,4856 | |
| 0,08 | 17,31 | 1,9336 | 0,4612 | |
| 0,07 | 14,95 | 1,6695 | 0,3805 |
Principales baisses ce trimestre
Nous utilisons la variation de l'allocation du portefeuille car il s'agit de l'indicateur le plus significatif. Les changements peuvent être dus à des transactions ou à des variations de prix des actions.
| Titre | Actions (en millions) |
Valeur ($ en millions) |
% du portefeuille | ΔPortefeuille % |
|---|---|---|---|---|
| 0,02 | 2,16 | 0,2411 | -0,8150 | |
| 0,07 | 10,74 | 1,1993 | -0,7316 | |
| 0,13 | 7,18 | 0,8023 | -0,6951 | |
| 0,01 | 5,14 | 0,5744 | -0,5931 | |
| 0,17 | 18,86 | 2,1072 | -0,5571 | |
| 0,09 | 32,65 | 3,6478 | -0,5496 | |
| 0,15 | 15,68 | 1,7511 | -0,5373 | |
| 0,08 | 22,82 | 2,5494 | -0,4951 | |
| 0,08 | 8,65 | 0,9661 | -0,4942 | |
| 0,16 | 26,44 | 2,9540 | -0,4885 |
Déclarations 13F et dépôts de fonds
Ce formulaire a été déposé le 2025-06-26 pour la période de déclaration 2025-04-30. Cliquez sur l'icône du lien pour voir l'historique complet des transactions.
Mettre à niveau pour débloquer les données premium et exporter vers Excel ![]() .
.
| Titre | Type | Prix moyen de l'action | Actions (en millions) |
ΔActions (%) |
ΔActions (%) |
Valeur ($ en millions) |
Portefeuille (%) |
ΔPortefeuille (%) |
|
|---|---|---|---|---|---|---|---|---|---|
| MSFT / Microsoft Corporation | 0,14 | -2,44 | 56,47 | -7,10 | 6,3083 | 0,1607 | |||
| V / Visa Inc. | 0,09 | -22,16 | 32,65 | -21,32 | 3,6478 | -0,5496 | |||
| TSM / Taiwan Semiconductor Manufacturing Company Limited - Depositary Receipt (Common Stock) | 0,16 | -2,44 | 26,44 | -22,31 | 2,9540 | -0,4885 | |||
| NNND / Tencent Holdings Limited | 0,40 | -2,82 | 24,63 | 13,47 | 2,7515 | 0,5562 | |||
| HDFCB / HDFC Bank Ltd | 1,01 | -2,44 | 23,05 | 13,34 | 2,5744 | 0,5180 | |||
| ACN / Accenture plc | 0,08 | -2,44 | 22,82 | -24,19 | 2,5494 | -0,4951 | |||
| CRM / Salesforce, Inc. | 0,08 | 18,52 | 21,19 | -6,80 | 2,3669 | 0,0677 | |||
| STE / STERIS plc | 0,09 | 14,07 | 19,69 | 16,19 | 2,1997 | 0,4856 | |||
| TRU / TransUnion | 0,24 | 48,35 | 19,54 | 24,00 | 2,1828 | 0,5891 | |||
| AAPL / Apple Inc. | 0,09 | -2,45 | 19,11 | -12,16 | 2,1353 | -0,0655 | |||
| NVDA / NVIDIA Corporation | 0,17 | -21,07 | 18,86 | -28,40 | 2,1072 | -0,5571 | |||
| CP / Canadian Pacific Kansas City Limited | 0,26 | -2,44 | 18,53 | -11,18 | 2,0704 | -0,0400 | |||
| CMS / CMS Energy Corporation | 0,25 | -2,44 | 18,49 | 8,86 | 2,0659 | 0,3478 | |||
| CHD / Church & Dwight Co., Inc. | 0,18 | -2,44 | 18,22 | -8,15 | 2,0348 | 0,0290 | |||
| AMT / American Tower Corporation | 0,08 | -2,44 | 17,31 | 18,90 | 1,9336 | 0,4612 | |||
| 600519 / Kweichow Moutai Co., Ltd. | 0,08 | 28,68 | 16,63 | 37,89 | 1,8575 | 0,6380 | |||
| SBGSY / Schneider Electric S.E. - Depositary Receipt (Common Stock) | 0,07 | 10,08 | 16,04 | 2,00 | 1,7920 | 0,2015 | |||
| HUBB / Hubbell Incorporated | 0,04 | 49,52 | 15,91 | 28,37 | 1,7775 | 0,5239 | |||
| A / Agilent Technologies, Inc. | 0,15 | -2,44 | 15,68 | -30,72 | 1,7511 | -0,5373 | |||
| AON / Aon plc | 0,04 | -18,89 | 15,65 | -22,40 | 1,7478 | -0,2913 | |||
| APH / Amphenol Corporation | 0,20 | -2,44 | 15,50 | 6,06 | 1,7313 | 0,2534 | |||
| ETN / Eaton Corporation plc | 0,05 | -2,44 | 14,98 | -12,03 | 1,6737 | -0,0487 | |||
| DHR / Danaher Corporation | 0,07 | 31,03 | 14,95 | 17,26 | 1,6695 | 0,3805 | |||
| GIB / CGI Inc. | 0,13 | -2,44 | 13,33 | -12,25 | 1,4888 | -0,0473 | |||
| MC / LVMH Moët Hennessy - Louis Vuitton, Société Européenne | 0,02 | -2,44 | 13,24 | -25,16 | 1,4790 | -0,3102 | |||
| BDX / Becton, Dickinson and Company | 0,06 | -2,44 | 12,46 | -18,41 | 1,3921 | -0,1525 | |||
| BAP / Credicorp Ltd. | 0,06 | -2,44 | 12,41 | 7,72 | 1,3869 | 0,2213 | |||
| FI / Fiserv, Inc. | 0,07 | -2,45 | 12,25 | -16,66 | 1,3688 | -0,1181 | |||
| PEP / PepsiCo, Inc. | 0,09 | 23,80 | 12,17 | 11,39 | 1,3599 | 0,2545 | |||
| DKILF / Daikin Industries,Ltd. | 0,10 | -2,43 | 11,91 | -5,63 | 1,3304 | 0,0542 | |||
| MCO / Moody's Corporation | 0,02 | -2,44 | 11,24 | -11,49 | 1,2561 | -0,0287 | |||
| CAP / Capgemini SE | 0,07 | -0,94 | 10,90 | -13,54 | 1,2173 | -0,0574 | |||
| GOOGL / Alphabet Inc. | 0,07 | -27,76 | 10,74 | -43,77 | 1,1993 | -0,7316 | |||
| MKC / McCormick & Company, Incorporated | 0,14 | -2,44 | 10,68 | -3,16 | 1,1925 | 0,0776 | |||
| HLT / Hilton Worldwide Holdings Inc. | 0,05 | 28,92 | 10,34 | 13,52 | 1,1554 | 0,2339 | |||
| WTKWY / Wolters Kluwer N.V. - Depositary Receipt (Common Stock) | 0,06 | -2,45 | 10,20 | -5,25 | 1,1393 | 0,0507 | |||
| MTD / Mettler-Toledo International Inc. | 0,01 | -2,45 | 9,98 | -23,46 | 1,1147 | -0,2038 | |||
| OBL / OBIC Co.,Ltd. | 0,28 | -2,43 | 9,81 | 14,37 | 1,0958 | 0,2284 | |||
| OTIS / Otis Worldwide Corporation | 0,10 | -2,44 | 9,68 | -1,58 | 1,0811 | 0,0867 | |||
| ROST / Ross Stores, Inc. | 0,07 | -2,44 | 9,57 | -9,93 | 1,0688 | -0,0056 | |||
| DIS / The Walt Disney Company | 0,10 | -2,44 | 9,51 | -21,52 | 1,0621 | -0,1632 | |||
| SHW / The Sherwin-Williams Company | 0,03 | -2,44 | 9,50 | -3,87 | 1,0609 | 0,0617 | |||
| SCHW / The Charles Schwab Corporation | 0,11 | -2,44 | 9,06 | -3,99 | 1,0122 | 0,0576 | |||
| TJX / The TJX Companies, Inc. | 0,07 | -2,44 | 9,02 | 0,59 | 1,0075 | 0,1008 | |||
| CLNX / Cellnex Telecom, S.A. | 0,22 | -2,44 | 8,91 | 18,08 | 0,9950 | 0,2320 | |||
| BAM / Brookfield Asset Management Ltd. | 0,17 | -2,44 | 8,83 | -13,02 | 0,9867 | -0,0404 | |||
| TE Connectivity plc / EC (IE000IVNQZ81) | 0,06 | -2,44 | 8,82 | -3,49 | 0,9854 | 0,0610 | |||
| BSX / Boston Scientific Corporation | 0,08 | -40,40 | 8,65 | -40,10 | 0,9661 | -0,4942 | |||
| MMC / Marsh & McLennan Companies, Inc. | 0,04 | -2,44 | 8,48 | 1,42 | 0,9478 | 0,1017 | |||
| EL / The Estée Lauder Companies Inc. | 0,14 | -2,44 | 8,46 | -29,89 | 0,9453 | -0,2753 | |||
| MA / Mastercard Incorporated | 0,02 | -2,44 | 8,24 | -3,74 | 0,9203 | 0,0548 | |||
| NSRGY / Nestlé S.A. - Depositary Receipt (Common Stock) | 0,07 | -2,45 | 7,81 | 21,91 | 0,8728 | 0,2246 | |||
| CME / CME Group Inc. | 0,03 | 7,68 | 0,8583 | 0,8583 | |||||
| DLMAY / Dollarama Inc. - Depositary Receipt (Common Stock) | 0,06 | -2,44 | 7,21 | 27,21 | 0,8059 | 0,2323 | |||
| NKE / NIKE, Inc. | 0,13 | -33,86 | 7,18 | -51,49 | 0,8023 | -0,6951 | |||
| LRLCY / L'Oréal S.A. - Depositary Receipt (Common Stock) | 0,02 | 56,88 | 6,82 | 67,44 | 0,7620 | 0,2587 | |||
| ADI / Analog Devices, Inc. | 0,03 | -2,45 | 6,59 | -10,27 | 0,7359 | -0,0065 | |||
| SYK / Stryker Corporation | 0,02 | -2,44 | 6,45 | -6,78 | 0,7201 | 0,0208 | |||
| GGG / Graco Inc. | 0,08 | -2,44 | 6,12 | -5,41 | 0,6839 | 0,0293 | |||
| BME1 N / B&M European Value Retail S.A. | 1,35 | -2,44 | 6,08 | 9,68 | 0,6788 | 0,1185 | |||
| US55291X1090 / MFS Institutional Money Market Portfolio | 5,97 | -43,32 | 5,97 | -43,33 | 0,6668 | -0,3985 | |||
| ICLR / ICON Public Limited Company | 0,04 | -2,44 | 5,90 | -25,79 | 0,6591 | -0,1450 | |||
| SIKA / Sika AG | 0,02 | -2,44 | 5,68 | -3,86 | 0,6342 | 0,0369 | |||
| POOL / Pool Corporation | 0,02 | 5,62 | 0,6276 | 0,6276 | |||||
| EXPGY / Experian plc - Depositary Receipt (Common Stock) | 0,11 | -2,44 | 5,24 | -2,42 | 0,5849 | 0,0422 | |||
| IT / Gartner, Inc. | 0,01 | -42,58 | 5,14 | -55,45 | 0,5744 | -0,5931 | |||
| TMO / Thermo Fisher Scientific Inc. | 0,01 | -2,44 | 4,94 | -29,99 | 0,5515 | -0,1616 | |||
| Aptiv plc / EC (JE00BTDN8H13) | 0,08 | -47,22 | 4,39 | -51,75 | 0,4905 | -0,4298 | |||
| VEEV / Veeva Systems Inc. | 0,02 | -2,44 | 4,33 | -2,28 | 0,4833 | 0,0356 | |||
| BAER / Julius Bär Gruppe AG | 0,07 | -2,44 | 4,27 | -10,39 | 0,4769 | -0,0049 | |||
| TXN / Texas Instruments Incorporated | 0,03 | -2,44 | 4,27 | -15,41 | 0,4765 | -0,0336 | |||
| SBUX / Starbucks Corporation | 0,04 | -33,18 | 2,92 | -50,33 | 0,3266 | -0,2687 | |||
| 035420 / NAVER Corporation | 0,02 | -78,29 | 2,16 | -79,33 | 0,2411 | -0,8150 | |||
| TRI / Thomson Reuters Corporation | 0,01 | -2,44 | 1,74 | 8,02 | 0,1942 | 0,0314 |