Statistiques de base
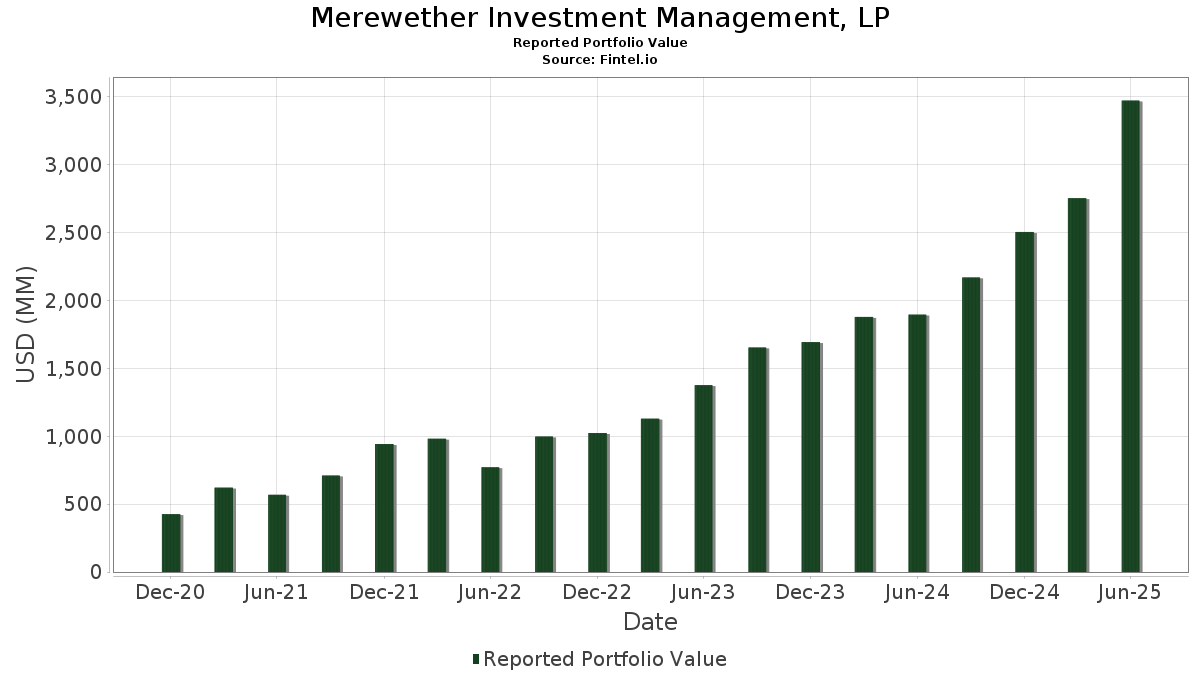
| Valeur du portefeuille | $ 3 472 105 995 |
| Positions actuelles | 63 |
Dernières positions, performances, ASG (à partir des dépôts 13F, 13D)
Merewether Investment Management, LP a déclaré un total de 63 positions dans ses derniers dépôts auprès de la SEC. La valeur la plus récente du portefeuille est calculée à 3 472 105 995 USD. Les actifs sous gestion réels (ASG) sont cette valeur plus les liquidités (qui ne sont pas divulguées). Les principales positions de Merewether Investment Management, LP sont Vistra Corp. (US:VST) , EQT Corporation (US:EQT) , Targa Resources Corp. (US:TRGP) , Shell plc - Depositary Receipt (Common Stock) (US:SHEL) , and Kinder Morgan, Inc. (US:KMI) . Les nouvelles positions de Merewether Investment Management, LP incluent Kinder Morgan, Inc. (US:KMI) , The Mosaic Company (US:MOS) , Hubbell Incorporated (US:HUBB) , Flowserve Corporation (US:FLS) , and Comfort Systems USA, Inc. (US:FIX) .
Meilleures augmentations ce trimestre
Nous utilisons la variation de l'allocation du portefeuille car il s'agit de l'indicateur le plus significatif. Les changements peuvent être dus à des transactions ou à des variations de prix des actions.
| Titre | Actions (en millions) |
Valeur ($ en millions) |
% du portefeuille | ΔPortefeuille % |
|---|---|---|---|---|
| 4,71 | 138,48 | 3,9883 | 3,9883 | |
| 1,68 | 127,06 | 3,6595 | 2,6293 | |
| 3,36 | 196,15 | 5,6492 | 2,3829 | |
| 1,07 | 78,22 | 2,2529 | 2,2529 | |
| 1,98 | 72,38 | 2,0846 | 2,0846 | |
| 0,17 | 68,16 | 1,9632 | 1,9632 | |
| 0,95 | 64,36 | 1,8537 | 1,8537 | |
| 1,32 | 254,96 | 7,3432 | 1,4107 | |
| 0,89 | 46,55 | 1,3408 | 1,3408 | |
| 0,27 | 79,43 | 2,2876 | 1,2605 |
Principales baisses ce trimestre
Nous utilisons la variation de l'allocation du portefeuille car il s'agit de l'indicateur le plus significatif. Les changements peuvent être dus à des transactions ou à des variations de prix des actions.
| Titre | Actions (en millions) |
Valeur ($ en millions) |
% du portefeuille | ΔPortefeuille % |
|---|---|---|---|---|
| 0,08 | 3,30 | 0,0950 | -2,7301 | |
| 0,70 | 75,50 | 2,1745 | -1,8328 | |
| 3,13 | 117,23 | 3,3763 | -1,4614 | |
| 2,45 | 172,27 | 4,9614 | -1,3775 | |
| 0,53 | 19,95 | 0,5747 | -1,2630 | |
| 0,49 | 16,78 | 0,4834 | -1,1135 | |
| 1,32 | 23,85 | 0,6870 | -0,9511 | |
| 5,40 | 73,61 | 2,1199 | -0,8284 | |
| 0,24 | 33,26 | 0,9580 | -0,8033 | |
| 1,22 | 101,76 | 2,9309 | -0,7458 |
Déclarations 13F et dépôts de fonds
Ce formulaire a été déposé le 2025-08-14 pour la période de déclaration 2025-06-30. Cliquez sur l'icône du lien pour voir l'historique complet des transactions.
Mettre à niveau pour débloquer les données premium et exporter vers Excel ![]() .
.
| Titre | Type | Prix moyen de l'action | Actions (en millions) |
ΔActions (%) |
ΔActions (%) |
Valeur ($ en millions) |
Portefeuille (%) |
ΔPortefeuille (%) |
|
|---|---|---|---|---|---|---|---|---|---|
| VST / Vistra Corp. | 1,32 | -5,42 | 254,96 | 56,09 | 7,3432 | 1,4107 | |||
| EQT / EQT Corporation | 3,36 | 99,81 | 196,15 | 118,10 | 5,6492 | 2,3829 | |||
| TRGP / Targa Resources Corp. | 0,99 | 52,88 | 172,79 | 32,75 | 4,9765 | 0,2493 | |||
| SHEL / Shell plc - Depositary Receipt (Common Stock) | 2,45 | 2,72 | 172,27 | -1,30 | 4,9614 | -1,3775 | |||
| KMI / Kinder Morgan, Inc. | 4,71 | 138,48 | 3,9883 | 3,9883 | |||||
| SRE / Sempra | 1,68 | 321,87 | 127,06 | 347,95 | 3,6595 | 2,6293 | |||
| NI / NiSource Inc. | 3,01 | 55,21 | 121,27 | 56,18 | 3,4927 | 0,6726 | |||
| SU / Suncor Energy Inc. | 3,13 | -9,06 | 117,23 | -11,99 | 3,3763 | -1,4614 | |||
| ETR / Entergy Corporation | 1,22 | 3,39 | 101,76 | 0,52 | 2,9309 | -0,7458 | |||
| MTZ / MasTec, Inc. | 0,54 | -28,68 | 92,50 | 4,14 | 2,6641 | -0,5617 | |||
| CVE / Cenovus Energy Inc. | 6,09 | 65,44 | 82,83 | 61,75 | 2,3857 | 0,5258 | |||
| OVV / Ovintiv Inc. | 2,15 | 17,22 | 81,66 | 4,21 | 2,3520 | -0,4940 | |||
| TLN / Talen Energy Corporation | 0,27 | 92,86 | 79,43 | 180,87 | 2,2876 | 1,2605 | |||
| NVT / nVent Electric plc | 1,07 | 78,22 | 2,2529 | 2,2529 | |||||
| XOM / Exxon Mobil Corporation | 0,70 | -24,51 | 75,50 | -31,57 | 2,1745 | -1,8328 | |||
| EXE / Expand Energy Corporation | 0,64 | -3,43 | 75,06 | 1,44 | 2,1618 | -0,5255 | |||
| PR / Permian Resources Corporation | 5,40 | -7,80 | 73,61 | -9,33 | 2,1199 | -0,8284 | |||
| MOS / The Mosaic Company | 1,98 | 72,38 | 2,0846 | 2,0846 | |||||
| VLO / Valero Energy Corporation | 0,53 | 47,02 | 71,43 | 49,63 | 2,0574 | 0,3236 | |||
| HUBB / Hubbell Incorporated | 0,17 | 68,16 | 1,9632 | 1,9632 | |||||
| PNW / Pinnacle West Capital Corporation | 0,73 | 3,95 | 65,69 | -2,36 | 1,8919 | -0,5514 | |||
| GEV / GE Vernova Inc. | 0,12 | -40,00 | 64,74 | 3,99 | 1,8647 | -0,3965 | |||
| XEL / Xcel Energy Inc. | 0,95 | 64,36 | 1,8537 | 1,8537 | |||||
| FANG / Diamondback Energy, Inc. | 0,42 | 111,11 | 58,21 | 81,43 | 1,6765 | 0,5113 | |||
| CNQ / Canadian Natural Resources Limited | 1,82 | -4,11 | 57,04 | -2,25 | 1,6427 | -0,4764 | |||
| ATO / Atmos Energy Corporation | 0,35 | 4,14 | 53,71 | 3,82 | 1,5470 | -0,3320 | |||
| CNP / CenterPoint Energy, Inc. | 1,34 | 4,05 | 49,37 | 5,51 | 1,4220 | -0,2775 | |||
| FLS / Flowserve Corporation | 0,89 | 46,55 | 1,3408 | 1,3408 | |||||
| KGS / Kodiak Gas Services, Inc. | 1,19 | -3,30 | 40,61 | -11,15 | 1,1697 | -0,4905 | |||
| FCX / Freeport-McMoRan Inc. | 0,92 | -11,42 | 39,80 | 1,43 | 1,1463 | -0,2789 | |||
| ITRI / Itron, Inc. | 0,30 | 1 552,68 | 39,59 | 1 977,23 | 1,1403 | 1,0711 | |||
| GNRC / Generac Holdings Inc. | 0,27 | 38,08 | 1,0967 | 1,0967 | |||||
| DTM / DT Midstream, Inc. | 0,34 | 810,11 | 37,61 | 936,97 | 1,0832 | 0,9515 | |||
| FIX / Comfort Systems USA, Inc. | 0,07 | 37,21 | 1,0717 | 1,0717 | |||||
| IAG / IAMGOLD Corporation | 5,02 | 14,93 | 36,89 | 35,15 | 1,0624 | 0,0711 | |||
| MPC / Marathon Petroleum Corporation | 0,21 | 35,55 | 1,0238 | 1,0238 | |||||
| OGE / OGE Energy Corp. | 0,78 | -14,32 | 34,79 | -17,26 | 1,0019 | -0,5251 | |||
| VNOM / Viper Energy, Inc. | 0,89 | 33,97 | 0,9785 | 0,9785 | |||||
| HES / Hess Corporation | 0,24 | -20,92 | 33,26 | -31,41 | 0,9580 | -0,8033 | |||
| FSLR / First Solar, Inc. | 0,20 | 286,71 | 32,88 | 406,41 | 0,9469 | 0,7111 | |||
| ESI / Element Solutions Inc | 1,24 | 28,03 | 0,8073 | 0,8073 | |||||
| KGC / Kinross Gold Corporation | 1,72 | -19,83 | 26,85 | -0,63 | 0,7732 | -0,2080 | |||
| RIOT / Riot Platforms, Inc. | 2,36 | 26,66 | 0,7678 | 0,7678 | |||||
| ET / Energy Transfer LP - Limited Partnership | 1,32 | -45,78 | 23,85 | -47,12 | 0,6870 | -0,9511 | |||
| BKV / BKV Corporation | 0,88 | 3,75 | 21,14 | 19,16 | 0,6089 | -0,0355 | |||
| IREN / IREN Limited | 1,44 | 21,02 | 0,6055 | 0,6055 | |||||
| B / Barrick Mining Corporation | 0,96 | 20,04 | 0,5771 | 0,5771 | |||||
| TS / Tenaris S.A. - Depositary Receipt (Common Stock) | 0,53 | -58,76 | 19,95 | -60,56 | 0,5747 | -1,2630 | |||
| BKR / Baker Hughes Company | 0,47 | -30,40 | 18,06 | -39,29 | 0,5203 | -0,5603 | |||
| FTI / TechnipFMC plc | 0,49 | -64,88 | 16,78 | -61,83 | 0,4834 | -1,1135 | |||
| HCC / Warrior Met Coal, Inc. | 0,34 | -33,25 | 15,77 | -35,90 | 0,4543 | -0,4394 | |||
| CTRA / Coterra Energy Inc. | 0,61 | 15,44 | 0,4447 | 0,4447 | |||||
| CCJ / Cameco Corporation | 0,17 | 5,07 | 12,66 | 89,49 | 0,3646 | 0,1220 | |||
| SLB / Schlumberger Limited | 0,35 | 11,94 | 0,3438 | 0,3438 | |||||
| SOC / Sable Offshore Corp. | 0,40 | 8,79 | 0,2532 | 0,2532 | |||||
| NXT / Nextracker Inc. | 0,16 | 8,47 | 0,2438 | 0,2438 | |||||
| PRIM / Primoris Services Corporation | 0,10 | 8,12 | 0,2337 | 0,2337 | |||||
| EQX / Equinox Gold Corp. | 1,00 | 5,73 | 0,1650 | 0,1650 | |||||
| FRO / Frontline plc | 0,32 | 5,25 | 0,1511 | 0,1511 | |||||
| AR / Antero Resources Corporation | 0,08 | -95,74 | 3,30 | -95,76 | 0,0950 | -2,7301 | |||
| DAR / Darling Ingredients Inc. | 0,02 | -6,30 | 0,78 | 13,83 | 0,0225 | -0,0024 | |||
| ALV / Autoliv, Inc. | 0,01 | 0,00 | 0,72 | 26,50 | 0,0206 | 0,0001 | |||
| MPLX / MPLX LP - Limited Partnership | 0,33 | 0,07 | 0,0020 | 0,0020 | |||||
| RS / Reliance, Inc. | 0,00 | -100,00 | 0,00 | 0,0000 | |||||
| PNM / PNM Resources, Inc. | 0,00 | -100,00 | 0,00 | 0,0000 | |||||
| NEM / Newmont Corporation | 0,00 | -100,00 | 0,00 | 0,0000 | |||||
| LBRT / Liberty Energy Inc. | 0,00 | -100,00 | 0,00 | 0,0000 | |||||
| NUE / Nucor Corporation | 0,00 | -100,00 | 0,00 | 0,0000 | |||||
| FLEX / Flex Ltd. | 0,00 | -100,00 | 0,00 | 0,0000 | |||||
| DINO / HF Sinclair Corporation | 0,00 | -100,00 | 0,00 | 0,0000 | |||||
| TRP / TC Energy Corporation | 0,00 | -100,00 | 0,00 | 0,0000 | |||||
| EVRG / Evergy, Inc. | 0,00 | -100,00 | 0,00 | 0,0000 | |||||
| WFRD / Weatherford International plc | 0,00 | -100,00 | 0,00 | 0,0000 | |||||
| PPL / PPL Corporation | 0,00 | -100,00 | 0,00 | 0,0000 | |||||
| KNTK / Kinetik Holdings Inc. | 0,00 | -100,00 | 0,00 | 0,0000 | |||||
| COP / ConocoPhillips | 0,00 | -100,00 | 0,00 | 0,0000 |