Statistiques de base
| Valeur du portefeuille | $ 488 405 699 |
| Positions actuelles | 102 |
Dernières positions, performances, ASG (à partir des dépôts 13F, 13D)
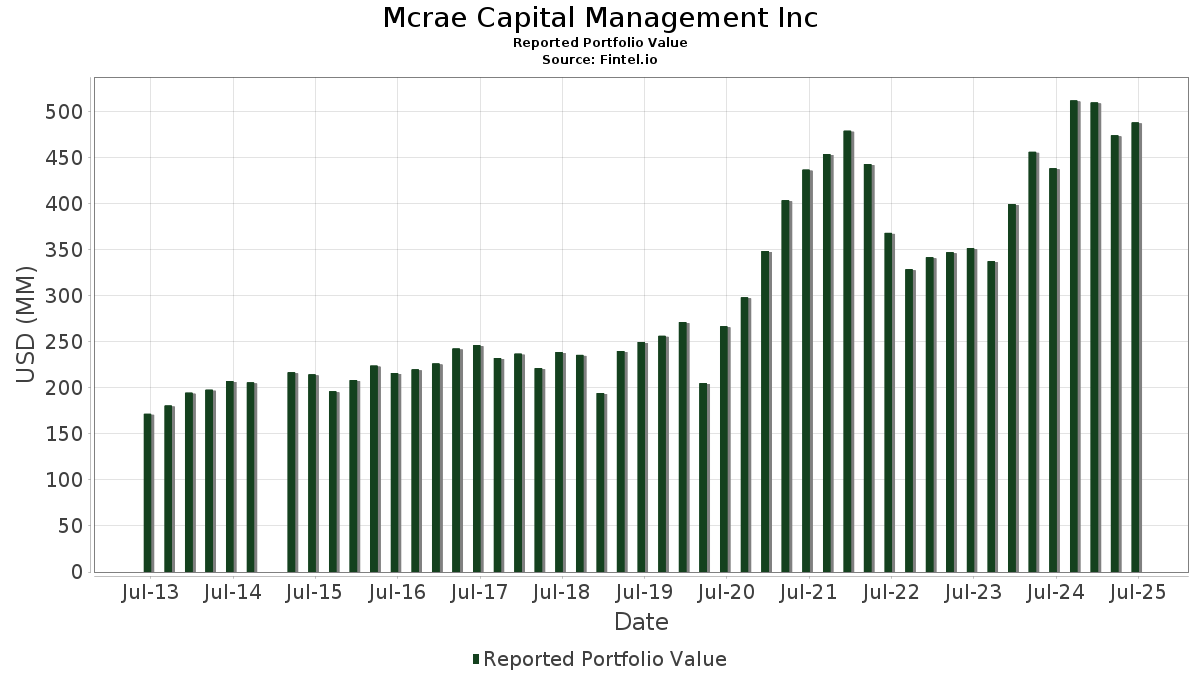
Mcrae Capital Management Inc a déclaré un total de 102 positions dans ses derniers dépôts auprès de la SEC. La valeur la plus récente du portefeuille est calculée à 488 405 699 USD. Les actifs sous gestion réels (ASG) sont cette valeur plus les liquidités (qui ne sont pas divulguées). Les principales positions de Mcrae Capital Management Inc sont Microsoft Corporation (US:MSFT) , Check Point Software Technologies Ltd. (US:CHKP) , Nasdaq, Inc. (US:NDAQ) , Williams-Sonoma, Inc. (US:WSM) , and Labcorp Holdings Inc. (US:LH) . Les nouvelles positions de Mcrae Capital Management Inc incluent Fidelity Covington Trust - Fidelity Enhanced Mid Cap ETF (US:FMDE) , Fidelity Covington Trust - Fidelity MSCI Information Technology Index ETF (US:FTEC) , Fidelity Covington Trust - Fidelity Enhanced Small Cap ETF (US:FESM) , Fidelity Covington Trust - Fidelity MSCI Financials Index ETF (US:FNCL) , and Fidelity Covington Trust - Fidelity MSCI Health Care Index ETF (US:FHLC) .
Meilleures augmentations ce trimestre
Nous utilisons la variation de l'allocation du portefeuille car il s'agit de l'indicateur le plus significatif. Les changements peuvent être dus à des transactions ou à des variations de prix des actions.
| Titre | Actions (en millions) |
Valeur ($ en millions) |
% du portefeuille | ΔPortefeuille % |
|---|---|---|---|---|
| 0,07 | 34,24 | 7,0112 | 1,4122 | |
| 0,05 | 19,00 | 3,8895 | 1,1602 | |
| 0,05 | 8,04 | 1,6453 | 0,6961 | |
| 0,29 | 25,77 | 5,2758 | 0,6177 | |
| 0,01 | 5,35 | 1,0945 | 0,5259 | |
| 0,09 | 22,42 | 4,5896 | 0,3753 | |
| 0,02 | 13,02 | 2,6659 | 0,3564 | |
| 0,05 | 14,46 | 2,9615 | 0,3555 | |
| 0,19 | 13,99 | 2,8652 | 0,3099 | |
| 0,03 | 7,00 | 1,4326 | 0,2739 |
Principales baisses ce trimestre
Nous utilisons la variation de l'allocation du portefeuille car il s'agit de l'indicateur le plus significatif. Les changements peuvent être dus à des transactions ou à des variations de prix des actions.
| Titre | Actions (en millions) |
Valeur ($ en millions) |
% du portefeuille | ΔPortefeuille % |
|---|---|---|---|---|
| 0,02 | 7,31 | 1,4962 | -1,8332 | |
| 0,05 | 8,38 | 1,7165 | -0,9462 | |
| 0,22 | 15,52 | 3,1770 | -0,6929 | |
| 0,13 | 21,90 | 4,4843 | -0,5678 | |
| 0,12 | 25,96 | 5,3147 | -0,3954 | |
| 0,09 | 19,79 | 4,0520 | -0,3782 | |
| 0,03 | 12,49 | 2,5564 | -0,3286 | |
| 0,03 | 13,56 | 2,7759 | -0,3235 | |
| 0,05 | 16,11 | 3,2990 | -0,2706 | |
| 0,06 | 14,25 | 2,9174 | -0,1455 |
Déclarations 13F et dépôts de fonds
Ce formulaire a été déposé le 2025-08-06 pour la période de déclaration 2025-06-30. Cliquez sur l'icône du lien pour voir l'historique complet des transactions.
Mettre à niveau pour débloquer les données premium et exporter vers Excel ![]() .
.
| Titre | Type | Prix moyen de l'action | Actions (en millions) |
ΔActions (%) |
ΔActions (%) |
Valeur ($ en millions) |
Portefeuille (%) |
ΔPortefeuille (%) |
|
|---|---|---|---|---|---|---|---|---|---|
| MSFT / Microsoft Corporation | 0,07 | -2,71 | 34,24 | 28,92 | 7,0112 | 1,4122 | |||
| CHKP / Check Point Software Technologies Ltd. | 0,12 | -1,29 | 25,96 | -4,18 | 5,3147 | -0,3954 | |||
| NDAQ / Nasdaq, Inc. | 0,29 | -1,08 | 25,77 | 16,60 | 5,2758 | 0,6177 | |||
| WSM / Williams-Sonoma, Inc. | 0,14 | -0,09 | 23,09 | 3,24 | 4,7280 | 0,0133 | |||
| LH / Labcorp Holdings Inc. | 0,09 | -0,59 | 22,42 | 12,12 | 4,5896 | 0,3753 | |||
| XPRO / Expro Group Holdings N.V. | 0,13 | 17,05 | 21,90 | -8,62 | 4,4843 | -0,5678 | |||
| LOW / Lowe's Companies, Inc. | 0,09 | -1,02 | 19,79 | -5,83 | 4,0520 | -0,3782 | |||
| PWR / Quanta Services, Inc. | 0,05 | -1,36 | 19,00 | 46,72 | 3,8895 | 1,1602 | |||
| KEYS / Keysight Technologies, Inc. | 0,12 | 0,55 | 18,86 | 10,01 | 3,8625 | 0,2476 | |||
| SNA / Snap-on Incorporated | 0,05 | 3,04 | 16,11 | -4,85 | 3,2990 | -0,2706 | |||
| OMC / Omnicom Group Inc. | 0,22 | -2,59 | 15,52 | -15,48 | 3,1770 | -0,6929 | |||
| WDAY / Workday, Inc. | 0,06 | 2,56 | 14,84 | 5,40 | 3,0378 | 0,0705 | |||
| CRM / Salesforce, Inc. | 0,05 | 15,14 | 14,46 | 17,00 | 2,9615 | 0,3555 | |||
| BR / Broadridge Financial Solutions, Inc. | 0,06 | -2,17 | 14,25 | -1,94 | 2,9174 | -0,1455 | |||
| PYPL / PayPal Holdings, Inc. | 0,19 | 1,35 | 13,99 | 15,43 | 2,8652 | 0,3099 | |||
| VRTX / Vertex Pharmaceuticals Incorporated | 0,03 | 0,41 | 13,56 | -7,79 | 2,7759 | -0,3235 | |||
| URI / United Rentals, Inc. | 0,02 | -1,14 | 13,02 | 18,84 | 2,6659 | 0,3564 | |||
| TFC / Truist Financial Corporation | 0,30 | 3,82 | 12,99 | 8,46 | 2,6589 | 0,1350 | |||
| CB / Chubb Limited | 0,04 | 2,23 | 12,70 | -1,92 | 2,6010 | -0,1294 | |||
| TMO / Thermo Fisher Scientific Inc. | 0,03 | 11,96 | 12,49 | -8,78 | 2,5564 | -0,3286 | |||
| LULU / lululemon athletica inc. | 0,04 | 36,89 | 9,18 | 14,91 | 1,8798 | 0,1955 | |||
| BDX / Becton, Dickinson and Company | 0,05 | -11,74 | 8,38 | -33,63 | 1,7165 | -0,9462 | |||
| ACN / Accenture plc | 0,03 | 6,53 | 8,36 | 2,04 | 1,7126 | -0,0153 | |||
| GOOGL / Alphabet Inc. | 0,05 | 56,59 | 8,04 | 78,44 | 1,6453 | 0,6961 | |||
| JPM / JPMorgan Chase & Co. | 0,03 | -0,84 | 7,67 | 17,19 | 1,5701 | 0,1909 | |||
| UNH / UnitedHealth Group Incorporated | 0,02 | -22,33 | 7,31 | -53,74 | 1,4962 | -1,8332 | |||
| AMZN / Amazon.com, Inc. | 0,03 | 10,39 | 7,00 | 27,29 | 1,4326 | 0,2739 | |||
| GS / The Goldman Sachs Group, Inc. | 0,01 | 52,96 | 5,35 | 98,18 | 1,0945 | 0,5259 | |||
| AAPL / Apple Inc. | 0,02 | -0,20 | 5,13 | -7,80 | 1,0500 | -0,1227 | |||
| SO / The Southern Company | 0,03 | 0,00 | 2,81 | -0,14 | 0,5744 | -0,0177 | |||
| GBTC / Grayscale Bitcoin Trust (BTC) | 0,03 | -30,61 | 2,62 | -9,67 | 0,5374 | -0,0752 | |||
| GLD / SPDR Gold Trust | 0,01 | 0,59 | 2,58 | 6,40 | 0,5280 | 0,0172 | |||
| TT / Trane Technologies plc | 0,01 | -1,73 | 2,48 | 27,57 | 0,5080 | 0,0980 | |||
| HON / Honeywell International Inc. | 0,01 | 1,41 | 2,42 | 11,52 | 0,4958 | 0,0381 | |||
| JNJ / Johnson & Johnson | 0,01 | -3,94 | 1,92 | -11,54 | 0,3925 | -0,0642 | |||
| PFF / iShares Trust - iShares Preferred and Income Securities ETF | 0,06 | 1,33 | 1,81 | 1,17 | 0,3709 | -0,0066 | |||
| WM / Waste Management, Inc. | 0,01 | -0,07 | 1,74 | -1,25 | 0,3558 | -0,0151 | |||
| IVV / iShares Trust - iShares Core S&P 500 ETF | 0,00 | -12,62 | 1,73 | -3,46 | 0,3539 | -0,0234 | |||
| INTU / Intuit Inc. | 0,00 | 0,69 | 1,72 | 29,18 | 0,3528 | 0,0716 | |||
| ISRG / Intuitive Surgical, Inc. | 0,00 | -21,39 | 1,60 | -13,77 | 0,3271 | -0,0633 | |||
| META / Meta Platforms, Inc. | 0,00 | 5,79 | 1,55 | 35,58 | 0,3176 | 0,0762 | |||
| BK / The Bank of New York Mellon Corporation | 0,02 | 0,00 | 1,42 | 8,63 | 0,2915 | 0,0152 | |||
| ZBRA / Zebra Technologies Corporation | 0,00 | 0,00 | 1,34 | 9,11 | 0,2750 | 0,0156 | |||
| FMDE / Fidelity Covington Trust - Fidelity Enhanced Mid Cap ETF | 0,03 | 1,09 | 0,2236 | 0,2236 | |||||
| VOO / Vanguard Index Funds - Vanguard S&P 500 ETF | 0,00 | 0,00 | 0,98 | 10,52 | 0,2002 | 0,0137 | |||
| COST / Costco Wholesale Corporation | 0,00 | 0,00 | 0,92 | 4,68 | 0,1881 | 0,0031 | |||
| FTEC / Fidelity Covington Trust - Fidelity MSCI Information Technology Index ETF | 0,00 | 0,88 | 0,1811 | 0,1811 | |||||
| PLTR / Palantir Technologies Inc. | 0,01 | -2,27 | 0,88 | 57,81 | 0,1800 | 0,0626 | |||
| AEM / Agnico Eagle Mines Limited | 0,01 | -12,50 | 0,83 | -4,04 | 0,1705 | -0,0124 | |||
| FDX / FedEx Corporation | 0,00 | 0,00 | 0,80 | -6,75 | 0,1640 | -0,0171 | |||
| PFE / Pfizer Inc. | 0,03 | -0,91 | 0,80 | -5,24 | 0,1629 | -0,0140 | |||
| DHR / Danaher Corporation | 0,00 | -24,56 | 0,76 | -27,33 | 0,1553 | -0,0646 | |||
| PEP / PepsiCo, Inc. | 0,01 | -18,02 | 0,75 | -27,88 | 0,1537 | -0,0655 | |||
| LLY / Eli Lilly and Company | 0,00 | -10,09 | 0,73 | -15,13 | 0,1494 | -0,0318 | |||
| UNP / Union Pacific Corporation | 0,00 | 0,00 | 0,70 | -2,66 | 0,1425 | -0,0081 | |||
| MRK / Merck & Co., Inc. | 0,01 | 2,39 | 0,68 | -9,73 | 0,1387 | -0,0194 | |||
| HD / The Home Depot, Inc. | 0,00 | 1,46 | 0,64 | 1,44 | 0,1303 | -0,0019 | |||
| MMC / Marsh & McLennan Companies, Inc. | 0,00 | -1,72 | 0,62 | -11,88 | 0,1276 | -0,0216 | |||
| XOM / Exxon Mobil Corporation | 0,01 | 0,00 | 0,61 | -9,31 | 0,1258 | -0,0171 | |||
| AGI / Alamos Gold Inc. | 0,02 | 0,00 | 0,61 | -0,65 | 0,1245 | -0,0045 | |||
| AMP / Ameriprise Financial, Inc. | 0,00 | 4,61 | 0,61 | 15,24 | 0,1240 | 0,0133 | |||
| IJH / iShares Trust - iShares Core S&P Mid-Cap ETF | 0,01 | -19,87 | 0,58 | -14,87 | 0,1197 | -0,0250 | |||
| CVX / Chevron Corporation | 0,00 | 0,00 | 0,58 | -14,54 | 0,1194 | -0,0242 | |||
| ADP / Automatic Data Processing, Inc. | 0,00 | 1,79 | 0,58 | 2,85 | 0,1184 | -0,0002 | |||
| NVDA / NVIDIA Corporation | 0,00 | 0,00 | 0,57 | 45,64 | 0,1165 | 0,0342 | |||
| WMT / Walmart Inc. | 0,01 | 0,00 | 0,57 | 11,42 | 0,1160 | 0,0088 | |||
| ABT / Abbott Laboratories | 0,00 | -35,61 | 0,54 | -33,98 | 0,1114 | -0,0623 | |||
| NEM / Newmont Corporation | 0,01 | 0,00 | 0,52 | 20,74 | 0,1074 | 0,0158 | |||
| FESM / Fidelity Covington Trust - Fidelity Enhanced Small Cap ETF | 0,02 | 0,51 | 0,1054 | 0,1054 | |||||
| GJR / Strats Trust For Procter & Gambel Security - Preferred Security | 0,00 | -3,25 | 0,47 | -9,71 | 0,0972 | -0,0134 | |||
| IJR / iShares Trust - iShares Core S&P Small-Cap ETF | 0,00 | -25,46 | 0,47 | -22,24 | 0,0968 | -0,0311 | |||
| ETN / Eaton Corporation plc | 0,00 | 0,00 | 0,47 | 31,37 | 0,0960 | 0,0208 | |||
| XYL / Xylem Inc. | 0,00 | 0,00 | 0,46 | 8,20 | 0,0947 | 0,0047 | |||
| CSCO / Cisco Systems, Inc. | 0,01 | 0,00 | 0,46 | 12,32 | 0,0936 | 0,0079 | |||
| NVT / nVent Electric plc | 0,01 | 0,00 | 0,46 | 40,00 | 0,0932 | 0,0245 | |||
| FNCL / Fidelity Covington Trust - Fidelity MSCI Financials Index ETF | 0,01 | 0,45 | 0,0926 | 0,0926 | |||||
| FHLC / Fidelity Covington Trust - Fidelity MSCI Health Care Index ETF | 0,01 | 0,44 | 0,0911 | 0,0911 | |||||
| PEG / Public Service Enterprise Group Incorporated | 0,01 | -0,58 | 0,43 | 1,66 | 0,0879 | -0,0011 | |||
| BTC / Grayscale Bitcoin Mini Trust | 0,01 | 0,00 | 0,43 | 30,77 | 0,0872 | 0,0186 | |||
| MET / MetLife, Inc. | 0,01 | 0,00 | 0,40 | 0,00 | 0,0829 | -0,0023 | |||
| NFLX / Netflix, Inc. | 0,00 | 0,00 | 0,40 | 43,73 | 0,0823 | 0,0233 | |||
| FIDU / Fidelity Covington Trust - Fidelity MSCI Industrials Index ETF | 0,01 | 0,40 | 0,0813 | 0,0813 | |||||
| RTX / RTX Corporation | 0,00 | -3,97 | 0,35 | 6,01 | 0,0724 | 0,0020 | |||
| DIS / The Walt Disney Company | 0,00 | 0,35 | 0,35 | 26,16 | 0,0722 | 0,0133 | |||
| BGH / Barings Global Short Duration High Yield Fund | 0,02 | 1,28 | 0,33 | 3,11 | 0,0680 | 0,0001 | |||
| AMGN / Amgen Inc. | 0,00 | 0,00 | 0,33 | -10,30 | 0,0678 | -0,0101 | |||
| COP / ConocoPhillips | 0,00 | 0,00 | 0,32 | -14,44 | 0,0656 | -0,0134 | |||
| FDIS / Fidelity Covington Trust - Fidelity MSCI Consumer Discretionary Index ETF | 0,00 | 0,30 | 0,0624 | 0,0624 | |||||
| GOOGL / Alphabet Inc. | 0,00 | 0,00 | 0,30 | 13,48 | 0,0622 | 0,0058 | |||
| PNC / The PNC Financial Services Group, Inc. | 0,00 | 0,00 | 0,28 | 6,04 | 0,0577 | 0,0017 | |||
| AVGO / Broadcom Inc. | 0,00 | 0,28 | 0,0564 | 0,0564 | |||||
| SPY / SPDR S&P 500 ETF | 0,00 | 0,00 | 0,26 | 10,68 | 0,0531 | 0,0036 | |||
| OPOF / Old Point Financial Corporation | 0,01 | 0,25 | 0,0509 | 0,0509 | |||||
| IBM / International Business Machines Corporation | 0,00 | 0,00 | 0,24 | 18,54 | 0,0498 | 0,0066 | |||
| ABBV / AbbVie Inc. | 0,00 | 0,00 | 0,24 | -11,40 | 0,0494 | -0,0080 | |||
| PGF / Invesco Exchange-Traded Fund Trust - Invesco Financial Preferred ETF | 0,02 | 0,00 | 0,23 | -1,30 | 0,0468 | -0,0020 | |||
| USB / U.S. Bancorp | 0,01 | 0,00 | 0,23 | 7,11 | 0,0463 | 0,0018 | |||
| ORCL / Oracle Corporation | 0,00 | 0,22 | 0,0445 | 0,0445 | |||||
| XLK / The Select Sector SPDR Trust - The Technology Select Sector SPDR Fund | 0,00 | 0,21 | 0,0430 | 0,0430 | |||||
| KO / The Coca-Cola Company | 0,00 | 0,00 | 0,20 | -0,98 | 0,0414 | -0,0017 | |||
| FCOM / Fidelity Covington Trust - Fidelity MSCI Communication Services Index ETF | 0,00 | 0,20 | 0,0413 | 0,0413 | |||||
| VUZI / Vuzix Corporation | 0,02 | 0,00 | 0,07 | 45,65 | 0,0138 | 0,0039 | |||
| HSY / The Hershey Company | 0,00 | -100,00 | 0,00 | 0,0000 | |||||
| ED / Consolidated Edison, Inc. | 0,00 | -100,00 | 0,00 | 0,0000 | |||||
| HL / Hecla Mining Company | 0,00 | -100,00 | 0,00 | 0,0000 | |||||
| FTV / Fortive Corporation | 0,00 | -100,00 | 0,00 | 0,0000 |