Statistiques de base
| Valeur du portefeuille | $ 853 025 092 |
| Positions actuelles | 149 |
Dernières positions, performances, ASG (à partir des dépôts 13F, 13D)
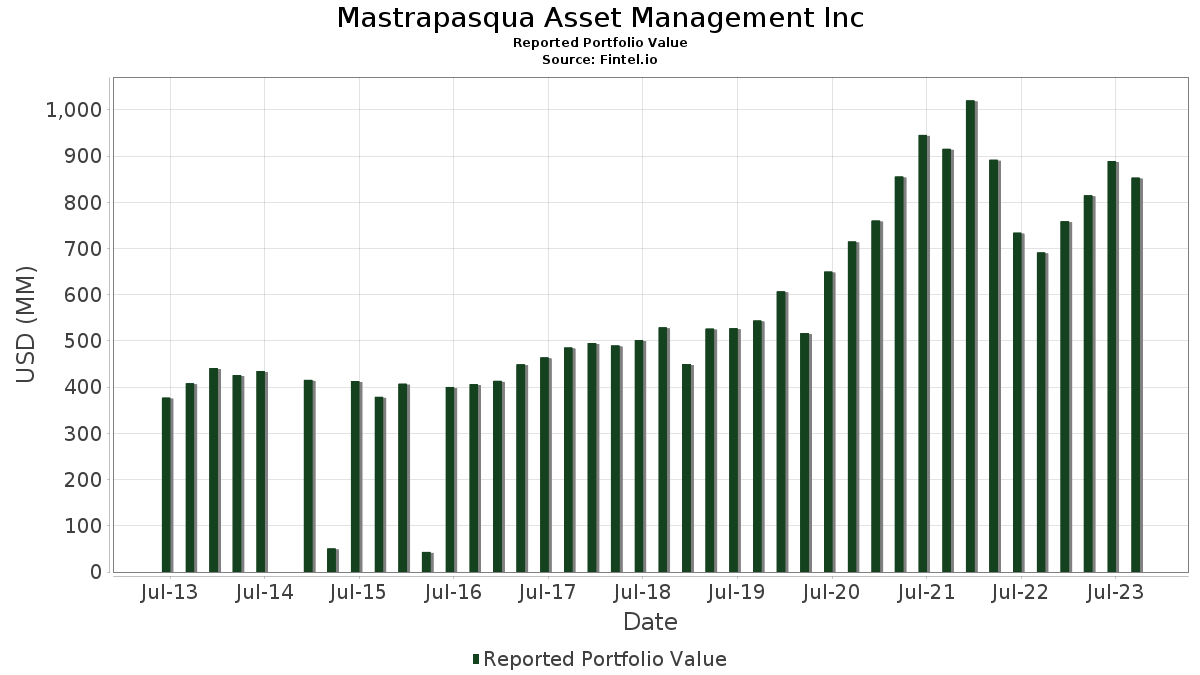
Mastrapasqua Asset Management Inc a déclaré un total de 149 positions dans ses derniers dépôts auprès de la SEC. La valeur la plus récente du portefeuille est calculée à 853 025 092 USD. Les actifs sous gestion réels (ASG) sont cette valeur plus les liquidités (qui ne sont pas divulguées). Les principales positions de Mastrapasqua Asset Management Inc sont NVIDIA Corporation (US:NVDA) , Microsoft Corporation (US:MSFT) , Apple Inc. (US:AAPL) , Broadcom Inc. (US:AVGO) , and Eli Lilly and Company (US:LLY) . Les nouvelles positions de Mastrapasqua Asset Management Inc incluent Alphabet Inc. (US:GOOGL) , Kratos Defense & Security Solutions, Inc. (US:KTOS) , Cameco Corporation (US:CCJ) , Digital Realty Trust, Inc. (US:DLR) , and Dell Technologies Inc. (US:DELL) .
Meilleures augmentations ce trimestre
Nous utilisons la variation de l'allocation du portefeuille car il s'agit de l'indicateur le plus significatif. Les changements peuvent être dus à des transactions ou à des variations de prix des actions.
| Titre | Actions (en millions) |
Valeur ($ en millions) |
% du portefeuille | ΔPortefeuille % |
|---|---|---|---|---|
| 0,04 | 23,65 | 2,7725 | 0,4394 | |
| 0,06 | 15,27 | 1,7905 | 0,3614 | |
| 0,16 | 21,52 | 2,5225 | 0,2850 | |
| 0,14 | 62,30 | 7,3033 | 0,2752 | |
| 0,07 | 22,07 | 2,5878 | 0,2051 | |
| 0,05 | 12,50 | 1,4652 | 0,1965 | |
| 0,03 | 17,67 | 2,0714 | 0,1602 | |
| 0,12 | 7,14 | 0,8376 | 0,1573 | |
| 0,03 | 2,32 | 0,2718 | 0,1255 | |
| 0,05 | 8,94 | 1,0483 | 0,1165 |
Principales baisses ce trimestre
Nous utilisons la variation de l'allocation du portefeuille car il s'agit de l'indicateur le plus significatif. Les changements peuvent être dus à des transactions ou à des variations de prix des actions.
| Titre | Actions (en millions) |
Valeur ($ en millions) |
% du portefeuille | ΔPortefeuille % |
|---|---|---|---|---|
| 0,30 | 51,01 | 5,9793 | -0,6842 | |
| 0,19 | 13,75 | 1,6113 | -0,5050 | |
| 0,17 | 53,39 | 6,2593 | -0,2690 | |
| 0,00 | 0,00 | -0,1541 | ||
| 0,00 | 0,00 | -0,1410 | ||
| 0,14 | 10,57 | 1,2395 | -0,1387 | |
| 0,06 | 12,01 | 1,4085 | -0,1380 | |
| 0,06 | 8,94 | 1,0485 | -0,1173 | |
| 0,00 | 0,00 | -0,1163 | ||
| 0,00 | 0,00 | -0,1162 |
Déclarations 13F et dépôts de fonds
Ce formulaire a été déposé le 2023-10-25 pour la période de déclaration 2023-09-30. Cliquez sur l'icône du lien pour voir l'historique complet des transactions.
Mettre à niveau pour débloquer les données premium et exporter vers Excel ![]() .
.
| Titre | Type | Prix moyen de l'action | Actions (en millions) |
ΔActions (%) |
ΔActions (%) |
Valeur ($ en millions) |
Portefeuille (%) |
ΔPortefeuille (%) |
|
|---|---|---|---|---|---|---|---|---|---|
| NVDA / NVIDIA Corporation | 0,14 | -3,04 | 62,30 | -0,30 | 7,3033 | 0,2752 | |||
| MSFT / Microsoft Corporation | 0,17 | -0,78 | 53,39 | -8,01 | 6,2593 | -0,2690 | |||
| AAPL / Apple Inc. | 0,30 | -2,46 | 51,01 | -13,90 | 5,9793 | -0,6842 | |||
| AVGO / Broadcom Inc. | 0,03 | -1,10 | 27,18 | -5,31 | 3,1866 | -0,0421 | |||
| LLY / Eli Lilly and Company | 0,04 | -0,45 | 23,65 | 14,01 | 2,7725 | 0,4394 | |||
| META / Meta Platforms, Inc. | 0,07 | -0,39 | 22,07 | 4,21 | 2,5878 | 0,2051 | |||
| GOOG / Alphabet Inc. | 0,16 | -0,76 | 21,52 | 8,17 | 2,5225 | 0,2850 | |||
| AMZN / Amazon.com, Inc. | 0,17 | -0,42 | 21,04 | -2,89 | 2,4660 | 0,0295 | |||
| V / Visa Inc. | 0,09 | -0,51 | 19,59 | -3,64 | 2,2962 | 0,0100 | |||
| TMO / Thermo Fisher Scientific Inc. | 0,04 | -0,79 | 18,54 | -3,75 | 2,1733 | 0,0068 | |||
| COST / Costco Wholesale Corporation | 0,03 | -0,90 | 17,67 | 3,99 | 2,0714 | 0,1602 | |||
| MMC / Marsh & McLennan Companies, Inc. | 0,09 | -0,65 | 16,59 | 0,52 | 1,9449 | 0,0885 | |||
| ZTS / Zoetis Inc. | 0,09 | -0,19 | 15,92 | 0,84 | 1,8666 | 0,0904 | |||
| HD / The Home Depot, Inc. | 0,05 | -0,08 | 15,32 | -2,81 | 1,7961 | 0,0230 | |||
| AMGN / Amgen Inc. | 0,06 | -0,69 | 15,27 | 20,20 | 1,7905 | 0,3614 | |||
| RTX / RTX Corporation | 0,19 | -0,57 | 13,75 | -26,95 | 1,6113 | -0,5050 | |||
| CAT / Caterpillar Inc. | 0,05 | -0,13 | 12,50 | 10,81 | 1,4652 | 0,1965 | |||
| IQV / IQVIA Holdings Inc. | 0,06 | -0,17 | 12,01 | -12,61 | 1,4085 | -0,1380 | |||
| WMT / Walmart Inc. | 0,07 | -0,40 | 11,35 | 1,35 | 1,3305 | 0,0708 | |||
| NXPI / NXP Semiconductors N.V. | 0,06 | -1,74 | 11,29 | -4,02 | 1,3231 | 0,0003 | |||
| AJG / Arthur J. Gallagher & Co. | 0,05 | -1,46 | 10,98 | 2,29 | 1,2878 | 0,0799 | |||
| MCHP / Microchip Technology Incorporated | 0,14 | -0,95 | 10,57 | -13,70 | 1,2395 | -0,1387 | |||
| ABT / Abbott Laboratories | 0,11 | 0,52 | 10,30 | -10,70 | 1,2071 | -0,0898 | |||
| PG / The Procter & Gamble Company | 0,07 | 0,20 | 10,09 | -3,68 | 1,1830 | 0,0045 | |||
| PEP / PepsiCo, Inc. | 0,06 | 0,54 | 9,70 | -8,02 | 1,1370 | -0,0491 | |||
| WM / Waste Management, Inc. | 0,06 | -0,40 | 9,61 | -12,44 | 1,1268 | -0,1080 | |||
| MRK / Merck & Co., Inc. | 0,09 | -0,17 | 9,54 | -10,93 | 1,1187 | -0,0865 | |||
| NSC / Norfolk Southern Corporation | 0,05 | 0,07 | 9,04 | -13,10 | 1,0592 | -0,1102 | |||
| C.WSA / Citigroup, Inc. | 0,01 | -0,51 | 9,02 | -6,95 | 1,0569 | -0,0328 | |||
| UPS / United Parcel Service, Inc. | 0,06 | -0,77 | 8,94 | -13,71 | 1,0485 | -0,1173 | |||
| LNG / Cheniere Energy, Inc. | 0,05 | -0,90 | 8,94 | 7,94 | 1,0483 | 0,1165 | |||
| BAC / Bank of America Corporation | 0,33 | -0,68 | 8,93 | -5,22 | 1,0470 | -0,0128 | |||
| HON / Honeywell International Inc. | 0,05 | 0,05 | 8,62 | -10,93 | 1,0099 | -0,0780 | |||
| GS / The Goldman Sachs Group, Inc. | 0,03 | -1,07 | 8,58 | -0,75 | 1,0063 | 0,0334 | |||
| IBM / International Business Machines Corporation | 0,06 | -0,13 | 8,44 | 4,72 | 0,9893 | 0,0829 | |||
| MCD / McDonald's Corporation | 0,03 | 0,79 | 8,11 | -11,02 | 0,9511 | -0,0745 | |||
| ROK / Rockwell Automation, Inc. | 0,03 | 0,96 | 8,04 | -12,39 | 0,9425 | -0,0897 | |||
| ZS / Zscaler, Inc. | 0,05 | -2,03 | 8,00 | 4,20 | 0,9375 | 0,0742 | |||
| LMT / Lockheed Martin Corporation | 0,02 | -2,83 | 7,82 | -13,68 | 0,9163 | -0,1022 | |||
| DE / Deere & Company | 0,02 | 0,26 | 7,39 | -6,63 | 0,8658 | -0,0238 | |||
| TJX / The TJX Companies, Inc. | 0,08 | -0,25 | 7,31 | 4,56 | 0,8569 | 0,0706 | |||
| SLB / Schlumberger Limited | 0,12 | -0,47 | 7,14 | 18,12 | 0,8376 | 0,1573 | |||
| PH / Parker-Hannifin Corporation | 0,02 | 0,24 | 7,02 | 0,11 | 0,8229 | 0,0342 | |||
| DHI / D.R. Horton, Inc. | 0,06 | 2,33 | 6,76 | -9,63 | 0,7922 | -0,0488 | |||
| ORCL / Oracle Corporation | 0,06 | 4,58 | 6,12 | -6,98 | 0,7176 | -0,0226 | |||
| GOOGL / Alphabet Inc. | 0,04 | 5,38 | 0,6311 | 0,0695 | |||||
| AKAM / Akamai Technologies, Inc. | 0,05 | -1,30 | 4,82 | 17,01 | 0,5645 | 0,1016 | |||
| INTU / Intuit Inc. | 0,01 | -1,94 | 4,55 | 9,36 | 0,5331 | 0,0653 | |||
| PANW / Palo Alto Networks, Inc. | 0,02 | -1,87 | 4,50 | -9,96 | 0,5277 | -0,0346 | |||
| TW / Tradeweb Markets Inc. | 0,06 | -1,72 | 4,44 | 15,11 | 0,5206 | 0,0866 | |||
| KEYS / Keysight Technologies, Inc. | 0,03 | 1,18 | 3,85 | -20,06 | 0,4519 | -0,0904 | |||
| LOW / Lowe's Companies, Inc. | 0,02 | -0,90 | 3,77 | -8,72 | 0,4420 | -0,0227 | |||
| A / Agilent Technologies, Inc. | 0,03 | -1,14 | 3,66 | -8,07 | 0,4288 | -0,0187 | |||
| CDW / CDW Corporation | 0,02 | -0,75 | 3,62 | 9,11 | 0,4240 | 0,0512 | |||
| VEEV / Veeva Systems Inc. | 0,02 | -0,42 | 3,58 | 2,46 | 0,4202 | 0,0267 | |||
| TSCO / Tractor Supply Company | 0,02 | -0,60 | 3,51 | -8,71 | 0,4116 | -0,0210 | |||
| QCOM / QUALCOMM Incorporated | 0,03 | -4,60 | 3,43 | -10,98 | 0,4019 | -0,0314 | |||
| LHX / L3Harris Technologies, Inc. | 0,02 | -6,56 | 3,28 | -16,89 | 0,3842 | -0,0594 | |||
| PLTR / Palantir Technologies Inc. | 0,20 | -0,63 | 3,25 | 3,73 | 0,3810 | 0,0285 | |||
| GTLS / Chart Industries, Inc. | 0,02 | -0,07 | 3,20 | 5,79 | 0,3751 | 0,0348 | |||
| STE / STERIS plc | 0,01 | -0,28 | 3,17 | -2,73 | 0,3712 | 0,0050 | |||
| TXT / Textron Inc. | 0,04 | -23,76 | 3,16 | -11,91 | 0,3701 | -0,0330 | |||
| VEA / Vanguard Tax-Managed Funds - Vanguard FTSE Developed Markets ETF | 0,07 | 0,00 | 3,01 | -5,34 | 0,3534 | -0,0048 | |||
| SHV / iShares Trust - iShares Short Treasury Bond ETF | 0,03 | -1,47 | 2,77 | -1,42 | 0,3247 | 0,0086 | |||
| VRTX / Vertex Pharmaceuticals Incorporated | 0,01 | -1,90 | 2,69 | -3,06 | 0,3156 | 0,0032 | |||
| BX / Blackstone Inc. | 0,02 | -7,21 | 2,55 | 6,92 | 0,2991 | 0,0307 | |||
| CRL / Charles River Laboratories International, Inc. | 0,01 | -0,43 | 2,48 | -7,22 | 0,2907 | -0,0098 | |||
| RVTY / Revvity, Inc. | 0,02 | -0,14 | 2,43 | -6,95 | 0,2844 | -0,0088 | |||
| FLEX / Flex Ltd. | 0,09 | -0,49 | 2,42 | -2,89 | 0,2836 | 0,0035 | |||
| MAS / Masco Corporation | 0,05 | -0,77 | 2,41 | -7,56 | 0,2825 | -0,0107 | |||
| AL / Air Lease Corporation | 0,06 | -1,03 | 2,40 | -6,79 | 0,2817 | -0,0083 | |||
| BWXT / BWX Technologies, Inc. | 0,03 | 70,19 | 2,32 | 78,31 | 0,2718 | 0,1255 | |||
| SNPS / Synopsys, Inc. | 0,01 | -2,95 | 2,31 | 2,30 | 0,2710 | 0,0168 | |||
| CSX / CSX Corporation | 0,08 | -2,57 | 2,31 | -12,11 | 0,2705 | -0,0249 | |||
| GPC / Genuine Parts Company | 0,02 | -0,91 | 2,29 | -15,47 | 0,2685 | -0,0362 | |||
| ONTO / Onto Innovation Inc. | 0,02 | -0,24 | 2,28 | 9,20 | 0,2671 | 0,0325 | |||
| ITT / ITT Inc. | 0,02 | -0,71 | 2,27 | 4,32 | 0,2660 | 0,0213 | |||
| NVT / nVent Electric plc | 0,04 | -0,20 | 2,17 | 2,36 | 0,2542 | 0,0159 | |||
| NDAQ / Nasdaq, Inc. | 0,04 | -0,66 | 2,15 | -3,19 | 0,2523 | 0,0023 | |||
| HXL / Hexcel Corporation | 0,03 | 67,02 | 2,12 | 43,12 | 0,2487 | 0,0820 | |||
| GPK / Graphic Packaging Holding Company | 0,09 | 71,58 | 2,07 | 59,05 | 0,2432 | 0,0965 | |||
| AMAT / Applied Materials, Inc. | 0,01 | -1,69 | 2,02 | -5,83 | 0,2369 | -0,0045 | |||
| DGX / Quest Diagnostics Incorporated | 0,02 | -1,12 | 1,98 | -14,30 | 0,2327 | -0,0278 | |||
| JPM / JPMorgan Chase & Co. | 0,01 | 8,52 | 1,95 | 8,17 | 0,2284 | 0,0259 | |||
| BRKR / Bruker Corporation | 0,03 | -1,00 | 1,92 | -16,55 | 0,2247 | -0,0337 | |||
| ROP / Roper Technologies, Inc. | 0,00 | -1,36 | 1,83 | -0,65 | 0,2144 | 0,0074 | |||
| PAYX / Paychex, Inc. | 0,01 | -2,91 | 1,71 | 0,06 | 0,2008 | 0,0083 | |||
| GD / General Dynamics Corporation | 0,01 | -1,74 | 1,71 | 0,94 | 0,2007 | 0,0099 | |||
| WSM / Williams-Sonoma, Inc. | 0,01 | -2,00 | 1,71 | 21,69 | 0,2007 | 0,0425 | |||
| XOM / Exxon Mobil Corporation | 0,01 | -0,67 | 1,68 | 8,96 | 0,1968 | 0,0234 | |||
| FFIV / F5, Inc. | 0,01 | -0,90 | 1,65 | 9,17 | 0,1940 | 0,0235 | |||
| CVX / Chevron Corporation | 0,01 | -13,59 | 1,63 | -7,40 | 0,1908 | -0,0069 | |||
| TER / Teradyne, Inc. | 0,02 | 0,43 | 1,63 | -9,36 | 0,1908 | -0,0112 | |||
| ULTA / Ulta Beauty, Inc. | 0,00 | -2,41 | 1,62 | -17,16 | 0,1897 | -0,0300 | |||
| MLM / Martin Marietta Materials, Inc. | 0,00 | -0,13 | 1,58 | -11,19 | 0,1852 | -0,0149 | |||
| DAR / Darling Ingredients Inc. | 0,03 | -3,42 | 1,50 | -20,97 | 0,1759 | -0,0376 | |||
| WWD / Woodward, Inc. | 0,01 | -0,46 | 1,49 | 3,99 | 0,1743 | 0,0135 | |||
| KO / The Coca-Cola Company | 0,03 | -1,07 | 1,48 | -8,03 | 0,1733 | -0,0075 | |||
| BMY / Bristol-Myers Squibb Company | 0,02 | -0,60 | 1,43 | -9,76 | 0,1680 | -0,0107 | |||
| TXN / Texas Instruments Incorporated | 0,01 | -1,35 | 1,35 | -12,89 | 0,1585 | -0,0160 | |||
| PFE / Pfizer Inc. | 0,04 | -0,14 | 1,32 | -9,70 | 0,1550 | -0,0097 | |||
| UNP / Union Pacific Corporation | 0,01 | -1,89 | 1,32 | -2,37 | 0,1548 | 0,0027 | |||
| KMB / Kimberly-Clark Corporation | 0,01 | -0,39 | 1,23 | -12,77 | 0,1442 | -0,0145 | |||
| TFX / Teleflex Incorporated | 0,01 | -0,98 | 1,15 | -19,65 | 0,1348 | -0,0262 | |||
| DOW / Dow Inc. | 0,02 | -1,21 | 1,14 | -4,37 | 0,1336 | -0,0004 | |||
| PHM / PulteGroup, Inc. | 0,02 | -0,64 | 1,12 | -5,31 | 0,1317 | -0,0017 | |||
| C / Citigroup Inc. | 0,03 | 0,00 | 1,12 | -10,73 | 0,1308 | -0,0097 | |||
| GIS / General Mills, Inc. | 0,02 | -0,53 | 1,09 | -16,97 | 0,1273 | -0,0199 | |||
| JNJ / Johnson & Johnson | 0,01 | 0,12 | 1,08 | -5,74 | 0,1270 | -0,0023 | |||
| HII / Huntington Ingalls Industries, Inc. | 0,01 | -0,18 | 1,05 | -10,21 | 0,1227 | -0,0085 | |||
| BA / The Boeing Company | 0,01 | -1,25 | 1,03 | -10,38 | 0,1204 | -0,0085 | |||
| AEP / American Electric Power Company, Inc. | 0,01 | -1,45 | 1,01 | -11,99 | 0,1180 | -0,0106 | |||
| VWO / Vanguard International Equity Index Funds - Vanguard FTSE Emerging Markets ETF | 0,03 | 0,00 | 1,01 | -3,64 | 0,1179 | 0,0005 | |||
| KBR / KBR, Inc. | 0,02 | -0,90 | 0,97 | -10,16 | 0,1141 | -0,0078 | |||
| BWA / BorgWarner Inc. | 0,02 | -5,28 | 0,97 | -21,83 | 0,1134 | -0,0258 | |||
| BOOT / Boot Barn Holdings, Inc. | 0,01 | -0,65 | 0,93 | -4,71 | 0,1090 | -0,0008 | |||
| SO / The Southern Company | 0,01 | 0,35 | 0,92 | -7,47 | 0,1075 | -0,0041 | |||
| KTOS / Kratos Defense & Security Solutions, Inc. | 0,06 | 0,91 | 0,1071 | 0,1071 | |||||
| TGT / Target Corporation | 0,01 | 0,90 | 0,1051 | 0,1051 | |||||
| PSA / Public Storage | 0,00 | -2,37 | 0,89 | -11,88 | 0,1044 | -0,0092 | |||
| CCJ / Cameco Corporation | 0,02 | 0,87 | 0,1022 | 0,1022 | |||||
| TSEM / Tower Semiconductor Ltd. | 0,03 | -6,11 | 0,86 | -38,54 | 0,1006 | -0,0564 | |||
| VZ / Verizon Communications Inc. | 0,03 | -0,04 | 0,86 | -12,91 | 0,1006 | -0,0102 | |||
| HSY / The Hershey Company | 0,00 | -38,33 | 0,84 | -50,59 | 0,0989 | -0,0931 | |||
| ETN / Eaton Corporation plc | 0,00 | -2,92 | 0,79 | 2,98 | 0,0932 | 0,0063 | |||
| GXO / GXO Logistics, Inc. | 0,01 | -5,52 | 0,77 | -11,77 | 0,0905 | -0,0079 | |||
| MKSI / MKS Inc. | 0,01 | -5,19 | 0,64 | -24,14 | 0,0752 | -0,0199 | |||
| DLR / Digital Realty Trust, Inc. | 0,00 | 0,57 | 0,0668 | 0,0668 | |||||
| DELL / Dell Technologies Inc. | 0,01 | 0,57 | 0,0666 | 0,0666 | |||||
| MMM / 3M Company | 0,01 | 1,97 | 0,53 | -4,51 | 0,0620 | -0,0004 | |||
| ENBBF / Enbridge Inc - FR PRF PERPETUAL USD 25 - Ser J | 0,02 | -1,85 | 0,50 | -12,08 | 0,0589 | -0,0054 | |||
| ABBV / AbbVie Inc. | 0,00 | -2,54 | 0,40 | 7,82 | 0,0469 | 0,0052 | |||
| MS / Morgan Stanley | 0,00 | 51,72 | 0,36 | 45,34 | 0,0421 | 0,0143 | |||
| NVS / Novartis AG - Depositary Receipt (Common Stock) | 0,00 | 3,15 | 0,33 | 4,06 | 0,0391 | 0,0031 | |||
| GILD / Gilead Sciences, Inc. | 0,00 | 3,48 | 0,32 | 0,62 | 0,0379 | 0,0018 | |||
| CSCO / Cisco Systems, Inc. | 0,01 | -1,33 | 0,32 | 2,58 | 0,0373 | 0,0024 | |||
| IRM / Iron Mountain Incorporated | 0,00 | 3,22 | 0,29 | 7,78 | 0,0342 | 0,0038 | |||
| JEF / Jefferies Financial Group Inc. | 0,01 | 3,77 | 0,26 | 14,78 | 0,0310 | 0,0050 | |||
| K / Kellanova | 0,00 | 5,21 | 0,26 | -7,04 | 0,0310 | -0,0010 | |||
| HR / Healthcare Realty Trust Incorporated | 0,02 | 4,47 | 0,25 | -15,61 | 0,0299 | -0,0040 | |||
| AMD / Advanced Micro Devices, Inc. | 0,00 | -17,24 | 0,25 | -25,45 | 0,0289 | -0,0082 | |||
| SPY / SPDR S&P 500 ETF | 0,00 | -5,73 | 0,25 | -8,89 | 0,0289 | -0,0016 | |||
| NI / NiSource Inc. | 0,01 | 4,58 | 0,23 | -5,83 | 0,0266 | -0,0004 | |||
| TRN / Trinity Industries, Inc. | 0,01 | 4,99 | 0,22 | -0,46 | 0,0256 | 0,0009 | |||
| FLO / Flowers Foods, Inc. | 0,01 | 5,08 | 0,22 | -6,47 | 0,0255 | -0,0006 | |||
| QQQ / Invesco QQQ Trust, Series 1 | 0,00 | 0,21 | 0,0251 | 0,0251 | |||||
| XBI / SPDR Series Trust - SPDR S&P Biotech ETF | 0,00 | 13,46 | 0,21 | -0,48 | 0,0242 | 0,0009 | |||
| IRT / Independence Realty Trust, Inc. | 0,01 | 6,70 | 0,15 | -18,03 | 0,0177 | -0,0029 | |||
| BB / BlackBerry Limited | 0,02 | 6,85 | 0,07 | -8,75 | 0,0086 | -0,0005 | |||
| TKR / The Timken Company | 0,00 | -100,00 | 0,00 | -100,00 | -0,1163 | ||||
| BLMN / Bloomin' Brands, Inc. | 0,00 | -100,00 | 0,00 | -100,00 | -0,1410 | ||||
| FITB / Fifth Third Bancorp | 0,00 | -100,00 | 0,00 | -100,00 | -0,1162 | ||||
| CTVA / Corteva, Inc. | 0,00 | -100,00 | 0,00 | -100,00 | -0,1541 | ||||
| FMC / FMC Corporation | 0,00 | -100,00 | 0,00 | -100,00 | -0,1050 | ||||
| RSPT / Invesco Exchange-Traded Fund Trust - Invesco S&P 500 Equal Weight Technology ETF | 0,00 | -100,00 | 0,00 | -100,00 | -0,0341 |