Statistiques de base
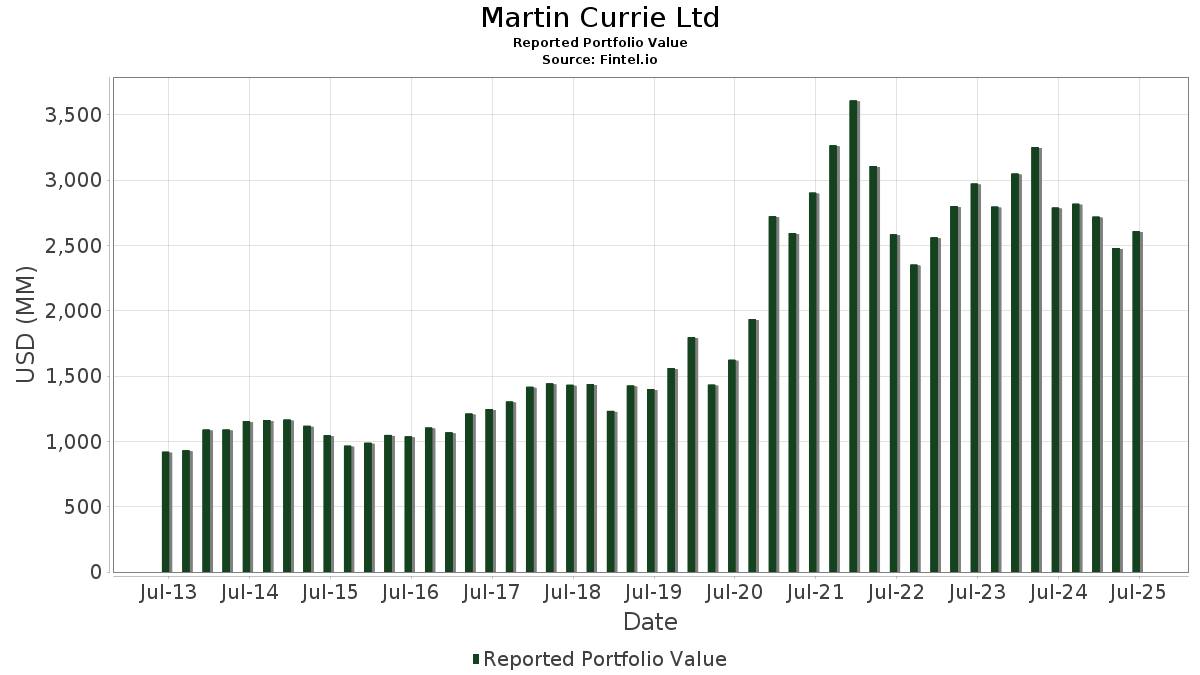
| Valeur du portefeuille | $ 2 607 623 617 |
| Positions actuelles | 51 |
Dernières positions, performances, ASG (à partir des dépôts 13F, 13D)
Martin Currie Ltd a déclaré un total de 51 positions dans ses derniers dépôts auprès de la SEC. La valeur la plus récente du portefeuille est calculée à 2 607 623 617 USD. Les actifs sous gestion réels (ASG) sont cette valeur plus les liquidités (qui ne sont pas divulguées). Les principales positions de Martin Currie Ltd sont Taiwan Semiconductor Manufacturing Company Limited - Depositary Receipt (Common Stock) (US:TSM) , HDFC Bank Limited - Depositary Receipt (Common Stock) (US:HDB) , Ferrari N.V. (US:RACE) , Microsoft Corporation (US:MSFT) , and NVIDIA Corporation (US:NVDA) . Les nouvelles positions de Martin Currie Ltd incluent Inter & Co, Inc. (US:INTR) , UL Solutions Inc. (US:ULS) , .
Meilleures augmentations ce trimestre
Nous utilisons la variation de l'allocation du portefeuille car il s'agit de l'indicateur le plus significatif. Les changements peuvent être dus à des transactions ou à des variations de prix des actions.
| Titre | Actions (en millions) |
Valeur ($ en millions) |
% du portefeuille | ΔPortefeuille % |
|---|---|---|---|---|
| 3,77 | 28,04 | 1,0753 | 1,0753 | |
| 0,04 | 95,18 | 3,6499 | 0,7095 | |
| 2,84 | 217,66 | 8,3471 | 0,6498 | |
| 0,33 | 165,56 | 4,5214 | 0,4365 | |
| 0,15 | 54,47 | 2,0888 | 0,1654 | |
| 0,20 | 62,54 | 2,3984 | 0,1545 | |
| 1,40 | 53,79 | 1,4690 | 0,1434 | |
| 0,14 | 35,12 | 1,3469 | 0,0746 | |
| 0,09 | 8,25 | 0,3164 | 0,0546 | |
| 0,05 | 8,55 | 0,3279 | 0,0530 |
Principales baisses ce trimestre
Nous utilisons la variation de l'allocation du portefeuille car il s'agit de l'indicateur le plus significatif. Les changements peuvent être dus à des transactions ou à des variations de prix des actions.
| Titre | Actions (en millions) |
Valeur ($ en millions) |
% du portefeuille | ΔPortefeuille % |
|---|---|---|---|---|
| 1,31 | 149,13 | 4,0726 | -3,5323 | |
| 1,10 | 248,99 | 6,7998 | -1,9219 | |
| 0,37 | 182,63 | 4,9874 | -1,7366 | |
| 0,56 | 32,58 | 0,8897 | -1,6398 | |
| 4,08 | 137,19 | 3,7465 | -1,5627 | |
| 0,33 | 68,64 | 1,8745 | -1,1896 | |
| 0,16 | 88,44 | 2,4152 | -1,1519 | |
| 0,14 | 13,16 | 0,3594 | -1,0452 | |
| 0,05 | 64,13 | 1,7513 | -1,0106 | |
| 1,12 | 36,53 | 1,4008 | -0,9573 |
Déclarations 13F et dépôts de fonds
Ce formulaire a été déposé le 2025-08-12 pour la période de déclaration 2025-06-30. Cliquez sur l'icône du lien pour voir l'historique complet des transactions.
Mettre à niveau pour débloquer les données premium et exporter vers Excel ![]() .
.
| Titre | Type | Prix moyen de l'action | Actions (en millions) |
ΔActions (%) |
ΔActions (%) |
Valeur ($ en millions) |
Portefeuille (%) |
ΔPortefeuille (%) |
|
|---|---|---|---|---|---|---|---|---|---|
| TSM / Taiwan Semiconductor Manufacturing Company Limited - Depositary Receipt (Common Stock) | 1,10 | -15,61 | 248,99 | 15,14 | 6,7998 | -1,9219 | |||
| HDB / HDFC Bank Limited - Depositary Receipt (Common Stock) | 2,84 | -1,17 | 217,66 | 14,04 | 8,3471 | 0,6498 | |||
| RACE / Ferrari N.V. | 0,37 | -4,46 | 182,63 | 9,54 | 4,9874 | -1,7366 | |||
| MSFT / Microsoft Corporation | 0,33 | 23,36 | 165,56 | 63,46 | 4,5214 | 0,4365 | |||
| NVDA / NVIDIA Corporation | 0,96 | -9,22 | 152,42 | 32,33 | 4,1624 | -0,4827 | |||
| BABA / Alibaba Group Holding Limited - Depositary Receipt (Common Stock) | 1,31 | -7,79 | 149,13 | -20,92 | 4,0726 | -3,5323 | |||
| LIN / Linde plc | 0,31 | -3,37 | 147,48 | -2,64 | 5,6558 | -0,4531 | |||
| IBN / ICICI Bank Limited - Depositary Receipt (Common Stock) | 4,08 | -2,36 | 137,19 | 4,21 | 3,7465 | -1,5627 | |||
| MELI / MercadoLibre, Inc. | 0,04 | -2,56 | 95,18 | 30,54 | 3,6499 | 0,7095 | |||
| MA / Mastercard Incorporated | 0,16 | -2,47 | 88,44 | -0,01 | 2,4152 | -1,1519 | |||
| META / Meta Platforms, Inc. | 0,12 | -2,20 | 85,67 | 25,24 | 2,3395 | -0,4191 | |||
| VEEV / Veeva Systems Inc. | 0,24 | -3,43 | 68,99 | 20,06 | 1,8842 | -0,4334 | |||
| AAPL / Apple Inc. | 0,33 | -2,19 | 68,64 | -9,66 | 1,8745 | -1,1896 | |||
| MTD / Mettler-Toledo International Inc. | 0,05 | -5,86 | 64,13 | -6,36 | 1,7513 | -1,0106 | |||
| CDNS / Cadence Design Systems, Inc. | 0,20 | -7,23 | 62,54 | 12,40 | 2,3984 | 0,1545 | |||
| ADSK / Autodesk, Inc. | 0,18 | -22,72 | 56,54 | -8,62 | 1,5441 | -0,9513 | |||
| V / Visa Inc. | 0,15 | 12,73 | 54,47 | 14,21 | 2,0888 | 0,1654 | |||
| KSA / iShares Trust - iShares MSCI Saudi Arabia ETF | 1,40 | 75,67 | 53,79 | 63,66 | 1,4690 | 0,1434 | |||
| ZTS / Zoetis Inc. | 0,31 | 2,91 | 48,64 | -2,53 | 1,3282 | -0,6842 | |||
| IDXX / IDEXX Laboratories, Inc. | 0,08 | 3,84 | 44,12 | 32,62 | 1,2048 | -0,1368 | |||
| AMZN / Amazon.com, Inc. | 0,20 | -0,77 | 42,87 | 14,42 | 1,1708 | -0,3403 | |||
| JD / JD.com, Inc. - Depositary Receipt (Common Stock) | 1,12 | -21,30 | 36,53 | -37,53 | 1,4008 | -0,9573 | |||
| DECK / Deckers Outdoor Corporation | 0,35 | -2,34 | 35,85 | -9,98 | 0,9792 | -0,6271 | |||
| RMD / ResMed Inc. | 0,14 | -3,41 | 35,12 | 11,33 | 1,3469 | 0,0746 | |||
| MMYT / MakeMyTrip Limited | 0,34 | -3,14 | 33,18 | -3,11 | 0,9062 | -0,4750 | |||
| CMG / Chipotle Mexican Grill, Inc. | 0,59 | -2,35 | 32,87 | 9,20 | 0,8976 | -0,3163 | |||
| TCOM / Trip.com Group Limited - Depositary Receipt (Common Stock) | 0,56 | -43,68 | 32,58 | -48,06 | 0,8897 | -1,6398 | |||
| INTR / Inter & Co, Inc. | 3,77 | 28,04 | 1,0753 | 1,0753 | |||||
| LLY / Eli Lilly and Company | 0,03 | -0,86 | 26,93 | -6,42 | 1,0327 | -0,1279 | |||
| EPAM / EPAM Systems, Inc. | 0,12 | -2,52 | 21,97 | 2,09 | 0,6000 | -0,2679 | |||
| CRH / CRH plc | 0,18 | -20,48 | 16,85 | -16,21 | 0,4602 | -0,3509 | |||
| SNPS / Synopsys, Inc. | 0,03 | -1,00 | 14,25 | 18,36 | 0,3891 | -0,0964 | |||
| GLOB / Globant S.A. | 0,14 | -51,03 | 13,16 | -62,21 | 0,3594 | -1,0452 | |||
| ANSS / ANSYS, Inc. | 0,03 | -0,59 | 9,48 | 10,29 | 0,2588 | -0,0877 | |||
| AMAT / Applied Materials, Inc. | 0,05 | -0,57 | 8,55 | 25,44 | 0,3279 | 0,0530 | |||
| DXCM / DexCom, Inc. | 0,09 | -0,58 | 8,25 | 27,08 | 0,3164 | 0,0546 | |||
| CPRT / Copart, Inc. | 0,15 | -0,58 | 7,58 | -13,80 | 0,2907 | -0,0639 | |||
| INFY / Infosys Limited - Depositary Receipt (Common Stock) | 0,34 | -58,63 | 6,37 | -57,99 | 0,1740 | -0,4376 | |||
| EWY / iShares, Inc. - iShares MSCI South Korea ETF | 0,02 | -23,11 | 1,16 | 2,21 | 0,0316 | -0,0141 | |||
| FLSA / Franklin Templeton ETF Trust - Franklin FTSE Saudi Arabia ETF | 0,02 | 75,12 | 0,53 | 61,54 | 0,0144 | 0,0012 | |||
| ISRG / Intuitive Surgical, Inc. | 0,00 | -70,96 | 0,47 | -68,19 | 0,0129 | -0,0470 | |||
| IEMG / iShares, Inc. - iShares Core MSCI Emerging Markets ETF | 0,01 | -49,59 | 0,36 | -44,00 | 0,0100 | -0,0163 | |||
| VMI / Valmont Industries, Inc. | 0,00 | -70,87 | 0,34 | -66,70 | 0,0093 | -0,0319 | |||
| ECL / Ecolab Inc. | 0,00 | -75,02 | 0,32 | -73,47 | 0,0087 | -0,0395 | |||
| XYL / Xylem Inc. | 0,00 | -73,76 | 0,31 | -71,65 | 0,0085 | -0,0355 | |||
| RVTY / Revvity, Inc. | 0,00 | -71,57 | 0,29 | -74,05 | 0,0079 | -0,0369 | |||
| TYL / Tyler Technologies, Inc. | 0,00 | -72,52 | 0,27 | -72,06 | 0,0075 | -0,0319 | |||
| DE / Deere & Company | 0,00 | -71,31 | 0,26 | -69,00 | 0,0070 | -0,0264 | |||
| ULS / UL Solutions Inc. | 0,00 | 0,25 | 0,0097 | 0,0097 | |||||
| LRN / Stride, Inc. | 0,00 | -71,23 | 0,24 | -67,08 | 0,0065 | -0,0227 | |||
| VRRM / Verra Mobility Corporation | 0,01 | -70,83 | 0,20 | -67,21 | 0,0055 | -0,0191 | |||
| ILMN / Illumina, Inc. | 0,00 | -100,00 | 0,00 | 0,0000 | |||||
| LULU / lululemon athletica inc. | 0,00 | -100,00 | 0,00 | 0,0000 | |||||
| CSAN / Cosan S.A. - Depositary Receipt (Common Stock) | 0,00 | -100,00 | 0,00 | 0,0000 | |||||
| COUR / Coursera, Inc. | 0,00 | -100,00 | 0,00 | 0,0000 | |||||
| EXPO / Exponent, Inc. | 0,00 | -100,00 | 0,00 | 0,0000 | |||||
| PLNT / Planet Fitness, Inc. | 0,00 | -100,00 | 0,00 | 0,0000 | |||||
| ERII / Energy Recovery, Inc. | 0,00 | -100,00 | 0,00 | 0,0000 |