Statistiques de base
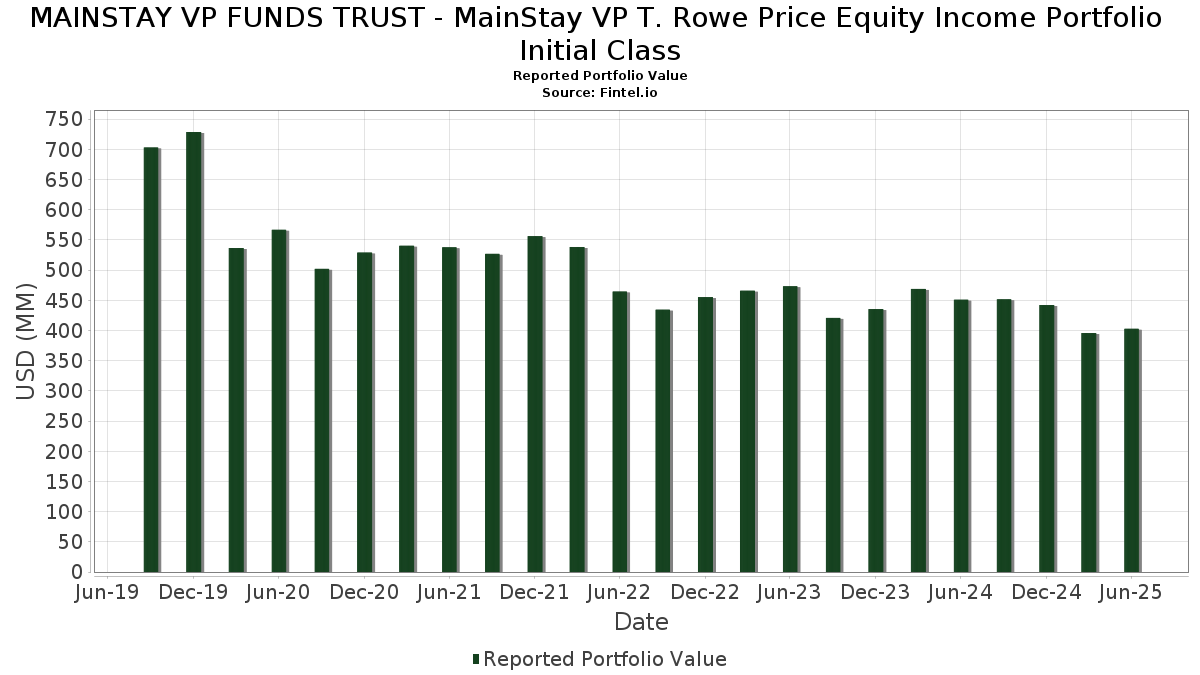
| Valeur du portefeuille | $ 402 772 900 |
| Positions actuelles | 106 |
Dernières positions, performances, ASG (à partir des dépôts 13F, 13D)
MAINSTAY VP FUNDS TRUST - MainStay VP T. Rowe Price Equity Income Portfolio Initial Class a déclaré un total de 106 positions dans ses derniers dépôts auprès de la SEC. La valeur la plus récente du portefeuille est calculée à 402 772 900 USD. Les actifs sous gestion réels (ASG) sont cette valeur plus les liquidités (qui ne sont pas divulguées). Les principales positions de MAINSTAY VP FUNDS TRUST - MainStay VP T. Rowe Price Equity Income Portfolio Initial Class sont Microsoft Corporation (US:MSFT) , NVIDIA Corporation (US:NVDA) , Apple Inc. (US:AAPL) , Alphabet Inc. (US:GOOGL) , and Amazon.com, Inc. (US:AMZN) . Les nouvelles positions de MAINSTAY VP FUNDS TRUST - MainStay VP T. Rowe Price Equity Income Portfolio Initial Class incluent Automatic Data Processing, Inc. (US:ADP) , The Williams Companies, Inc. (US:WMB) , Cencora, Inc. (US:COR) , .
Meilleures augmentations ce trimestre
Nous utilisons la variation de l'allocation du portefeuille car il s'agit de l'indicateur le plus significatif. Les changements peuvent être dus à des transactions ou à des variations de prix des actions.
| Titre | Actions (en millions) |
Valeur ($ en millions) |
% du portefeuille | ΔPortefeuille % |
|---|---|---|---|---|
| 0,18 | 28,44 | 7,0668 | 2,0530 | |
| 0,05 | 13,04 | 3,2394 | 1,1681 | |
| 0,07 | 34,95 | 8,6826 | 1,0744 | |
| 0,01 | 2,32 | 0,5771 | 0,5771 | |
| 0,03 | 2,12 | 0,5263 | 0,5263 | |
| 0,00 | 4,37 | 1,0846 | 0,4730 | |
| 0,02 | 1,88 | 0,4668 | 0,3440 | |
| 0,02 | 11,72 | 2,9126 | 0,3131 | |
| 0,00 | 1,23 | 0,3044 | 0,3044 | |
| 0,12 | 5,59 | 1,3884 | 0,2863 |
Principales baisses ce trimestre
Nous utilisons la variation de l'allocation du portefeuille car il s'agit de l'indicateur le plus significatif. Les changements peuvent être dus à des transactions ou à des variations de prix des actions.
| Titre | Actions (en millions) |
Valeur ($ en millions) |
% du portefeuille | ΔPortefeuille % |
|---|---|---|---|---|
| 0,01 | 2,19 | 0,5449 | -1,3618 | |
| 0,08 | 16,59 | 4,1218 | -0,8730 | |
| 0,10 | 3,37 | 0,8383 | -0,3033 | |
| 0,05 | 1,96 | 0,4879 | -0,2873 | |
| 0,02 | 2,86 | 0,7103 | -0,2450 | |
| 0,03 | 3,62 | 0,8993 | -0,2115 | |
| 0,01 | 4,96 | 1,2324 | -0,2079 | |
| 0,02 | 3,66 | 0,9101 | -0,2047 | |
| 0,01 | 2,69 | 0,6679 | -0,1892 | |
| 0,01 | 2,27 | 0,5647 | -0,1842 |
Déclarations 13F et dépôts de fonds
Ce formulaire a été déposé le 2025-08-25 pour la période de déclaration 2025-06-30. Cliquez sur l'icône du lien pour voir l'historique complet des transactions.
Mettre à niveau pour débloquer les données premium et exporter vers Excel ![]() .
.
| Titre | Type | Prix moyen de l'action | Actions (en millions) |
ΔActions (%) |
ΔActions (%) |
Valeur ($ en millions) |
Portefeuille (%) |
ΔPortefeuille (%) |
|
|---|---|---|---|---|---|---|---|---|---|
| MSFT / Microsoft Corporation | 0,07 | -12,31 | 34,95 | 16,19 | 8,6826 | 1,0744 | |||
| NVDA / NVIDIA Corporation | 0,18 | -1,56 | 28,44 | 43,50 | 7,0668 | 2,0530 | |||
| AAPL / Apple Inc. | 0,08 | -9,04 | 16,59 | -15,99 | 4,1218 | -0,8730 | |||
| GOOGL / Alphabet Inc. | 0,09 | -9,04 | 15,27 | 3,67 | 3,7947 | 0,0678 | |||
| AMZN / Amazon.com, Inc. | 0,07 | -9,36 | 15,24 | 4,52 | 3,7871 | 0,0982 | |||
| AVGO / Broadcom Inc. | 0,05 | -3,29 | 13,04 | 59,23 | 3,2394 | 1,1681 | |||
| META / Meta Platforms, Inc. | 0,02 | -10,92 | 11,72 | 14,07 | 2,9126 | 0,3131 | |||
| MA / Mastercard Incorporated | 0,01 | -6,42 | 7,70 | -4,05 | 1,9126 | -0,1171 | |||
| JPM / JPMorgan Chase & Co. | 0,02 | -20,28 | 6,75 | -5,78 | 1,6775 | -0,1351 | |||
| HD / The Home Depot, Inc. | 0,02 | -7,44 | 5,87 | -7,40 | 1,4572 | -0,1450 | |||
| TSLA / Tesla, Inc. | 0,02 | -6,29 | 5,81 | 14,86 | 1,4438 | 0,1641 | |||
| NEE / NextEra Energy, Inc. | 0,08 | -7,35 | 5,74 | -9,28 | 1,4263 | -0,1742 | |||
| TYIA / Johnson Controls International plc | 0,05 | -7,02 | 5,68 | 22,61 | 1,4105 | 0,2391 | |||
| BAC / Bank of America Corporation | 0,12 | 13,11 | 5,59 | 28,25 | 1,3884 | 0,2863 | |||
| MS / Morgan Stanley | 0,04 | -6,87 | 5,29 | 12,45 | 1,3149 | 0,1243 | |||
| IBM / International Business Machines Corporation | 0,02 | 3,95 | 5,27 | 23,22 | 1,3083 | 0,2274 | |||
| ADI / Analog Devices, Inc. | 0,02 | 0,79 | 5,11 | 18,95 | 1,2695 | 0,1830 | |||
| LLY / Eli Lilly and Company | 0,01 | -7,70 | 4,96 | -12,88 | 1,2324 | -0,2079 | |||
| PG / The Procter & Gamble Company | 0,03 | -4,64 | 4,92 | -10,86 | 1,2223 | -0,1736 | |||
| SPGI / S&P Global Inc. | 0,01 | -6,68 | 4,60 | -3,16 | 1,1418 | -0,0586 | |||
| CDNS / Cadence Design Systems, Inc. | 0,01 | -6,72 | 4,58 | 13,00 | 1,1381 | 0,1129 | |||
| NFLX / Netflix, Inc. | 0,00 | 25,72 | 4,37 | 80,52 | 1,0846 | 0,4730 | |||
| LIN / Linde plc | 0,01 | -7,51 | 4,35 | -6,80 | 1,0795 | -0,0998 | |||
| TJX / The TJX Companies, Inc. | 0,03 | -6,08 | 4,27 | -4,79 | 1,0611 | -0,0734 | |||
| V / Visa Inc. | 0,01 | 1,47 | 4,20 | 2,79 | 1,0425 | 0,0100 | |||
| EQIX / Equinix, Inc. | 0,00 | -11,87 | 3,87 | -14,03 | 0,9609 | -0,1769 | |||
| ABBV / AbbVie Inc. | 0,02 | -6,18 | 3,66 | -16,88 | 0,9101 | -0,2047 | |||
| PLD / Prologis, Inc. | 0,03 | -12,34 | 3,62 | -17,58 | 0,8993 | -0,2115 | |||
| ACN / Accenture plc | 0,01 | -4,84 | 3,60 | -8,84 | 0,8939 | -0,1045 | |||
| DHR / Danaher Corporation | 0,02 | -6,85 | 3,58 | -10,23 | 0,8897 | -0,1195 | |||
| RF / Regions Financial Corporation | 0,15 | -6,75 | 3,53 | 0,92 | 0,8763 | -0,0076 | |||
| MSI / Motorola Solutions, Inc. | 0,01 | 0,55 | 3,43 | -3,43 | 0,8534 | -0,0463 | |||
| CI / The Cigna Group | 0,01 | -6,97 | 3,42 | -6,51 | 0,8488 | -0,0756 | |||
| SLB / Schlumberger Limited | 0,10 | -7,55 | 3,37 | -25,26 | 0,8383 | -0,3033 | |||
| ETN / Eaton Corporation plc | 0,01 | -13,86 | 3,29 | 13,13 | 0,8181 | 0,0819 | |||
| AXP / American Express Company | 0,01 | -8,04 | 3,25 | 9,03 | 0,8072 | 0,0534 | |||
| LNG / Cheniere Energy, Inc. | 0,01 | 0,00 | 3,23 | 5,22 | 0,8014 | 0,0261 | |||
| XYL / Xylem Inc. | 0,02 | -5,03 | 3,22 | 2,81 | 0,7992 | 0,0080 | |||
| HLT / Hilton Worldwide Holdings Inc. | 0,01 | -7,50 | 3,12 | 8,27 | 0,7745 | 0,0462 | |||
| MET / MetLife, Inc. | 0,04 | -3,89 | 3,12 | -3,74 | 0,7745 | -0,0446 | |||
| SYY / Sysco Corporation | 0,04 | -5,02 | 3,10 | -4,15 | 0,7696 | -0,0477 | |||
| COST / Costco Wholesale Corporation | 0,00 | -7,21 | 3,07 | -2,88 | 0,7624 | -0,0368 | |||
| ZTS / Zoetis Inc. | 0,02 | 3,62 | 3,03 | -1,85 | 0,7517 | -0,0281 | |||
| ISRG / Intuitive Surgical, Inc. | 0,01 | -8,01 | 2,99 | 0,95 | 0,7427 | -0,0065 | |||
| ECL / Ecolab Inc. | 0,01 | -7,90 | 2,99 | -2,13 | 0,7426 | -0,0298 | |||
| HON / Honeywell International Inc. | 0,01 | -8,35 | 2,99 | 0,78 | 0,7423 | -0,0075 | |||
| PEP / PepsiCo, Inc. | 0,02 | -14,04 | 2,86 | -24,31 | 0,7103 | -0,2450 | |||
| CMI / Cummins Inc. | 0,01 | -18,99 | 2,77 | -15,35 | 0,6893 | -0,1398 | |||
| AMP / Ameriprise Financial, Inc. | 0,01 | -8,10 | 2,77 | 1,32 | 0,6889 | -0,0033 | |||
| IDXX / IDEXX Laboratories, Inc. | 0,01 | -5,29 | 2,75 | 20,95 | 0,6829 | 0,1081 | |||
| UNP / Union Pacific Corporation | 0,01 | -18,54 | 2,69 | -20,66 | 0,6679 | -0,1892 | |||
| BLK / BlackRock, Inc. | 0,00 | -8,78 | 2,68 | 1,13 | 0,6666 | -0,0045 | |||
| TSCO / Tractor Supply Company | 0,05 | -4,38 | 2,66 | -8,43 | 0,6617 | -0,0739 | |||
| BKNG / Booking Holdings Inc. | 0,00 | -4,45 | 2,61 | 20,06 | 0,6487 | 0,0987 | |||
| WDAY / Workday, Inc. | 0,01 | -8,11 | 2,52 | -5,58 | 0,6266 | -0,0490 | |||
| CMG / Chipotle Mexican Grill, Inc. | 0,04 | -9,27 | 2,52 | 1,49 | 0,6259 | -0,0021 | |||
| UBER / Uber Technologies, Inc. | 0,03 | -12,82 | 2,45 | 11,64 | 0,6080 | 0,0535 | |||
| ASML / ASML Holding N.V. | 0,00 | -9,39 | 2,34 | 9,29 | 0,5814 | 0,0398 | |||
| VRTX / Vertex Pharmaceuticals Incorporated | 0,01 | 12,30 | 2,33 | 3,10 | 0,5778 | 0,0073 | |||
| ADP / Automatic Data Processing, Inc. | 0,01 | 2,32 | 0,5771 | 0,5771 | |||||
| ICE / Intercontinental Exchange, Inc. | 0,01 | -5,01 | 2,29 | 1,02 | 0,5679 | -0,0044 | |||
| TMO / Thermo Fisher Scientific Inc. | 0,01 | -5,78 | 2,27 | -23,21 | 0,5647 | -0,1842 | |||
| ANET / Arista Networks Inc | 0,02 | -5,26 | 2,26 | 25,10 | 0,5625 | 0,1047 | |||
| KKR / KKR & Co. Inc. | 0,02 | -10,62 | 2,24 | 2,84 | 0,5572 | 0,0057 | |||
| DE / Deere & Company | 0,00 | -4,35 | 2,23 | 3,62 | 0,5550 | 0,0097 | |||
| PGR / The Progressive Corporation | 0,01 | -4,32 | 2,23 | -9,78 | 0,5549 | -0,0713 | |||
| MMC / Marsh & McLennan Companies, Inc. | 0,01 | -5,78 | 2,20 | -15,57 | 0,5472 | -0,1127 | |||
| FI / Fiserv, Inc. | 0,01 | 10,19 | 2,20 | -13,97 | 0,5465 | -0,1002 | |||
| UNH / UnitedHealth Group Incorporated | 0,01 | -51,15 | 2,19 | -70,90 | 0,5449 | -1,3618 | |||
| PH / Parker-Hannifin Corporation | 0,00 | -29,32 | 2,14 | -18,79 | 0,5326 | -0,1350 | |||
| WMB / The Williams Companies, Inc. | 0,03 | 2,12 | 0,5263 | 0,5263 | |||||
| CHD / Church & Dwight Co., Inc. | 0,02 | -5,45 | 2,03 | -17,48 | 0,5056 | -0,1180 | |||
| BALL / Ball Corporation | 0,04 | 17,34 | 2,01 | 26,42 | 0,4994 | 0,0972 | |||
| CRWD / CrowdStrike Holdings, Inc. | 0,00 | -16,74 | 2,00 | 20,31 | 0,4960 | 0,0762 | |||
| VZ / Verizon Communications Inc. | 0,05 | -32,83 | 1,96 | -35,93 | 0,4879 | -0,2873 | |||
| CRM / Salesforce, Inc. | 0,01 | -10,66 | 1,96 | -9,21 | 0,4873 | -0,0592 | |||
| DT / Dynatrace, Inc. | 0,03 | 8,87 | 1,93 | 27,51 | 0,4790 | 0,0965 | |||
| URI / United Rentals, Inc. | 0,00 | -6,31 | 1,88 | 12,65 | 0,4670 | 0,0449 | |||
| GILD / Gilead Sciences, Inc. | 0,02 | 52,05 | 1,88 | 183,69 | 0,4668 | 0,3440 | |||
| FERG / Ferguson Enterprises Inc. | 0,01 | -7,49 | 1,84 | 25,72 | 0,4568 | 0,0869 | |||
| CPRT / Copart, Inc. | 0,04 | 40,40 | 1,74 | 21,82 | 0,4328 | 0,0709 | |||
| GEV / GE Vernova Inc. | 0,00 | -6,76 | 1,74 | 61,73 | 0,4316 | 0,1597 | |||
| CDW / CDW Corporation | 0,01 | -11,90 | 1,70 | -1,85 | 0,4216 | -0,0156 | |||
| MRK / Merck & Co., Inc. | 0,02 | -6,97 | 1,63 | -17,97 | 0,4051 | -0,0976 | |||
| LKQ / LKQ Corporation | 0,04 | -6,19 | 1,61 | -18,39 | 0,4003 | -0,0991 | |||
| CL / Colgate-Palmolive Company | 0,02 | -7,45 | 1,55 | -10,25 | 0,3853 | -0,0516 | |||
| NOW / ServiceNow, Inc. | 0,00 | -7,21 | 1,55 | 19,83 | 0,3844 | 0,0578 | |||
| FDX / FedEx Corporation | 0,01 | -8,13 | 1,34 | -14,30 | 0,3320 | -0,0626 | |||
| A / Agilent Technologies, Inc. | 0,01 | -8,31 | 1,32 | -7,48 | 0,3287 | -0,0331 | |||
| COR / Cencora, Inc. | 0,00 | 1,23 | 0,3044 | 0,3044 | |||||
| AMAT / Applied Materials, Inc. | 0,01 | -37,70 | 1,13 | -21,40 | 0,2811 | -0,0831 | |||
| BMY / Bristol-Myers Squibb Company | 0,02 | 0,00 | 1,09 | -24,11 | 0,2708 | -0,0924 | |||
| MDB / MongoDB, Inc. | 0,00 | -10,91 | 0,99 | 6,69 | 0,2459 | 0,0112 | |||
| KMX / CarMax, Inc. | 0,01 | -11,15 | 0,97 | -23,37 | 0,2422 | -0,0795 | |||
| DECK / Deckers Outdoor Corporation | 0,01 | 16,35 | 0,96 | 7,27 | 0,2383 | 0,0121 | |||
| ARM / Arm Holdings plc - Depositary Receipt (Common Stock) | 0,01 | -12,75 | 0,90 | 32,11 | 0,2230 | 0,0512 | |||
| EOG / EOG Resources, Inc. | 0,01 | -37,39 | 0,76 | -41,62 | 0,1897 | -0,1410 | |||
| ABNB / Airbnb, Inc. | 0,01 | -13,20 | 0,75 | -3,83 | 0,1873 | -0,0110 | |||
| FWONK / Formula One Group | 0,01 | -15,35 | 0,69 | -1,85 | 0,1717 | -0,0062 | |||
| 56064L488 / MainStay US Government Liquidity Fund | 0,66 | -30,48 | 0,66 | -30,53 | 0,1642 | -0,0763 | |||
| SBAC / SBA Communications Corporation | 0,00 | 0,59 | 0,1460 | 0,1460 | |||||
| US8252528851 / Invesco Government & Agency Portfolio, Institutional Class | 0,00 | -99,27 | 0,00 | -99,38 | 0,0012 | -0,1627 | |||
| Forward Foreign Currency Contract / DFE (N/A) | -0,01 | -0,0026 | -0,0026 | ||||||
| Forward Foreign Currency Contract / DFE (N/A) | -0,01 | -0,0026 | -0,0026 | ||||||
| Forward Foreign Currency Contract / DFE (N/A) | -0,01 | -0,0027 | -0,0027 | ||||||
| Forward Foreign Currency Contract / DFE (N/A) | -0,01 | -0,0027 | -0,0027 |