Statistiques de base
| Gestionnaire | Hamish Douglass |
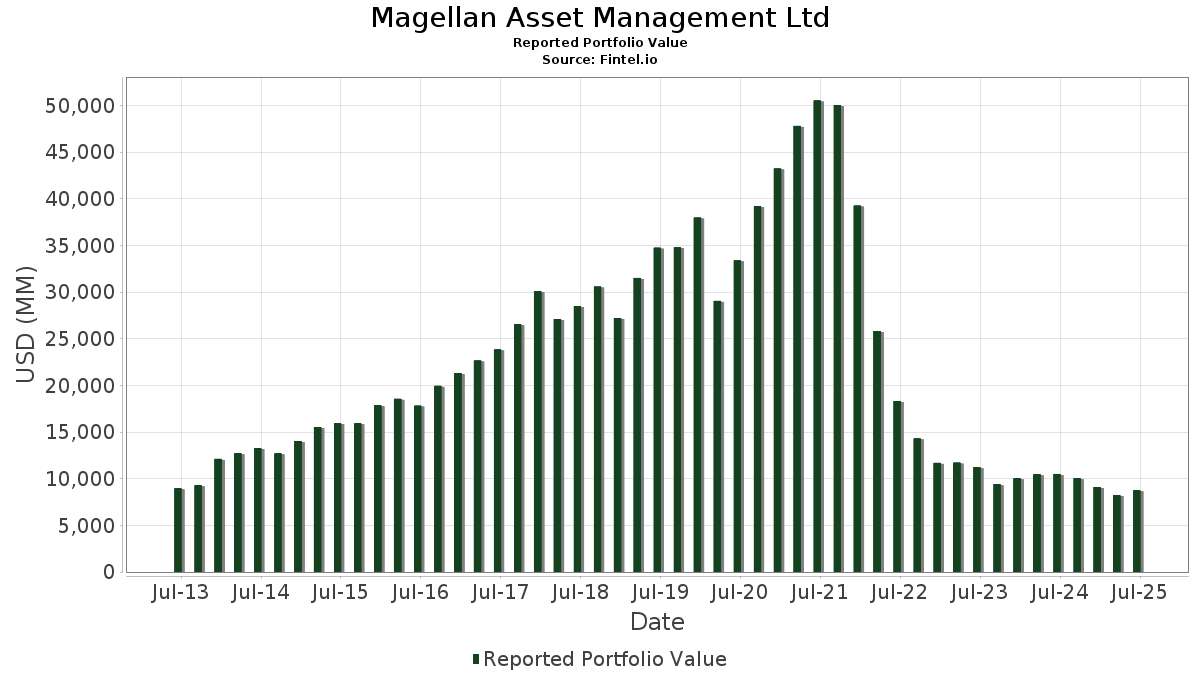
| Valeur du portefeuille | $ 8 748 475 403 |
| Positions actuelles | 84 |
Dernières positions, performances, ASG (à partir des dépôts 13F, 13D)
Magellan Asset Management Ltd a déclaré un total de 84 positions dans ses derniers dépôts auprès de la SEC. Le(s) gestionnaire(s) de portefeuille sont répertoriés comme Hamish Douglass. La valeur la plus récente du portefeuille est calculée à 8 748 475 403 USD. Les actifs sous gestion réels (ASG) sont cette valeur plus les liquidités (qui ne sont pas divulguées). Les principales positions de Magellan Asset Management Ltd sont Microsoft Corporation (US:MSFT) , Amazon.com, Inc. (US:AMZN) , Meta Platforms, Inc. (US:META) , Eversource Energy (US:ES) , and Taiwan Semiconductor Manufacturing Company Limited - Depositary Receipt (Common Stock) (US:TSM) .
Meilleures augmentations ce trimestre
Nous utilisons la variation de l'allocation du portefeuille car il s'agit de l'indicateur le plus significatif. Les changements peuvent être dus à des transactions ou à des variations de prix des actions.
| Titre | Actions (en millions) |
Valeur ($ en millions) |
% du portefeuille | ΔPortefeuille % |
|---|---|---|---|---|
| 0,31 | 175,91 | 2,0108 | 2,0108 | |
| 2,36 | 162,98 | 1,8630 | 1,7325 | |
| 0,49 | 133,97 | 1,5314 | 1,5302 | |
| 1,93 | 436,15 | 4,9855 | 1,3478 | |
| 0,63 | 468,06 | 5,3502 | 1,2039 | |
| 3,15 | 691,93 | 7,9091 | 0,9033 | |
| 1,71 | 272,50 | 3,1148 | 0,7501 | |
| 1,94 | 137,52 | 1,5719 | 0,6866 | |
| 2,31 | 341,84 | 3,9074 | 0,6594 | |
| 0,96 | 43,27 | 0,4946 | 0,4828 |
Principales baisses ce trimestre
Nous utilisons la variation de l'allocation du portefeuille car il s'agit de l'indicateur le plus significatif. Les changements peuvent être dus à des transactions ou à des variations de prix des actions.
| Titre | Actions (en millions) |
Valeur ($ en millions) |
% du portefeuille | ΔPortefeuille % |
|---|---|---|---|---|
| 1,68 | 115,83 | 1,3240 | -0,8763 | |
| 0,82 | 256,71 | 2,9343 | -0,6183 | |
| 0,62 | 110,61 | 1,2643 | -0,5561 | |
| 1,12 | 196,94 | 2,2511 | -0,5122 | |
| 0,66 | 369,06 | 4,2186 | -0,4454 | |
| 0,41 | 155,39 | 1,7761 | -0,4036 | |
| 1,32 | 137,25 | 1,5688 | -0,3725 | |
| 1,33 | 136,76 | 1,5632 | -0,3396 | |
| 0,84 | 185,06 | 2,1153 | -0,2537 | |
| 2,26 | 171,09 | 1,9556 | -0,2527 |
Déclarations 13F et dépôts de fonds
Ce formulaire a été déposé le 2025-08-07 pour la période de déclaration 2025-06-30. Cliquez sur l'icône du lien pour voir l'historique complet des transactions.
Mettre à niveau pour débloquer les données premium et exporter vers Excel ![]() .
.
| Titre | Type | Prix moyen de l'action | Actions (en millions) |
ΔActions (%) |
ΔActions (%) |
Valeur ($ en millions) |
Portefeuille (%) |
ΔPortefeuille (%) |
|
|---|---|---|---|---|---|---|---|---|---|
| MSFT / Microsoft Corporation | 1,41 | -15,11 | 703,03 | 12,49 | 8,0360 | 0,4374 | |||
| AMZN / Amazon.com, Inc. | 3,15 | 4,14 | 691,93 | 20,08 | 7,9091 | 0,9033 | |||
| META / Meta Platforms, Inc. | 0,63 | 7,17 | 468,06 | 37,25 | 5,3502 | 1,2039 | |||
| ES / Eversource Energy | 6,95 | 1,10 | 442,29 | 3,56 | 5,0557 | -0,1369 | |||
| TSM / Taiwan Semiconductor Manufacturing Company Limited - Depositary Receipt (Common Stock) | 1,93 | 6,84 | 436,15 | 45,77 | 4,9855 | 1,3478 | |||
| MA / Mastercard Incorporated | 0,66 | -6,16 | 369,06 | -3,79 | 4,2186 | -0,4454 | |||
| YUM / Yum! Brands, Inc. | 2,31 | 35,89 | 341,84 | 27,96 | 3,9074 | 0,6594 | |||
| V / Visa Inc. | 0,88 | -1,80 | 311,26 | -0,51 | 3,5579 | -0,2459 | |||
| NFLX / Netflix, Inc. | 0,22 | -27,33 | 292,00 | 4,35 | 3,3378 | -0,0644 | |||
| CMG / Chipotle Mexican Grill, Inc. | 4,90 | 3,44 | 275,19 | 15,67 | 3,1455 | 0,2532 | |||
| PG / The Procter & Gamble Company | 1,71 | 49,86 | 272,50 | 40,10 | 3,1148 | 0,7501 | |||
| ICE / Intercontinental Exchange, Inc. | 1,45 | -3,64 | 266,49 | 2,49 | 3,0462 | -0,1151 | |||
| UNH / UnitedHealth Group Incorporated | 0,82 | 47,49 | 256,71 | -12,15 | 2,9343 | -0,6183 | |||
| SYK / Stryker Corporation | 0,53 | -1,06 | 209,98 | 5,16 | 2,4002 | -0,0276 | |||
| INTU / Intuit Inc. | 0,26 | -21,24 | 207,15 | 1,03 | 2,3678 | -0,1250 | |||
| D / Dominion Energy, Inc. | 3,64 | -0,86 | 205,56 | -0,06 | 2,3497 | -0,1510 | |||
| GOOGL / Alphabet Inc. | 1,12 | -23,97 | 196,94 | -13,35 | 2,2511 | -0,5122 | |||
| AMT / American Tower Corporation | 0,84 | -6,50 | 185,06 | -5,03 | 2,1153 | -0,2537 | |||
| MSCI / MSCI Inc. | 0,31 | 175,91 | 2,0108 | 2,0108 | |||||
| SRE / Sempra | 2,26 | -11,29 | 171,09 | -5,81 | 1,9556 | -0,2527 | |||
| EVRG / Evergy, Inc. | 2,36 | 1 418,68 | 162,98 | 1 418,25 | 1,8630 | 1,7325 | |||
| HCA / HCA Healthcare, Inc. | 0,41 | -21,83 | 155,39 | -13,33 | 1,7761 | -0,4036 | |||
| KO / The Coca-Cola Company | 1,94 | 91,18 | 137,52 | 88,86 | 1,5719 | 0,6866 | |||
| WEC / WEC Energy Group, Inc. | 1,32 | -10,10 | 137,25 | -14,05 | 1,5688 | -0,3725 | |||
| CCI / Crown Castle Inc. | 1,33 | -11,34 | 136,76 | -12,62 | 1,5632 | -0,3396 | |||
| XEL / Xcel Energy Inc. | 2,00 | -3,39 | 136,41 | -7,06 | 1,5592 | -0,2252 | |||
| CME / CME Group Inc. | 0,49 | 131 625,47 | 133,97 | 138 012,37 | 1,5314 | 1,5302 | |||
| NVO / Novo Nordisk A/S - Depositary Receipt (Common Stock) | 1,68 | -35,61 | 115,83 | -36,00 | 1,3240 | -0,8763 | |||
| GOOG / Alphabet Inc. | 0,62 | -34,94 | 110,61 | -26,13 | 1,2643 | -0,5561 | |||
| CSX / CSX Corporation | 3,18 | -8,96 | 103,69 | 0,94 | 1,1853 | -0,0636 | |||
| NSC / Norfolk Southern Corporation | 0,40 | -13,10 | 101,94 | -6,09 | 1,1653 | -0,1545 | |||
| BKNG / Booking Holdings Inc. | 0,01 | -29,06 | 49,19 | -10,85 | 0,5623 | -0,1086 | |||
| ZBH / Zimmer Biomet Holdings, Inc. | 0,51 | 16,76 | 46,14 | -5,91 | 0,5274 | -0,0688 | |||
| USB / U.S. Bancorp | 0,96 | 4 029,27 | 43,27 | 4 329,27 | 0,4946 | 0,4828 | |||
| DG / Dollar General Corporation | 0,37 | -37,33 | 42,16 | -18,48 | 0,4819 | -0,1469 | |||
| BRK.A / Berkshire Hathaway Inc. | 0,08 | 11,82 | 39,72 | 2,00 | 0,4541 | -0,0195 | |||
| AEP / American Electric Power Company, Inc. | 0,32 | 9,69 | 33,12 | 4,16 | 0,3786 | -0,0080 | |||
| EXC / Exelon Corporation | 0,76 | 4,39 | 32,96 | -1,63 | 0,3768 | -0,0306 | |||
| DUK / Duke Energy Corporation | 0,28 | 10,49 | 32,82 | 6,89 | 0,3751 | 0,0018 | |||
| SO / The Southern Company | 0,35 | 9,21 | 32,55 | 9,07 | 0,3720 | 0,0092 | |||
| NEE / NextEra Energy, Inc. | 0,47 | 17,67 | 32,40 | 15,23 | 0,3703 | 0,0285 | |||
| PEG / Public Service Enterprise Group Incorporated | 0,35 | 9,76 | 29,82 | 12,26 | 0,3408 | 0,0179 | |||
| ULTA / Ulta Beauty, Inc. | 0,06 | -19,56 | 29,80 | 2,67 | 0,3407 | -0,0123 | |||
| ED / Consolidated Edison, Inc. | 0,28 | 9,79 | 27,62 | -0,37 | 0,3157 | -0,0213 | |||
| MELI / MercadoLibre, Inc. | 0,01 | -11,07 | 25,52 | 19,14 | 0,2917 | 0,0313 | |||
| ETR / Entergy Corporation | 0,30 | 3,70 | 25,05 | 0,83 | 0,2863 | -0,0157 | |||
| MS / Morgan Stanley | 0,16 | 3,22 | 23,22 | 24,63 | 0,2655 | 0,0389 | |||
| CRM / Salesforce, Inc. | 0,08 | 9,23 | 21,46 | 10,99 | 0,2453 | 0,0102 | |||
| AWK / American Water Works Company, Inc. | 0,15 | -5,65 | 20,73 | -11,03 | 0,2370 | -0,0463 | |||
| AEE / Ameren Corporation | 0,21 | 8,58 | 20,16 | 3,86 | 0,2304 | -0,0055 | |||
| SBAC / SBA Communications Corporation | 0,08 | -0,52 | 19,12 | 6,19 | 0,2186 | -0,0004 | |||
| DTE / DTE Energy Company | 0,14 | 0,05 | 18,78 | -4,15 | 0,2147 | -0,0236 | |||
| YUMC / Yum China Holdings, Inc. | 0,41 | 18,48 | 0,2113 | 0,2113 | |||||
| ATO / Atmos Energy Corporation | 0,12 | -0,54 | 17,92 | -0,84 | 0,2048 | -0,0149 | |||
| FE / FirstEnergy Corp. | 0,41 | -1,03 | 16,66 | -1,42 | 0,1904 | -0,0150 | |||
| PPL / PPL Corporation | 0,48 | -0,69 | 16,21 | -6,79 | 0,1853 | -0,0262 | |||
| CNP / CenterPoint Energy, Inc. | 0,44 | -0,28 | 16,20 | 1,12 | 0,1852 | -0,0096 | |||
| CMS / CMS Energy Corporation | 0,20 | -0,42 | 13,89 | -8,15 | 0,1588 | -0,0251 | |||
| NI / NiSource Inc. | 0,34 | -0,94 | 13,85 | -0,32 | 0,1584 | -0,0106 | |||
| LNT / Alliant Energy Corporation | 0,17 | -0,75 | 10,41 | -6,73 | 0,1190 | -0,0167 | |||
| WTRG / Essential Utilities, Inc. | 0,20 | -0,53 | 7,40 | -6,54 | 0,0846 | -0,0117 | |||
| PNW / Pinnacle West Capital Corporation | 0,08 | -1,66 | 7,33 | -7,62 | 0,0837 | -0,0127 | |||
| OGE / OGE Energy Corp. | 0,13 | -1,48 | 5,90 | -4,87 | 0,0674 | -0,0080 | |||
| TMO / Thermo Fisher Scientific Inc. | 0,01 | 115,72 | 5,05 | 75,79 | 0,0577 | 0,0228 | |||
| IDA / IDACORP, Inc. | 0,04 | -3,47 | 4,06 | -4,11 | 0,0464 | -0,0051 | |||
| MDLZ / Mondelez International, Inc. | 0,06 | 1,10 | 3,86 | 0,47 | 0,0441 | -0,0026 | |||
| SPGI / S&P Global Inc. | 0,01 | 0,00 | 3,23 | 3,75 | 0,0370 | -0,0009 | |||
| TXNM / TXNM Energy, Inc. | 0,06 | -0,14 | 3,23 | 5,18 | 0,0369 | -0,0004 | |||
| POR / Portland General Electric Company | 0,07 | -0,97 | 3,01 | -9,77 | 0,0344 | -0,0062 | |||
| SR / Spire Inc. | 0,04 | -3,01 | 2,97 | -9,54 | 0,0339 | -0,0060 | |||
| OGS / ONE Gas, Inc. | 0,04 | -2,80 | 2,92 | -7,58 | 0,0333 | -0,0050 | |||
| ALE / ALLETE, Inc. | 0,04 | -2,48 | 2,66 | -4,91 | 0,0304 | -0,0036 | |||
| BKH / Black Hills Corporation | 0,05 | -0,53 | 2,56 | -7,96 | 0,0292 | -0,0046 | |||
| NWE / NorthWestern Energy Group, Inc. | 0,05 | -2,59 | 2,45 | -13,65 | 0,0281 | -0,0065 | |||
| AWR / American States Water Company | 0,03 | -2,09 | 2,04 | -4,63 | 0,0233 | -0,0027 | |||
| CWT / California Water Service Group | 0,04 | -4,51 | 1,98 | -10,37 | 0,0226 | -0,0042 | |||
| AVA / Avista Corporation | 0,05 | -3,54 | 1,92 | -12,55 | 0,0219 | -0,0047 | |||
| MGEE / MGE Energy, Inc. | 0,02 | -4,95 | 1,91 | -9,56 | 0,0218 | -0,0039 | |||
| CPK / Chesapeake Utilities Corporation | 0,01 | 1,44 | 1,44 | -5,07 | 0,0165 | -0,0020 | |||
| HTO / H2O America | 0,02 | -2,50 | 1,08 | -7,39 | 0,0123 | -0,0018 | |||
| NWN / Northwest Natural Holding Company | 0,02 | 3,47 | 0,86 | -3,80 | 0,0098 | -0,0010 | |||
| MSEX / Middlesex Water Company | 0,01 | -1,89 | 0,65 | -17,03 | 0,0075 | -0,0021 | |||
| PEP / PepsiCo, Inc. | 0,00 | 22,54 | 0,10 | 8,42 | 0,0012 | 0,0000 | |||
| BLK / BlackRock, Inc. | 0,00 | 14,29 | 0,08 | 27,12 | 0,0009 | 0,0001 | |||
| RSG / Republic Services, Inc. | 0,00 | -100,00 | 0,00 | 0,0000 | |||||
| CL / Colgate-Palmolive Company | 0,00 | -100,00 | 0,00 | 0,0000 | |||||
| AAPL / Apple Inc. | 0,00 | -100,00 | 0,00 | 0,0000 | |||||
| MCD / McDonald's Corporation | 0,00 | -100,00 | 0,00 | 0,0000 | |||||
| ADBE / Adobe Inc. | 0,00 | -100,00 | 0,00 | 0,0000 |