Statistiques de base
| Valeur du portefeuille | $ 123 590 000 |
| Positions actuelles | 67 |
Dernières positions, performances, ASG (à partir des dépôts 13F, 13D)
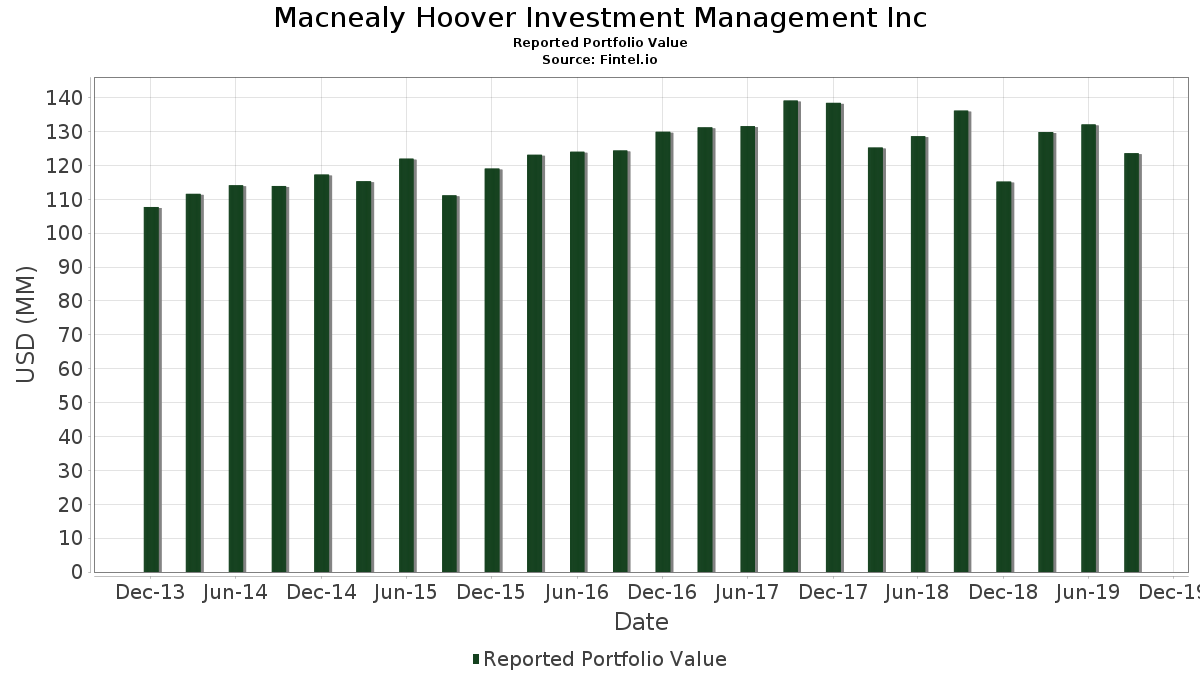
Macnealy Hoover Investment Management Inc a déclaré un total de 67 positions dans ses derniers dépôts auprès de la SEC. La valeur la plus récente du portefeuille est calculée à 123 590 000 USD. Les actifs sous gestion réels (ASG) sont cette valeur plus les liquidités (qui ne sont pas divulguées). Les principales positions de Macnealy Hoover Investment Management Inc sont Farmers National Banc Corp. (US:FMNB) , Apple Inc. (US:AAPL) , Civista Bancshares, Inc. (US:CIVB) , The Procter & Gamble Company (US:PG) , and Johnson & Johnson (US:JNJ) . Les nouvelles positions de Macnealy Hoover Investment Management Inc incluent TimkenSteel Corporation Bond (US:US887399AA15) , .
Meilleures augmentations ce trimestre
Nous utilisons la variation de l'allocation du portefeuille car il s'agit de l'indicateur le plus significatif. Les changements peuvent être dus à des transactions ou à des variations de prix des actions.
| Titre | Actions (en millions) |
Valeur ($ en millions) |
% du portefeuille | ΔPortefeuille % |
|---|---|---|---|---|
| 0,03 | 6,60 | 5,3427 | 0,8898 | |
| 0,05 | 5,84 | 4,7293 | 0,7588 | |
| 0,03 | 3,98 | 3,2179 | 0,5398 | |
| 0,21 | 3,87 | 3,1305 | 0,3722 | |
| 0,02 | 2,00 | 1,6174 | 0,3394 | |
| 0,00 | 2,43 | 1,9670 | 0,3262 | |
| 0,01 | 1,94 | 1,5665 | 0,3013 | |
| 0,04 | 2,07 | 1,6757 | 0,1750 | |
| 0,03 | 1,55 | 1,2541 | 0,1358 | |
| 0,02 | 4,25 | 3,4356 | 0,1336 |
Principales baisses ce trimestre
Nous utilisons la variation de l'allocation du portefeuille car il s'agit de l'indicateur le plus significatif. Les changements peuvent être dus à des transactions ou à des variations de prix des actions.
| Titre | Actions (en millions) |
Valeur ($ en millions) |
% du portefeuille | ΔPortefeuille % |
|---|---|---|---|---|
| 0,00 | 2,81 | 2,2704 | -1,8273 | |
| 0,03 | 4,30 | 3,4809 | -0,4791 | |
| 0,01 | 0,67 | 0,5381 | -0,4629 | |
| 0,01 | 1,84 | 1,4864 | -0,3535 | |
| 0,05 | 3,48 | 2,8198 | -0,3466 | |
| 0,00 | 0,00 | -0,1719 | ||
| 0,03 | 0,22 | 0,1812 | -0,1428 | |
| 0,03 | 1,18 | 0,9540 | -0,1401 | |
| 0,02 | 1,64 | 1,3294 | -0,1228 | |
| 0,04 | 1,33 | 1,0786 | -0,1071 |
Déclarations 13F et dépôts de fonds
Ce formulaire a été déposé le 2019-10-01 pour la période de déclaration 2019-09-30. Cliquez sur l'icône du lien pour voir l'historique complet des transactions.
Mettre à niveau pour débloquer les données premium et exporter vers Excel ![]() .
.
| Titre | Type | Prix moyen de l'action | Actions (en millions) |
ΔActions (%) |
ΔActions (%) |
Valeur ($ en millions) |
Portefeuille (%) |
ΔPortefeuille (%) |
|
|---|---|---|---|---|---|---|---|---|---|
| FMNB / Farmers National Banc Corp. | 0,60 | -3,02 | 8,64 | -5,30 | 6,9909 | 0,0826 | |||
| AAPL / Apple Inc. | 0,03 | -0,77 | 6,60 | 12,28 | 5,3427 | 0,8898 | |||
| CIVB / Civista Bancshares, Inc. | 0,28 | -5,06 | 6,17 | -8,11 | 4,9964 | -0,0917 | |||
| PG / The Procter & Gamble Company | 0,05 | -1,75 | 5,84 | 11,46 | 4,7293 | 0,7588 | |||
| JNJ / Johnson & Johnson | 0,03 | -11,44 | 4,30 | -17,74 | 3,4809 | -0,4791 | |||
| MSFT / Microsoft Corporation | 0,03 | -6,57 | 4,28 | -3,06 | 3,4647 | 0,1203 | |||
| BRK.B / Berkshire Hathaway Inc. | 0,02 | -0,22 | 4,25 | -2,64 | 3,4356 | 0,1336 | |||
| HSY / The Hershey Company | 0,03 | -2,75 | 3,98 | 12,44 | 3,2179 | 0,5398 | |||
| CBKM / Consumers Bancorp, Inc. | 0,21 | 4,89 | 3,87 | 6,20 | 3,1305 | 0,3722 | |||
| CVX / Chevron Corporation | 0,03 | -2,68 | 3,71 | -7,23 | 3,0019 | -0,0260 | |||
| XOM / Exxon Mobil Corporation | 0,05 | -9,57 | 3,48 | -16,67 | 2,8198 | -0,3466 | |||
| US887399AA15 / TimkenSteel Corporation Bond | 2,83 | -8,84 | 2,2866 | -0,0606 | |||||
| BRK.A / Berkshire Hathaway Inc. | 0,00 | -47,06 | 2,81 | -48,15 | 2,2704 | -1,8273 | |||
| ABBV / AbbVie Inc. | 0,03 | -10,02 | 2,55 | -6,32 | 2,0633 | 0,0023 | |||
| SJM / The J. M. Smucker Company | 0,02 | -2,35 | 2,52 | -6,75 | 2,0350 | -0,0071 | |||
| CAT / Caterpillar Inc. | 0,02 | 0,01 | 2,51 | -7,34 | 2,0325 | -0,0201 | |||
| GOOG / Alphabet Inc. | 0,00 | -0,50 | 2,43 | 12,18 | 1,9670 | 0,3262 | |||
| MMM / 3M Company | 0,01 | 0,59 | 2,38 | -4,61 | 1,9233 | 0,0365 | |||
| APD / Air Products and Chemicals, Inc. | 0,01 | -0,83 | 2,24 | -2,87 | 1,8100 | 0,0663 | |||
| HBAN / Huntington Bancshares Incorporated | 0,15 | -7,92 | 2,18 | -4,93 | 1,7623 | 0,0276 | |||
| CFBK / CF Bankshares Inc. | 0,17 | -4,73 | 2,15 | -1,97 | 1,7356 | 0,0789 | |||
| KO / The Coca-Cola Company | 0,04 | -2,28 | 2,07 | 4,49 | 1,6757 | 0,1750 | |||
| EMR / Emerson Electric Co. | 0,03 | -6,15 | 2,04 | -5,96 | 1,6466 | 0,0081 | |||
| UPS / United Parcel Service, Inc. | 0,02 | 2,09 | 2,00 | 18,42 | 1,6174 | 0,3394 | |||
| JPM / JPMorgan Chase & Co. | 0,02 | -12,63 | 1,98 | -8,02 | 1,6053 | -0,0279 | |||
| DIS / The Walt Disney Company | 0,02 | -0,09 | 1,98 | -6,80 | 1,5980 | -0,0064 | |||
| NOC / Northrop Grumman Corporation | 0,01 | -0,12 | 1,94 | 15,86 | 1,5665 | 0,3013 | |||
| ADP / Automatic Data Processing, Inc. | 0,01 | -22,55 | 1,84 | -24,40 | 1,4864 | -0,3535 | |||
| IR / Ingersoll Rand Inc. | 0,01 | -2,01 | 1,77 | -4,63 | 1,4330 | 0,0269 | |||
| PEP / PepsiCo, Inc. | 0,01 | -2,97 | 1,71 | 1,49 | 1,3796 | 0,1075 | |||
| ABT / Abbott Laboratories | 0,02 | -13,92 | 1,64 | -14,34 | 1,3294 | -0,1228 | |||
| DE / Deere & Company | 0,01 | 0,00 | 1,64 | 1,80 | 1,3237 | 0,1070 | |||
| INTC / Intel Corporation | 0,03 | -2,51 | 1,55 | 4,94 | 1,2541 | 0,1358 | |||
| QCOM / QUALCOMM Incorporated | 0,02 | -1,31 | 1,43 | -1,04 | 1,1595 | 0,0631 | |||
| FITB / Fifth Third Bancorp | 0,05 | -5,13 | 1,42 | -6,83 | 1,1473 | -0,0051 | |||
| MRK / Merck & Co., Inc. | 0,02 | -6,67 | 1,39 | -6,34 | 1,1239 | 0,0010 | |||
| SLB / Schlumberger Limited | 0,04 | -1,02 | 1,33 | -14,88 | 1,0786 | -0,1071 | |||
| GD / General Dynamics Corporation | 0,01 | -1,15 | 1,18 | -0,67 | 0,9572 | 0,0554 | |||
| PFE / Pfizer Inc. | 0,03 | -1,63 | 1,18 | -18,41 | 0,9540 | -0,1401 | |||
| HD / The Home Depot, Inc. | 0,00 | -3,10 | 1,04 | 8,08 | 0,8439 | 0,1133 | |||
| COP / ConocoPhillips | 0,02 | 0,00 | 0,86 | -6,61 | 0,6975 | -0,0014 | |||
| VZ / Verizon Communications Inc. | 0,01 | -0,31 | 0,77 | 5,34 | 0,6230 | 0,0695 | |||
| BMY / Bristol-Myers Squibb Company | 0,01 | 0,03 | 0,75 | 11,96 | 0,6060 | 0,0995 | |||
| T / AT&T Inc. | 0,02 | -2,02 | 0,72 | 10,75 | 0,5834 | 0,0905 | |||
| DOW / Dow Inc. | 0,01 | -17,27 | 0,68 | -21,35 | 0,5486 | -0,1041 | |||
| LOW / Lowe's Companies, Inc. | 0,01 | -53,82 | 0,67 | -49,70 | 0,5381 | -0,4629 | |||
| IBM / International Business Machines Corporation | 0,00 | -11,62 | 0,67 | -6,73 | 0,5381 | -0,0018 | |||
| TMST / TimkenSteel Corporation | 0,10 | 1,67 | 0,65 | -21,35 | 0,5276 | -0,1001 | |||
| MIME / Mimecast Ltd | 0,02 | 1,83 | 0,65 | -22,20 | 0,5219 | -0,1058 | |||
| AMZN / Amazon.com, Inc. | 0,00 | -1,40 | 0,61 | -9,64 | 0,4928 | -0,0176 | |||
| CSCO / Cisco Systems, Inc. | 0,01 | -1,22 | 0,60 | -10,75 | 0,4839 | -0,0234 | |||
| D / Dominion Energy, Inc. | 0,01 | -0,73 | 0,55 | 3,96 | 0,4458 | 0,0445 | |||
| EFA / iShares Trust - iShares MSCI EAFE ETF | 0,01 | -3,25 | 0,46 | -4,14 | 0,3746 | 0,0089 | |||
| DBD / Diebold Nixdorf, Incorporated | 0,04 | -11,74 | 0,43 | 7,71 | 0,3504 | 0,0460 | |||
| GIS / General Mills, Inc. | 0,01 | -15,38 | 0,35 | -11,20 | 0,2824 | -0,0152 | |||
| CSX / CSX Corporation | 0,00 | 0,00 | 0,33 | -10,44 | 0,2638 | -0,0118 | |||
| SO / The Southern Company | 0,01 | -7,08 | 0,33 | 4,17 | 0,2630 | 0,0267 | |||
| SNY / Sanofi - Depositary Receipt (Common Stock) | 0,01 | 0,00 | 0,32 | 7,33 | 0,2605 | 0,0334 | |||
| BA / The Boeing Company | 0,00 | 0,00 | 0,32 | 4,58 | 0,2589 | 0,0272 | |||
| / Total S.A. | 0,01 | 0,00 | 0,32 | -6,80 | 0,2549 | -0,0010 | |||
| MDLZ / Mondelez International, Inc. | 0,01 | 0,00 | 0,30 | 2,42 | 0,2395 | 0,0207 | |||
| MCD / McDonald's Corporation | 0,00 | -0,78 | 0,27 | 2,63 | 0,2209 | 0,0195 | |||
| RPM / RPM International Inc. | 0,00 | -3,11 | 0,27 | 8,94 | 0,2168 | 0,0306 | |||
| AEP / American Electric Power Company, Inc. | 0,00 | 0,00 | 0,25 | 6,41 | 0,2015 | 0,0243 | |||
| SDY / SPDR Series Trust - SPDR S&P Dividend ETF | 0,00 | 0,00 | 0,23 | 1,80 | 0,1829 | 0,0148 | |||
| GE / General Electric Company | 0,03 | -38,67 | 0,22 | -47,66 | 0,1812 | -0,1428 | |||
| ORCL / Oracle Corporation | 0,00 | -7,85 | 0,20 | -10,87 | 0,1659 | -0,0083 | |||
| CTVA / Corteva, Inc. | 0,00 | -100,00 | 0,00 | -100,00 | -0,1719 | ||||
| AMNB / American National Bankshares Inc. | 0,00 | -100,00 | 0,00 | -100,00 | 0,0000 | 0,0000 |