Statistiques de base
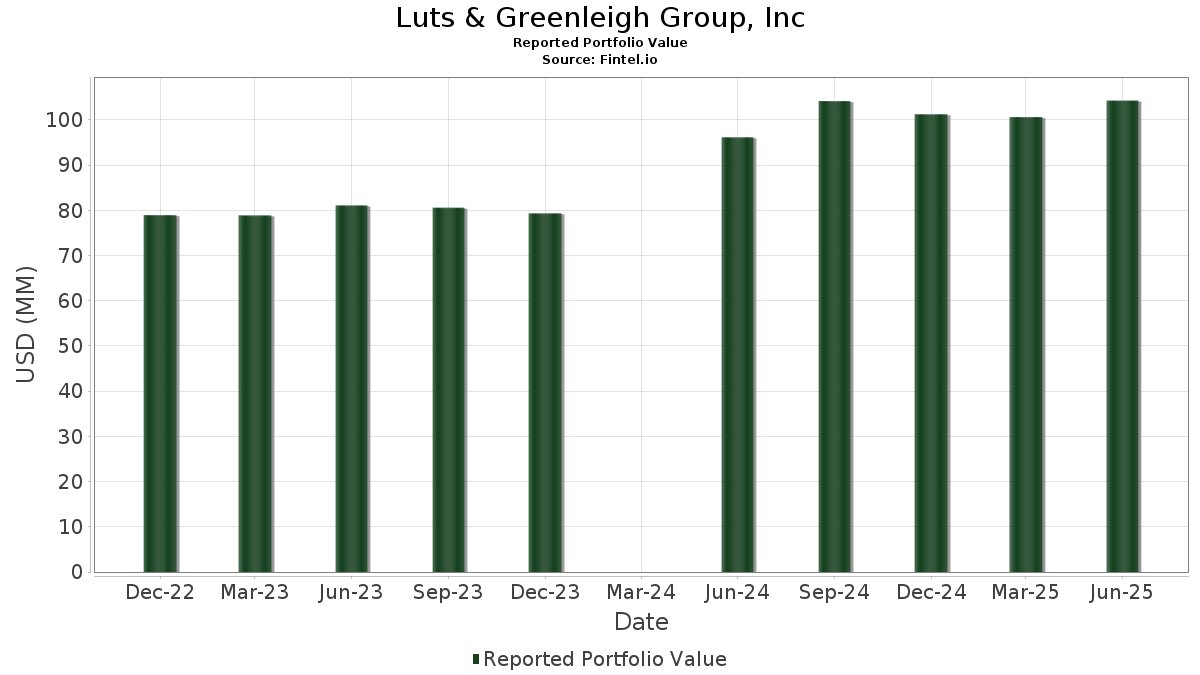
| Valeur du portefeuille | $ 104 265 776 |
| Positions actuelles | 79 |
Dernières positions, performances, ASG (à partir des dépôts 13F, 13D)
Luts & Greenleigh Group, Inc a déclaré un total de 79 positions dans ses derniers dépôts auprès de la SEC. La valeur la plus récente du portefeuille est calculée à 104 265 776 USD. Les actifs sous gestion réels (ASG) sont cette valeur plus les liquidités (qui ne sont pas divulguées). Les principales positions de Luts & Greenleigh Group, Inc sont Exxon Mobil Corporation (US:XOM) , Costco Wholesale Corporation (US:COST) , Microsoft Corporation (US:MSFT) , Apple Inc. (US:AAPL) , and NVIDIA Corporation (US:NVDA) . Les nouvelles positions de Luts & Greenleigh Group, Inc incluent Oracle Corporation (US:ORCL) , GS Connect S&P GSCI Enhanced Commodity Total Return ETN (US:GSCE) , .
Meilleures augmentations ce trimestre
Nous utilisons la variation de l'allocation du portefeuille car il s'agit de l'indicateur le plus significatif. Les changements peuvent être dus à des transactions ou à des variations de prix des actions.
| Titre | Actions (en millions) |
Valeur ($ en millions) |
% du portefeuille | ΔPortefeuille % |
|---|---|---|---|---|
| 0,01 | 5,42 | 5,2009 | 1,1801 | |
| 0,02 | 3,14 | 3,0145 | 0,8796 | |
| 0,01 | 2,03 | 1,9433 | 0,4139 | |
| 0,00 | 0,94 | 0,9003 | 0,3410 | |
| 0,00 | 0,34 | 0,3306 | 0,3306 | |
| 0,01 | 2,25 | 2,1565 | 0,2946 | |
| 0,00 | 0,25 | 0,2445 | 0,2445 | |
| 0,00 | 0,24 | 0,2256 | 0,2256 | |
| 0,00 | 0,23 | 0,2227 | 0,2227 | |
| 0,01 | 1,58 | 1,5156 | 0,2209 |
Principales baisses ce trimestre
Nous utilisons la variation de l'allocation du portefeuille car il s'agit de l'indicateur le plus significatif. Les changements peuvent être dus à des transactions ou à des variations de prix des actions.
| Titre | Actions (en millions) |
Valeur ($ en millions) |
% du portefeuille | ΔPortefeuille % |
|---|---|---|---|---|
| 0,24 | 25,81 | 24,7517 | -3,6489 | |
| 0,02 | 4,69 | 4,5007 | -0,6267 | |
| 0,00 | 0,75 | 0,7174 | -0,6154 | |
| 0,01 | 2,58 | 2,4776 | -0,4391 | |
| 0,00 | 0,23 | 0,2234 | -0,2157 | |
| 0,01 | 1,07 | 1,0250 | -0,1250 | |
| 0,00 | 0,81 | 0,7806 | -0,0929 | |
| 0,00 | 0,50 | 0,4755 | -0,0787 | |
| 0,01 | 1,68 | 1,6156 | -0,0783 | |
| 0,00 | 0,32 | 0,3058 | -0,0779 |
Déclarations 13F et dépôts de fonds
Ce formulaire a été déposé le 2025-07-11 pour la période de déclaration 2025-06-30. Cliquez sur l'icône du lien pour voir l'historique complet des transactions.
Mettre à niveau pour débloquer les données premium et exporter vers Excel ![]() .
.
| Titre | Type | Prix moyen de l'action | Actions (en millions) |
ΔActions (%) |
ΔActions (%) |
Valeur ($ en millions) |
Portefeuille (%) |
ΔPortefeuille (%) |
|
|---|---|---|---|---|---|---|---|---|---|
| XOM / Exxon Mobil Corporation | 0,24 | -0,36 | 25,81 | -9,68 | 24,7517 | -3,6489 | |||
| COST / Costco Wholesale Corporation | 0,01 | 0,01 | 10,40 | 4,68 | 9,9726 | 0,0997 | |||
| MSFT / Microsoft Corporation | 0,01 | 1,17 | 5,42 | 34,04 | 5,2009 | 1,1801 | |||
| AAPL / Apple Inc. | 0,02 | -1,52 | 4,69 | -9,03 | 4,5007 | -0,6267 | |||
| NVDA / NVIDIA Corporation | 0,02 | 0,38 | 3,14 | 46,39 | 3,0145 | 0,8796 | |||
| ABBV / AbbVie Inc. | 0,01 | -0,64 | 2,58 | -11,96 | 2,4776 | -0,4391 | |||
| IWF / iShares Trust - iShares Russell 1000 Growth ETF | 0,01 | 2,08 | 2,25 | 20,02 | 2,1565 | 0,2946 | |||
| IWO / iShares Trust - iShares Russell 2000 Growth ETF | 0,01 | 17,70 | 2,03 | 31,73 | 1,9433 | 0,4139 | |||
| ABT / Abbott Laboratories | 0,01 | -0,21 | 1,99 | 2,36 | 1,9115 | -0,0246 | |||
| AMZN / Amazon.com, Inc. | 0,01 | -0,90 | 1,93 | 14,28 | 1,8504 | 0,1723 | |||
| HD / The Home Depot, Inc. | 0,00 | 0,87 | 1,78 | 0,91 | 1,7085 | -0,0462 | |||
| WM / Waste Management, Inc. | 0,01 | 0,01 | 1,68 | -1,17 | 1,6156 | -0,0783 | |||
| IWD / iShares Trust - iShares Russell 1000 Value ETF | 0,01 | 4,88 | 1,64 | 8,28 | 1,5685 | 0,0671 | |||
| IWP / iShares Trust - iShares Russell Mid-Cap Growth ETF | 0,01 | 2,78 | 1,58 | 21,35 | 1,5156 | 0,2209 | |||
| KO / The Coca-Cola Company | 0,02 | 0,27 | 1,56 | -0,95 | 1,4966 | -0,0692 | |||
| PM / Philip Morris International Inc. | 0,01 | 0,09 | 1,55 | 14,86 | 1,4905 | 0,1456 | |||
| IWN / iShares Trust - iShares Russell 2000 Value ETF | 0,01 | 12,06 | 1,31 | 17,13 | 1,2529 | 0,1440 | |||
| JPM / JPMorgan Chase & Co. | 0,00 | 2,08 | 1,28 | 20,66 | 1,2269 | 0,1728 | |||
| ISTB / iShares Trust - iShares Core 1-5 Year USD Bond ETF | 0,03 | -0,22 | 1,26 | 0,40 | 1,2055 | -0,0388 | |||
| GOOGL / Alphabet Inc. | 0,01 | -0,29 | 1,21 | 13,70 | 1,1629 | 0,1024 | |||
| IWS / iShares Trust - iShares Russell Mid-Cap Value ETF | 0,01 | 4,69 | 1,17 | 9,86 | 1,1227 | 0,0632 | |||
| JNJ / Johnson & Johnson | 0,01 | 0,29 | 1,07 | -7,69 | 1,0250 | -0,1250 | |||
| META / Meta Platforms, Inc. | 0,00 | 0,44 | 1,01 | 28,55 | 0,9721 | 0,1889 | |||
| EFG / iShares Trust - iShares MSCI EAFE Growth ETF | 0,01 | 2,96 | 1,01 | 15,35 | 0,9666 | 0,0979 | |||
| WMT / Walmart Inc. | 0,01 | 1,61 | 0,98 | 13,09 | 0,9368 | 0,0790 | |||
| EFV / iShares Trust - iShares MSCI EAFE Value ETF | 0,02 | 2,44 | 0,96 | 10,33 | 0,9218 | 0,0559 | |||
| AVGO / Broadcom Inc. | 0,00 | 1,31 | 0,94 | 66,90 | 0,9003 | 0,3410 | |||
| LLY / Eli Lilly and Company | 0,00 | -1,88 | 0,81 | -7,40 | 0,7806 | -0,0929 | |||
| UNP / Union Pacific Corporation | 0,00 | -0,12 | 0,78 | -2,73 | 0,7519 | -0,0491 | |||
| GOOG / Alphabet Inc. | 0,00 | -1,38 | 0,78 | 11,99 | 0,7435 | 0,0554 | |||
| GLD / SPDR Gold Trust | 0,00 | -47,27 | 0,75 | -44,22 | 0,7174 | -0,6154 | |||
| VGT / Vanguard World Fund - Vanguard Information Technology ETF | 0,00 | 0,00 | 0,74 | 22,19 | 0,7087 | 0,1081 | |||
| TSLA / Tesla, Inc. | 0,00 | -1,02 | 0,71 | 21,37 | 0,6817 | 0,0994 | |||
| MDLZ / Mondelez International, Inc. | 0,01 | 0,83 | 0,71 | 0,14 | 0,6808 | -0,0232 | |||
| K / Kellanova | 0,01 | 0,28 | 0,70 | -3,31 | 0,6731 | -0,0484 | |||
| SYK / Stryker Corporation | 0,00 | 0,41 | 0,68 | 6,76 | 0,6515 | 0,0188 | |||
| V / Visa Inc. | 0,00 | 4,42 | 0,65 | 5,74 | 0,6189 | 0,0124 | |||
| SPY / SPDR S&P 500 ETF | 0,00 | 36,39 | 0,60 | 50,76 | 0,5730 | 0,1789 | |||
| VOO / Vanguard Index Funds - Vanguard S&P 500 ETF | 0,00 | 0,00 | 0,60 | 10,39 | 0,5714 | 0,0357 | |||
| BRK.A / Berkshire Hathaway Inc. | 0,00 | 0,66 | 0,59 | -8,20 | 0,5693 | -0,0733 | |||
| LDOS / Leidos Holdings, Inc. | 0,00 | 0,00 | 0,58 | 17,07 | 0,5527 | 0,0628 | |||
| SCHZ / Schwab Strategic Trust - Schwab U.S. Aggregate Bond ETF | 0,02 | 0,00 | 0,54 | 0,37 | 0,5218 | -0,0171 | |||
| T / AT&T Inc. | 0,02 | -8,20 | 0,54 | -5,95 | 0,5153 | -0,0532 | |||
| SCHF / Schwab Strategic Trust - Schwab International Equity ETF | 0,02 | 1,97 | 0,50 | 13,93 | 0,4794 | 0,0433 | |||
| GJR / Strats Trust For Procter & Gambel Security - Preferred Security | 0,00 | -4,89 | 0,50 | -11,13 | 0,4755 | -0,0787 | |||
| MA / Mastercard Incorporated | 0,00 | -0,74 | 0,45 | 1,80 | 0,4337 | -0,0079 | |||
| SCHH / Schwab Strategic Trust - Schwab U.S. REIT ETF | 0,02 | 0,00 | 0,45 | -1,75 | 0,4302 | -0,0230 | |||
| NFLX / Netflix, Inc. | 0,00 | -1,23 | 0,43 | 41,58 | 0,4123 | 0,1110 | |||
| EEM / iShares, Inc. - iShares MSCI Emerging Markets ETF | 0,01 | 15,06 | 0,42 | 26,95 | 0,4070 | 0,0749 | |||
| CSCO / Cisco Systems, Inc. | 0,01 | 2,87 | 0,41 | 15,82 | 0,3934 | 0,0409 | |||
| BLK / BlackRock, Inc. | 0,00 | 0,00 | 0,38 | 11,18 | 0,3627 | 0,0238 | |||
| MRK / Merck & Co., Inc. | 0,00 | 3,77 | 0,37 | -8,60 | 0,3574 | -0,0473 | |||
| IBM / International Business Machines Corporation | 0,00 | -6,07 | 0,36 | 11,31 | 0,3496 | 0,0240 | |||
| MCD / McDonald's Corporation | 0,00 | -0,16 | 0,36 | -6,67 | 0,3493 | -0,0386 | |||
| ORCL / Oracle Corporation | 0,00 | 0,34 | 0,3306 | 0,3306 | |||||
| D / Dominion Energy, Inc. | 0,01 | -2,24 | 0,32 | -1,54 | 0,3074 | -0,0159 | |||
| QCOM / QUALCOMM Incorporated | 0,00 | -20,33 | 0,32 | -17,62 | 0,3058 | -0,0779 | |||
| HON / Honeywell International Inc. | 0,00 | 1,20 | 0,31 | 11,39 | 0,3008 | 0,0206 | |||
| XLY / The Select Sector SPDR Trust - The Consumer Discretionary Select Sector SPDR Fund | 0,00 | 0,00 | 0,31 | 9,93 | 0,2983 | 0,0174 | |||
| MS / Morgan Stanley | 0,00 | -0,63 | 0,31 | 20,16 | 0,2973 | 0,0405 | |||
| BAC / Bank of America Corporation | 0,01 | 5,98 | 0,29 | 20,00 | 0,2824 | 0,0389 | |||
| SO / The Southern Company | 0,00 | 0,10 | 0,27 | 0,00 | 0,2623 | -0,0096 | |||
| CAT / Caterpillar Inc. | 0,00 | -17,09 | 0,27 | -2,55 | 0,2565 | -0,0158 | |||
| NEE / NextEra Energy, Inc. | 0,00 | -2,10 | 0,27 | -3,99 | 0,2544 | -0,0206 | |||
| PANW / Palo Alto Networks, Inc. | 0,00 | 0,39 | 0,26 | 20,09 | 0,2530 | 0,0352 | |||
| RF / Regions Financial Corporation | 0,01 | -0,18 | 0,26 | 7,88 | 0,2502 | 0,0102 | |||
| PEP / PepsiCo, Inc. | 0,00 | -3,38 | 0,26 | -15,03 | 0,2501 | -0,0545 | |||
| NOW / ServiceNow, Inc. | 0,00 | 0,25 | 0,2445 | 0,2445 | |||||
| ACN / Accenture plc | 0,00 | -0,94 | 0,25 | -4,92 | 0,2411 | -0,0222 | |||
| AFL / Aflac Incorporated | 0,00 | -0,42 | 0,25 | -5,68 | 0,2396 | -0,0233 | |||
| VZ / Verizon Communications Inc. | 0,01 | -5,11 | 0,25 | -9,45 | 0,2395 | -0,0347 | |||
| CVX / Chevron Corporation | 0,00 | 15,43 | 0,24 | -1,24 | 0,2301 | -0,0112 | |||
| ETN / Eaton Corporation plc | 0,00 | 0,24 | 0,2256 | 0,2256 | |||||
| UNH / UnitedHealth Group Incorporated | 0,00 | -11,39 | 0,23 | -47,39 | 0,2234 | -0,2157 | |||
| GSCE / GS Connect S&P GSCI Enhanced Commodity Total Return ETN | 0,00 | 0,23 | 0,2227 | 0,2227 | |||||
| SAIC / Science Applications International Corporation | 0,00 | 0,00 | 0,23 | 0,44 | 0,2209 | -0,0073 | |||
| ISRG / Intuitive Surgical, Inc. | 0,00 | -0,70 | 0,23 | 9,05 | 0,2205 | 0,0108 | |||
| VIS / Vanguard World Fund - Vanguard Industrials ETF | 0,00 | 0,22 | 0,2084 | 0,2084 | |||||
| CMCSA / Comcast Corporation | 0,01 | 8,72 | 0,21 | 5,47 | 0,2036 | 0,0029 | |||
| BMY / Bristol-Myers Squibb Company | 0,00 | -100,00 | 0,00 | 0,0000 |