Statistiques de base
| Valeur du portefeuille | $ 937 069 865 |
| Positions actuelles | 71 |
Dernières positions, performances, ASG (à partir des dépôts 13F, 13D)
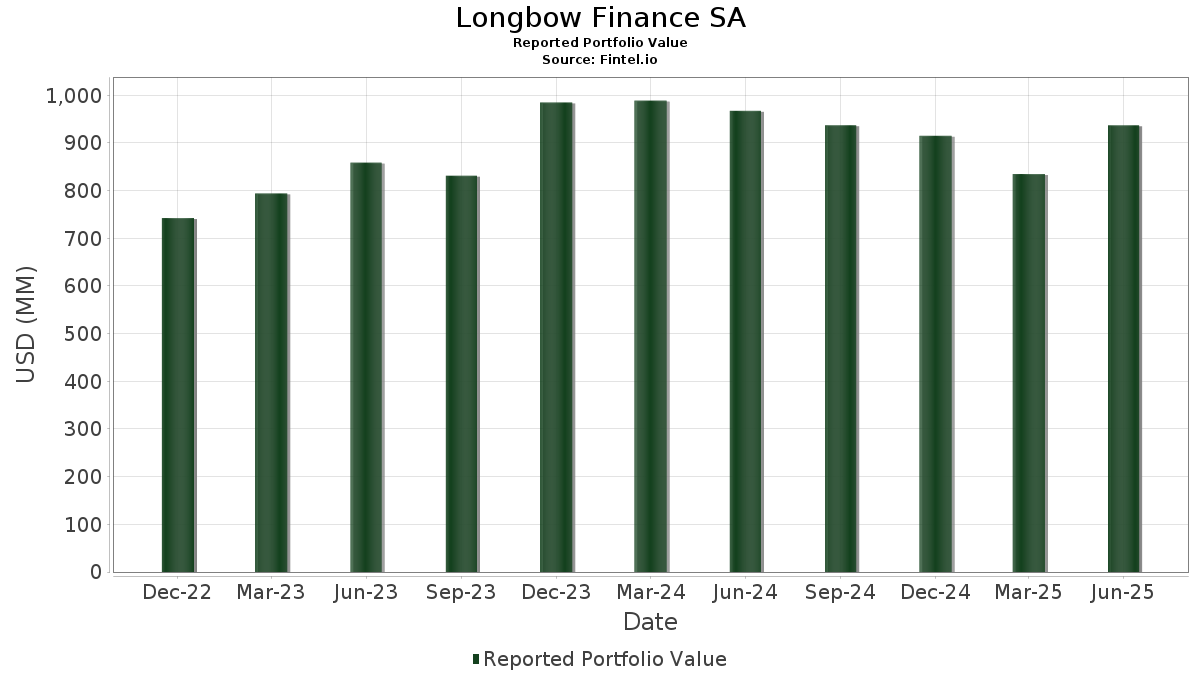
Longbow Finance SA a déclaré un total de 71 positions dans ses derniers dépôts auprès de la SEC. La valeur la plus récente du portefeuille est calculée à 937 069 865 USD. Les actifs sous gestion réels (ASG) sont cette valeur plus les liquidités (qui ne sont pas divulguées). Les principales positions de Longbow Finance SA sont NVIDIA Corporation (US:NVDA) , Microsoft Corporation (US:MSFT) , Apple Inc. (US:AAPL) , Amazon.com, Inc. (US:AMZN) , and Meta Platforms, Inc. (US:META) . Les nouvelles positions de Longbow Finance SA incluent Republic Services, Inc. (US:RSG) , McDonald's Corporation (US:MCD) , Motorola Solutions, Inc. (US:MSI) , The Southern Company (US:SO) , and T-Mobile US, Inc. (US:TMUS) .
Meilleures augmentations ce trimestre
Nous utilisons la variation de l'allocation du portefeuille car il s'agit de l'indicateur le plus significatif. Les changements peuvent être dus à des transactions ou à des variations de prix des actions.
| Titre | Actions (en millions) |
Valeur ($ en millions) |
% du portefeuille | ΔPortefeuille % |
|---|---|---|---|---|
| 0,49 | 77,86 | 8,3093 | 1,9823 | |
| 0,13 | 66,40 | 7,0855 | 1,5996 | |
| 0,06 | 19,00 | 2,0278 | 1,5366 | |
| 0,04 | 13,97 | 1,4913 | 1,4913 | |
| 0,07 | 13,62 | 1,4537 | 1,4537 | |
| 0,03 | 12,69 | 1,3542 | 1,3542 | |
| 0,04 | 11,46 | 1,2232 | 1,2232 | |
| 0,26 | 28,18 | 3,0073 | 1,1553 | |
| 0,09 | 10,75 | 1,1469 | 1,1469 | |
| 0,06 | 9,05 | 0,9662 | 0,9662 |
Principales baisses ce trimestre
Nous utilisons la variation de l'allocation du portefeuille car il s'agit de l'indicateur le plus significatif. Les changements peuvent être dus à des transactions ou à des variations de prix des actions.
| Titre | Actions (en millions) |
Valeur ($ en millions) |
% du portefeuille | ΔPortefeuille % |
|---|---|---|---|---|
| 0,21 | 36,76 | 3,9225 | -1,5783 | |
| 0,02 | 14,77 | 1,5767 | -1,4581 | |
| 0,07 | 6,90 | 0,7366 | -1,2764 | |
| 0,04 | 18,49 | 1,9727 | -1,1911 | |
| 0,23 | 15,96 | 1,7028 | -1,0569 | |
| 0,01 | 7,70 | 0,8214 | -1,0007 | |
| 0,00 | 0,00 | -0,9675 | ||
| 0,08 | 21,46 | 2,2902 | -0,8349 | |
| 0,00 | 4,89 | 0,5220 | -0,7963 | |
| 0,20 | 44,21 | 4,7182 | -0,5656 |
Déclarations 13F et dépôts de fonds
Ce formulaire a été déposé le 2025-08-05 pour la période de déclaration 2025-06-30. Cliquez sur l'icône du lien pour voir l'historique complet des transactions.
Mettre à niveau pour débloquer les données premium et exporter vers Excel ![]() .
.
| Titre | Type | Prix moyen de l'action | Actions (en millions) |
ΔActions (%) |
ΔActions (%) |
Valeur ($ en millions) |
Portefeuille (%) |
ΔPortefeuille (%) |
|
|---|---|---|---|---|---|---|---|---|---|
| NVDA / NVIDIA Corporation | 0,49 | 1,13 | 77,86 | 47,42 | 8,3093 | 1,9823 | |||
| MSFT / Microsoft Corporation | 0,13 | 9,42 | 66,40 | 44,98 | 7,0855 | 1,5996 | |||
| AAPL / Apple Inc. | 0,26 | 19,24 | 52,81 | 10,14 | 5,6361 | -0,1080 | |||
| AMZN / Amazon.com, Inc. | 0,20 | -13,07 | 44,21 | 0,23 | 4,7182 | -0,5656 | |||
| META / Meta Platforms, Inc. | 0,05 | -9,60 | 39,23 | 15,77 | 4,1869 | 0,1272 | |||
| GOOGL / Alphabet Inc. | 0,21 | -29,50 | 36,76 | -19,96 | 3,9225 | -1,5783 | |||
| XOM / Exxon Mobil Corporation | 0,26 | 101,09 | 28,18 | 82,28 | 3,0073 | 1,1553 | |||
| JPM / JPMorgan Chase & Co. | 0,09 | 0,00 | 25,05 | 18,19 | 2,6733 | 0,1343 | |||
| AVGO / Broadcom Inc. | 0,08 | -50,03 | 21,46 | -17,74 | 2,2902 | -0,8349 | |||
| AJG / Arthur J. Gallagher & Co. | 0,06 | 399,71 | 19,00 | 363,35 | 2,0278 | 1,5366 | |||
| BRK.B / Berkshire Hathaway Inc. | 0,04 | -23,27 | 18,49 | -30,01 | 1,9727 | -1,1911 | |||
| ABBV / AbbVie Inc. | 0,10 | 61,46 | 18,35 | 43,05 | 1,9579 | 0,4215 | |||
| KO / The Coca-Cola Company | 0,23 | -29,89 | 15,96 | -30,74 | 1,7028 | -1,0569 | |||
| LLY / Eli Lilly and Company | 0,02 | -38,21 | 14,77 | -41,68 | 1,5767 | -1,4581 | |||
| KMI / Kinder Morgan, Inc. | 0,49 | 63,56 | 14,55 | 68,55 | 1,5529 | 0,5187 | |||
| V / Visa Inc. | 0,04 | 13,97 | 1,4913 | 1,4913 | |||||
| WMT / Walmart Inc. | 0,14 | -17,66 | 13,85 | -8,29 | 1,4780 | -0,3310 | |||
| AMAT / Applied Materials, Inc. | 0,07 | 13,62 | 1,4537 | 1,4537 | |||||
| CAT / Caterpillar Inc. | 0,03 | 12,69 | 1,3542 | 1,3542 | |||||
| GSCE / GS Connect S&P GSCI Enhanced Commodity Total Return ETN | 0,02 | 36,00 | 12,01 | 76,21 | 1,2812 | 0,4650 | |||
| C / Citigroup Inc. | 0,14 | -26,81 | 11,71 | -12,24 | 1,2491 | -0,3487 | |||
| MCK / McKesson Corporation | 0,02 | 94,47 | 11,59 | 111,73 | 1,2365 | 0,5810 | |||
| ADP / Automatic Data Processing, Inc. | 0,04 | 11,46 | 1,2232 | 1,2232 | |||||
| TJX / The TJX Companies, Inc. | 0,09 | 10,75 | 1,1469 | 1,1469 | |||||
| APH / Amphenol Corporation | 0,11 | -13,81 | 10,60 | 29,77 | 1,1314 | 0,1527 | |||
| FCX / Freeport-McMoRan Inc. | 0,23 | 339,04 | 9,94 | 402,83 | 1,0604 | 0,8236 | |||
| STT / State Street Corporation | 0,09 | 24,12 | 9,92 | 47,43 | 1,0588 | 0,2526 | |||
| WFC / Wells Fargo & Company | 0,12 | -5,75 | 9,80 | 5,19 | 1,0463 | -0,0702 | |||
| PANW / Palo Alto Networks, Inc. | 0,05 | 91,70 | 9,78 | 129,88 | 1,0435 | 0,5340 | |||
| ISRG / Intuitive Surgical, Inc. | 0,02 | -8,77 | 9,77 | 0,09 | 1,0421 | -0,1266 | |||
| GE / General Electric Company | 0,04 | -18,57 | 9,58 | 4,71 | 1,0221 | -0,0735 | |||
| PGR / The Progressive Corporation | 0,04 | 10,33 | 9,42 | 4,03 | 1,0049 | -0,0794 | |||
| WELL / Welltower Inc. | 0,06 | 9,05 | 0,9662 | 0,9662 | |||||
| AXP / American Express Company | 0,03 | 9,02 | 0,9624 | 0,9624 | |||||
| HD / The Home Depot, Inc. | 0,02 | 161,07 | 8,88 | 161,19 | 0,9475 | 0,5403 | |||
| AZO / AutoZone, Inc. | 0,00 | 8,82 | 0,9413 | 0,9413 | |||||
| AMD / Advanced Micro Devices, Inc. | 0,06 | 8,80 | 0,9386 | 0,9386 | |||||
| RSG / Republic Services, Inc. | 0,04 | 8,64 | 0,9216 | 0,9216 | |||||
| MA / Mastercard Incorporated | 0,02 | 8,60 | 0,9180 | 0,9180 | |||||
| MCD / McDonald's Corporation | 0,03 | 8,14 | 0,8684 | 0,8684 | |||||
| NFLX / Netflix, Inc. | 0,01 | -64,76 | 7,70 | -49,40 | 0,8214 | -1,0007 | |||
| GILD / Gilead Sciences, Inc. | 0,07 | 15,81 | 7,62 | 14,59 | 0,8136 | 0,0166 | |||
| CAH / Cardinal Health, Inc. | 0,05 | -34,55 | 7,59 | -20,18 | 0,8104 | -0,3294 | |||
| USFD / US Foods Holding Corp. | 0,10 | -40,91 | 7,57 | -30,49 | 0,8079 | -0,4967 | |||
| COST / Costco Wholesale Corporation | 0,01 | 0,00 | 7,48 | 4,68 | 0,7977 | -0,0578 | |||
| VST / Vistra Corp. | 0,04 | -55,57 | 7,46 | -26,68 | 0,7963 | -0,4228 | |||
| FLEX / Flex Ltd. | 0,14 | 17,69 | 7,23 | 77,65 | 0,7718 | 0,2840 | |||
| CSCO / Cisco Systems, Inc. | 0,10 | -20,84 | 7,18 | -11,01 | 0,7664 | -0,2002 | |||
| GEV / GE Vernova Inc. | 0,01 | 20,75 | 7,17 | 109,29 | 0,7648 | 0,3546 | |||
| AMGN / Amgen Inc. | 0,03 | 7,07 | 0,7548 | 0,7548 | |||||
| HWM / Howmet Aerospace Inc. | 0,04 | -29,14 | 7,02 | 1,68 | 0,7489 | -0,0780 | |||
| RL / Ralph Lauren Corporation | 0,03 | 19,75 | 6,97 | 48,81 | 0,7434 | 0,1826 | |||
| CRH / CRH plc | 0,08 | 133,99 | 6,91 | 144,20 | 0,7375 | 0,3985 | |||
| UBER / Uber Technologies, Inc. | 0,07 | -67,92 | 6,90 | -58,93 | 0,7366 | -1,2764 | |||
| LIN / Linde plc | 0,01 | -24,55 | 6,89 | -23,98 | 0,7349 | -0,3502 | |||
| MSI / Motorola Solutions, Inc. | 0,02 | 6,88 | 0,7346 | 0,7346 | |||||
| SO / The Southern Company | 0,07 | 6,75 | 0,7205 | 0,7205 | |||||
| BSX / Boston Scientific Corporation | 0,06 | 0,00 | 6,66 | 6,47 | 0,7110 | -0,0386 | |||
| ORCL / Oracle Corporation | 0,03 | 4,17 | 6,33 | 62,91 | 0,6755 | 0,2100 | |||
| IBM / International Business Machines Corporation | 0,02 | 0,00 | 6,26 | 18,55 | 0,6678 | 0,0355 | |||
| TMUS / T-Mobile US, Inc. | 0,03 | 6,23 | 0,6647 | 0,6647 | |||||
| RCL / Royal Caribbean Cruises Ltd. | 0,02 | 0,00 | 5,47 | 52,44 | 0,5839 | 0,1539 | |||
| PLTR / Palantir Technologies Inc. | 0,04 | 5,06 | 0,5398 | 0,5398 | |||||
| BKNG / Booking Holdings Inc. | 0,00 | -64,63 | 4,89 | -55,56 | 0,5220 | -0,7963 | |||
| CYBR / CyberArk Software Ltd. | 0,01 | 4,82 | 0,5147 | 0,5147 | |||||
| RBRK / Rubrik, Inc. | 0,05 | 4,68 | 0,4998 | 0,4998 | |||||
| WAB / Westinghouse Air Brake Technologies Corporation | 0,02 | 0,00 | 3,92 | 15,43 | 0,4183 | 0,0116 | |||
| SNPS / Synopsys, Inc. | 0,01 | 3,64 | 0,3887 | 0,3887 | |||||
| LIT / Global X Funds - Global X Lithium & Battery Tech ETF | 0,08 | 0,00 | 3,07 | -1,16 | 0,3278 | -0,0445 | |||
| INKT / MiNK Therapeutics, Inc. | 0,02 | 0,12 | 0,0131 | 0,0131 | |||||
| PLUG / Plug Power Inc. | 0,02 | 0,00 | 0,03 | 10,71 | 0,0033 | -0,0001 | |||
| SPGI / S&P Global Inc. | 0,00 | -100,00 | 0,00 | 0,0000 | |||||
| AR / Antero Resources Corporation | 0,00 | -100,00 | 0,00 | 0,0000 | |||||
| FITB / Fifth Third Bancorp | 0,00 | -100,00 | 0,00 | 0,0000 | |||||
| FI / Fiserv, Inc. | 0,00 | -100,00 | 0,00 | 0,0000 | |||||
| VRTX / Vertex Pharmaceuticals Incorporated | 0,00 | -100,00 | 0,00 | 0,0000 | |||||
| EXEL / Exelixis, Inc. | 0,00 | -100,00 | 0,00 | 0,0000 | |||||
| LYV / Live Nation Entertainment, Inc. | 0,00 | -100,00 | 0,00 | 0,0000 | |||||
| HON / Honeywell International Inc. | 0,00 | -100,00 | 0,00 | 0,0000 | |||||
| UNH / UnitedHealth Group Incorporated | 0,00 | -100,00 | 0,00 | 0,0000 | |||||
| LNG / Cheniere Energy, Inc. | 0,00 | -100,00 | 0,00 | 0,0000 | |||||
| CMI / Cummins Inc. | 0,00 | -100,00 | 0,00 | 0,0000 | |||||
| TKO / TKO Group Holdings, Inc. | 0,00 | -100,00 | 0,00 | 0,0000 | |||||
| GMED / Globus Medical, Inc. | 0,00 | -100,00 | 0,00 | 0,0000 | |||||
| NFG / National Fuel Gas Company | 0,00 | -100,00 | 0,00 | 0,0000 | |||||
| MMC / Marsh & McLennan Companies, Inc. | 0,00 | -100,00 | 0,00 | 0,0000 | |||||
| MS / Morgan Stanley | 0,00 | -100,00 | 0,00 | 0,0000 | |||||
| EXPE / Expedia Group, Inc. | 0,00 | -100,00 | 0,00 | 0,0000 | |||||
| SNOW / Snowflake Inc. | 0,00 | -100,00 | 0,00 | 0,0000 | |||||
| PODD / Insulet Corporation | 0,00 | -100,00 | 0,00 | 0,0000 | |||||
| GM / General Motors Company | 0,00 | -100,00 | 0,00 | 0,0000 | |||||
| INKT / MiNK Therapeutics, Inc. | 0,00 | -100,00 | 0,00 | 0,0000 | |||||
| LDOS / Leidos Holdings, Inc. | 0,00 | -100,00 | 0,00 | 0,0000 | |||||
| EMR / Emerson Electric Co. | 0,00 | -100,00 | 0,00 | 0,0000 | |||||
| YUMC / Yum China Holdings, Inc. | 0,00 | -100,00 | 0,00 | -100,00 | -0,9675 | ||||
| PCAR / PACCAR Inc | 0,00 | -100,00 | 0,00 | 0,0000 | |||||
| UTHR / United Therapeutics Corporation | 0,00 | -100,00 | 0,00 | 0,0000 | |||||
| DLR / Digital Realty Trust, Inc. | 0,00 | -100,00 | 0,00 | 0,0000 | |||||
| MTB / M&T Bank Corporation | 0,00 | -100,00 | 0,00 | 0,0000 | |||||
| BK / The Bank of New York Mellon Corporation | 0,00 | -100,00 | 0,00 | 0,0000 | |||||
| SYK / Stryker Corporation | 0,00 | -100,00 | 0,00 | 0,0000 |