Statistiques de base
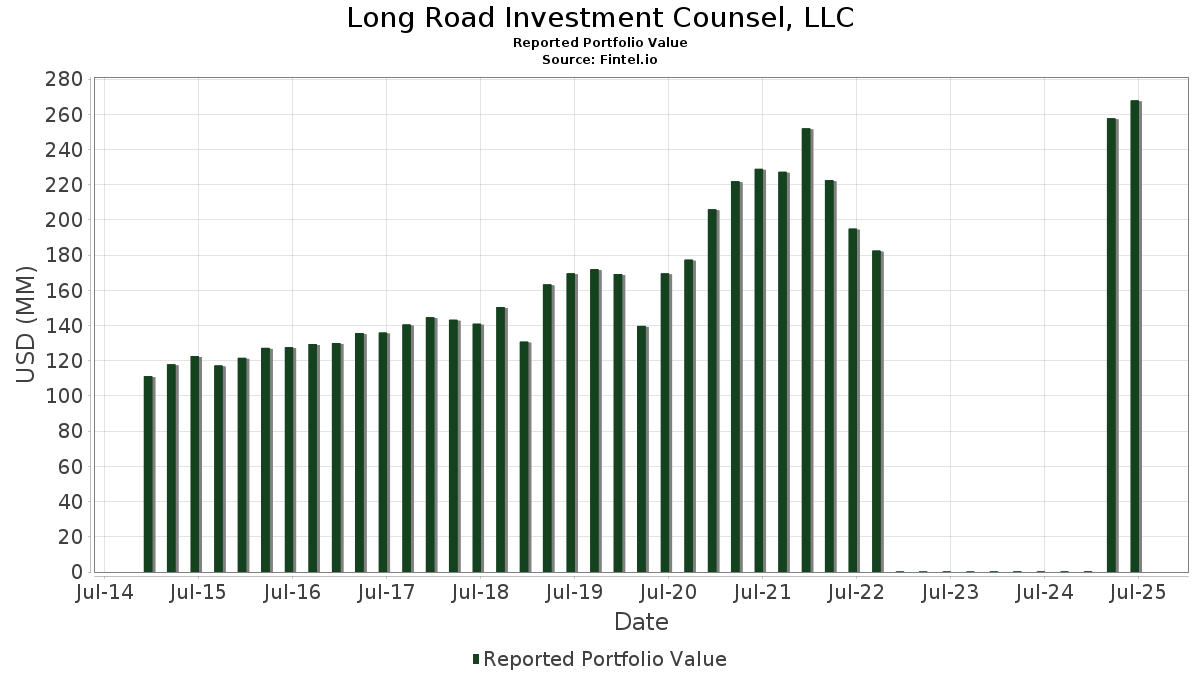
| Valeur du portefeuille | $ 267 811 747 |
| Positions actuelles | 80 |
Dernières positions, performances, ASG (à partir des dépôts 13F, 13D)
Long Road Investment Counsel, LLC a déclaré un total de 80 positions dans ses derniers dépôts auprès de la SEC. La valeur la plus récente du portefeuille est calculée à 267 811 747 USD. Les actifs sous gestion réels (ASG) sont cette valeur plus les liquidités (qui ne sont pas divulguées). Les principales positions de Long Road Investment Counsel, LLC sont O'Reilly Automotive, Inc. (US:ORLY) , Stryker Corporation (US:SYK) , Automatic Data Processing, Inc. (US:ADP) , Oracle Corporation (US:ORCL) , and Fastenal Company (US:FAST) . Les nouvelles positions de Long Road Investment Counsel, LLC incluent Northern Trust Corporation (US:NTRS) , Morgan Stanley (US:MS) , .
Meilleures augmentations ce trimestre
Nous utilisons la variation de l'allocation du portefeuille car il s'agit de l'indicateur le plus significatif. Les changements peuvent être dus à des transactions ou à des variations de prix des actions.
| Titre | Actions (en millions) |
Valeur ($ en millions) |
% du portefeuille | ΔPortefeuille % |
|---|---|---|---|---|
| 0,07 | 15,57 | 5,8127 | 1,9044 | |
| 0,01 | 5,94 | 2,2194 | 0,3765 | |
| 0,00 | 1,66 | 0,6181 | 0,3447 | |
| 0,01 | 4,07 | 1,5205 | 0,2885 | |
| 0,00 | 1,89 | 0,7057 | 0,2804 | |
| 0,01 | 3,69 | 1,3778 | 0,2584 | |
| 0,05 | 8,67 | 3,2363 | 0,2465 | |
| 0,05 | 8,55 | 3,1918 | 0,2207 | |
| 0,04 | 2,71 | 1,0137 | 0,1912 | |
| 0,00 | 2,27 | 0,8482 | 0,1756 |
Principales baisses ce trimestre
Nous utilisons la variation de l'allocation du portefeuille car il s'agit de l'indicateur le plus significatif. Les changements peuvent être dus à des transactions ou à des variations de prix des actions.
| Titre | Actions (en millions) |
Valeur ($ en millions) |
% du portefeuille | ΔPortefeuille % |
|---|---|---|---|---|
| 0,33 | 29,86 | 11,1495 | -1,1879 | |
| 0,03 | 6,43 | 2,4018 | -0,4820 | |
| 0,08 | 5,25 | 1,9595 | -0,4084 | |
| 0,02 | 2,80 | 1,0440 | -0,4079 | |
| 0,01 | 3,05 | 1,1394 | -0,3324 | |
| 0,07 | 6,19 | 2,3119 | -0,2985 | |
| 0,05 | 3,66 | 1,3655 | -0,2694 | |
| 0,03 | 3,75 | 1,3987 | -0,2481 | |
| 0,05 | 16,32 | 6,0951 | -0,2167 | |
| 0,04 | 4,66 | 1,7405 | -0,2014 |
Déclarations 13F et dépôts de fonds
Ce formulaire a été déposé le 2025-08-11 pour la période de déclaration 2025-06-30. Cliquez sur l'icône du lien pour voir l'historique complet des transactions.
Mettre à niveau pour débloquer les données premium et exporter vers Excel ![]() .
.
| Titre | Type | Prix moyen de l'action | Actions (en millions) |
ΔActions (%) |
ΔActions (%) |
Valeur ($ en millions) |
Portefeuille (%) |
ΔPortefeuille (%) |
|
|---|---|---|---|---|---|---|---|---|---|
| ORLY / O'Reilly Automotive, Inc. | 0,33 | 1 392,99 | 29,86 | -6,07 | 11,1495 | -1,1879 | |||
| SYK / Stryker Corporation | 0,04 | -0,23 | 16,80 | 6,03 | 6,2719 | 0,1238 | |||
| ADP / Automatic Data Processing, Inc. | 0,05 | -0,56 | 16,32 | 0,37 | 6,0951 | -0,2167 | |||
| ORCL / Oracle Corporation | 0,07 | -1,15 | 15,57 | 54,59 | 5,8127 | 1,9044 | |||
| FAST / Fastenal Company | 0,25 | 96,80 | 10,33 | 6,58 | 3,8578 | 0,0957 | |||
| ITW / Illinois Tool Works Inc. | 0,04 | 0,01 | 9,65 | -0,30 | 3,6036 | -0,1530 | |||
| ICE / Intercontinental Exchange, Inc. | 0,05 | -0,98 | 9,26 | 5,32 | 3,4586 | 0,0452 | |||
| GOOG / Alphabet Inc. | 0,05 | -0,91 | 8,67 | 12,51 | 3,2363 | 0,2465 | |||
| GOOGL / Alphabet Inc. | 0,05 | -2,02 | 8,55 | 11,67 | 3,1918 | 0,2207 | |||
| AAPL / Apple Inc. | 0,03 | -6,28 | 6,43 | -13,43 | 2,4018 | -0,4820 | |||
| SBUX / Starbucks Corporation | 0,07 | -1,46 | 6,19 | -7,95 | 2,3119 | -0,2985 | |||
| RBA / RB Global, Inc. | 0,06 | -0,92 | 6,00 | 4,89 | 2,2409 | 0,0205 | |||
| IDXX / IDEXX Laboratories, Inc. | 0,01 | -1,99 | 5,94 | 25,17 | 2,2194 | 0,3765 | |||
| ACN / Accenture plc | 0,02 | 0,85 | 5,31 | -3,40 | 1,9832 | -0,1506 | |||
| KMX / CarMax, Inc. | 0,08 | -0,28 | 5,25 | -14,00 | 1,9595 | -0,4084 | |||
| AFL / Aflac Incorporated | 0,04 | -1,78 | 4,66 | -6,84 | 1,7405 | -0,2014 | |||
| EXPD / Expeditors International of Washington, Inc. | 0,04 | 0,18 | 4,35 | -4,82 | 1,6241 | -0,1494 | |||
| BR / Broadridge Financial Solutions, Inc. | 0,02 | -0,72 | 4,19 | -0,48 | 1,5631 | -0,0695 | |||
| APD / Air Products and Chemicals, Inc. | 0,01 | -0,27 | 4,12 | -4,63 | 1,5393 | -0,1382 | |||
| INTU / Intuit Inc. | 0,01 | 0,00 | 4,07 | 28,29 | 1,5205 | 0,2885 | |||
| WEX / WEX Inc. | 0,03 | -0,40 | 4,07 | -6,81 | 1,5179 | -0,1753 | |||
| PEP / PepsiCo, Inc. | 0,03 | 0,25 | 3,75 | -11,74 | 1,3987 | -0,2481 | |||
| GE / General Electric Company | 0,01 | -0,52 | 3,69 | 27,91 | 1,3778 | 0,2584 | |||
| OMC / Omnicom Group Inc. | 0,05 | 0,05 | 3,66 | -13,18 | 1,3655 | -0,2694 | |||
| DORM / Dorman Products, Inc. | 0,03 | -1,24 | 3,42 | 0,50 | 1,2779 | -0,0436 | |||
| CTAS / Cintas Corporation | 0,01 | 0,00 | 3,08 | 8,43 | 1,1484 | 0,0476 | |||
| TMO / Thermo Fisher Scientific Inc. | 0,01 | -1,25 | 3,05 | -19,54 | 1,1394 | -0,3324 | |||
| FIS / Fidelity National Information Services, Inc. | 0,04 | -0,65 | 3,01 | 8,29 | 1,1224 | 0,0453 | |||
| AMG / Affiliated Managers Group, Inc. | 0,02 | 0,50 | 2,97 | 17,72 | 1,1092 | 0,1296 | |||
| BDX / Becton, Dickinson and Company | 0,02 | -0,61 | 2,80 | -25,29 | 1,0440 | -0,4079 | |||
| EL / The Estée Lauder Companies Inc. | 0,03 | -0,87 | 2,76 | 21,41 | 1,0313 | 0,1480 | |||
| CAKE / The Cheesecake Factory Incorporated | 0,04 | -0,52 | 2,71 | 28,08 | 1,0137 | 0,1912 | |||
| GILD / Gilead Sciences, Inc. | 0,02 | -0,61 | 2,71 | -1,64 | 1,0101 | -0,0575 | |||
| STT / State Street Corporation | 0,02 | 0,00 | 2,34 | 18,79 | 0,8736 | 0,1091 | |||
| MSFT / Microsoft Corporation | 0,00 | -1,08 | 2,27 | 31,04 | 0,8482 | 0,1756 | |||
| WDAY / Workday, Inc. | 0,01 | 0,00 | 2,25 | 2,74 | 0,8416 | -0,0096 | |||
| GEN / Gen Digital Inc. | 0,08 | -0,62 | 2,23 | 10,06 | 0,8338 | 0,0466 | |||
| JNJ / Johnson & Johnson | 0,01 | 0,00 | 2,23 | -7,90 | 0,8319 | -0,1069 | |||
| GEV / GE Vernova Inc. | 0,00 | -0,50 | 1,89 | 72,51 | 0,7057 | 0,2804 | |||
| ABT / Abbott Laboratories | 0,01 | -1,88 | 1,88 | 0,59 | 0,7011 | -0,0233 | |||
| MCO / Moody's Corporation | 0,00 | 0,00 | 1,85 | 7,71 | 0,6890 | 0,0241 | |||
| SPY / SPDR S&P 500 ETF | 0,00 | 112,79 | 1,66 | 135,09 | 0,6181 | 0,3447 | |||
| BWA / BorgWarner Inc. | 0,05 | -1,06 | 1,56 | 15,59 | 0,5817 | 0,0588 | |||
| EFX / Equifax Inc. | 0,01 | 0,00 | 1,53 | 6,49 | 0,5699 | 0,0137 | |||
| BRK.A / Berkshire Hathaway Inc. | 0,00 | 0,00 | 1,46 | -8,71 | 0,5443 | -0,0755 | |||
| EFA / iShares Trust - iShares MSCI EAFE ETF | 0,02 | 1,52 | 1,35 | 11,06 | 0,5028 | 0,0321 | |||
| SYY / Sysco Corporation | 0,02 | 0,00 | 1,24 | 0,98 | 0,4627 | -0,0138 | |||
| PYPL / PayPal Holdings, Inc. | 0,02 | -0,98 | 1,13 | 12,73 | 0,4204 | 0,0330 | |||
| ABBV / AbbVie Inc. | 0,01 | 0,00 | 1,11 | -11,35 | 0,4141 | -0,0717 | |||
| JPM / JPMorgan Chase & Co. | 0,00 | 0,00 | 0,99 | 18,19 | 0,3715 | 0,0448 | |||
| MDY / SPDR S&P MidCap 400 ETF Trust | 0,00 | 32,58 | 0,99 | 40,77 | 0,3702 | 0,0969 | |||
| BOOT / Boot Barn Holdings, Inc. | 0,01 | -2,32 | 0,96 | 38,13 | 0,3588 | 0,0890 | |||
| VWO / Vanguard International Equity Index Funds - Vanguard FTSE Emerging Markets ETF | 0,02 | -0,52 | 0,94 | 8,69 | 0,3505 | 0,0154 | |||
| ADBE / Adobe Inc. | 0,00 | 3,55 | 0,90 | 4,52 | 0,3369 | 0,0017 | |||
| PG / The Procter & Gamble Company | 0,01 | 0,00 | 0,85 | -6,48 | 0,3183 | -0,0356 | |||
| SMG / The Scotts Miracle-Gro Company | 0,01 | -1,28 | 0,76 | 18,75 | 0,2839 | 0,0351 | |||
| TSCO / Tractor Supply Company | 0,01 | 0,00 | 0,70 | -4,25 | 0,2611 | -0,0223 | |||
| PHIN / PHINIA Inc. | 0,01 | -0,67 | 0,66 | 4,13 | 0,2446 | 0,0005 | |||
| MDT / Medtronic plc | 0,01 | 0,00 | 0,64 | -2,90 | 0,2376 | -0,0170 | |||
| AMGN / Amgen Inc. | 0,00 | 0,00 | 0,61 | -10,36 | 0,2294 | -0,0366 | |||
| GEHC / GE HealthCare Technologies Inc. | 0,01 | 0,74 | 0,61 | -7,62 | 0,2265 | -0,0281 | |||
| J / Jacobs Solutions Inc. | 0,00 | 0,00 | 0,60 | 8,68 | 0,2246 | 0,0099 | |||
| GNTX / Gentex Corporation | 0,03 | 0,00 | 0,58 | -5,56 | 0,2159 | -0,0219 | |||
| XOM / Exxon Mobil Corporation | 0,01 | 0,00 | 0,56 | -9,43 | 0,2083 | -0,0306 | |||
| WBA / Walgreens Boots Alliance, Inc. | 0,05 | -0,65 | 0,52 | 1,95 | 0,1953 | -0,0035 | |||
| ECL / Ecolab Inc. | 0,00 | 0,00 | 0,45 | 6,35 | 0,1690 | 0,0037 | |||
| V / Visa Inc. | 0,00 | 0,00 | 0,44 | 1,14 | 0,1653 | -0,0043 | |||
| COST / Costco Wholesale Corporation | 0,00 | 0,00 | 0,40 | 4,68 | 0,1508 | 0,0011 | |||
| MA / Mastercard Incorporated | 0,00 | 0,00 | 0,37 | 2,47 | 0,1395 | -0,0020 | |||
| IRM / Iron Mountain Incorporated | 0,00 | 0,00 | 0,36 | 18,94 | 0,1340 | 0,0172 | |||
| KNX / Knight-Swift Transportation Holdings Inc. | 0,01 | 2,66 | 0,34 | 4,29 | 0,1273 | 0,0006 | |||
| BRK.A / Berkshire Hathaway Inc. | 0,00 | 0,00 | 0,34 | -8,60 | 0,1270 | -0,0177 | |||
| PFE / Pfizer Inc. | 0,01 | 0,00 | 0,29 | -4,59 | 0,1090 | -0,0094 | |||
| PAYX / Paychex, Inc. | 0,00 | 0,00 | 0,29 | -5,84 | 0,1086 | -0,0111 | |||
| XPRO / Expro Group Holdings N.V. | 0,00 | 0,00 | 0,28 | -22,03 | 0,1033 | -0,0342 | |||
| WU / The Western Union Company | 0,03 | -2,37 | 0,27 | -22,29 | 0,0991 | -0,0335 | |||
| META / Meta Platforms, Inc. | 0,00 | 0,00 | 0,26 | 28,43 | 0,0979 | 0,0184 | |||
| NTRS / Northern Trust Corporation | 0,00 | 0,25 | 0,0947 | 0,0947 | |||||
| LOW / Lowe's Companies, Inc. | 0,00 | 11,58 | 0,24 | 6,33 | 0,0878 | 0,0018 | |||
| MS / Morgan Stanley | 0,00 | 0,21 | 0,0768 | 0,0768 | |||||
| DLB / Dolby Laboratories, Inc. | 0,00 | -100,00 | 0,00 | 0,0000 | |||||
| MRK / Merck & Co., Inc. | 0,00 | -100,00 | 0,00 | 0,0000 |