Statistiques de base
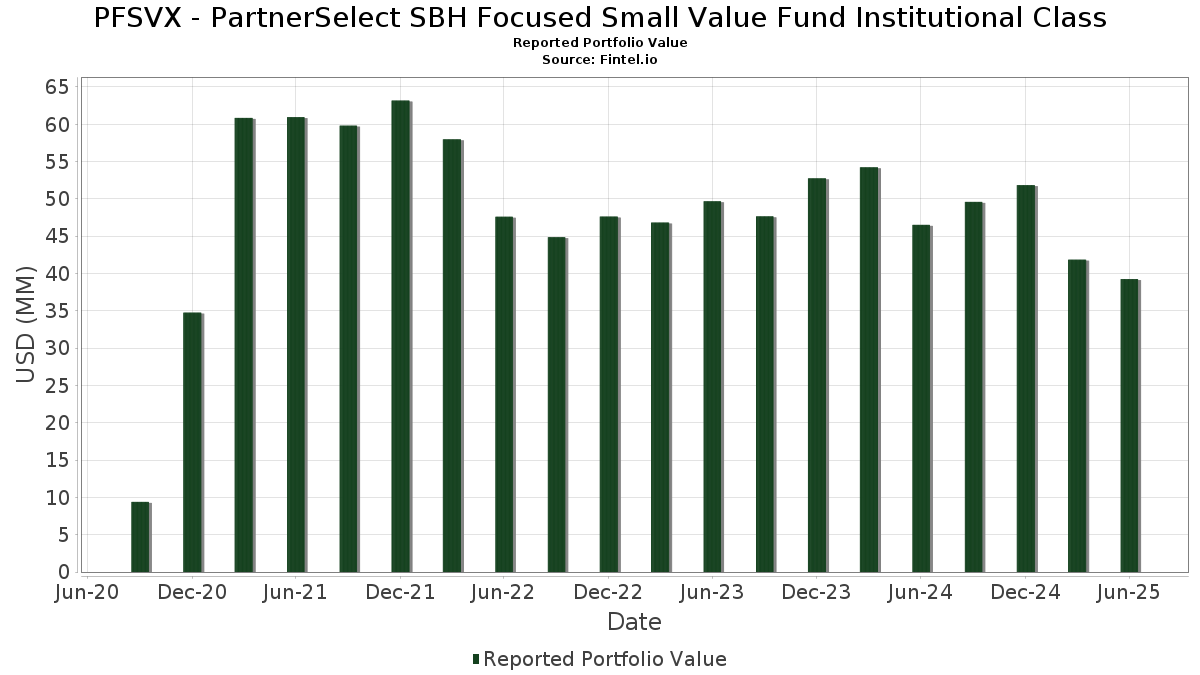
| Valeur du portefeuille | $ 39 250 090 |
| Positions actuelles | 66 |
Dernières positions, performances, ASG (à partir des dépôts 13F, 13D)
PFSVX - PartnerSelect SBH Focused Small Value Fund Institutional Class a déclaré un total de 66 positions dans ses derniers dépôts auprès de la SEC. La valeur la plus récente du portefeuille est calculée à 39 250 090 USD. Les actifs sous gestion réels (ASG) sont cette valeur plus les liquidités (qui ne sont pas divulguées). Les principales positions de PFSVX - PartnerSelect SBH Focused Small Value Fund Institutional Class sont O-I Glass, Inc. (US:OI) , Valmont Industries, Inc. (US:VMI) , REV Group, Inc. (US:REVG) , RBC Bearings Incorporated (US:RBC) , and Perimeter Solutions, Inc. (US:PRM) . Les nouvelles positions de PFSVX - PartnerSelect SBH Focused Small Value Fund Institutional Class incluent RBC Bearings Incorporated (US:RBC) , Perimeter Solutions, Inc. (US:PRM) , Manhattan Associates, Inc. (US:MANH) , AppFolio, Inc. (US:APPF) , and Casella Waste Systems, Inc. (US:CWST) .
Meilleures augmentations ce trimestre
Nous utilisons la variation de l'allocation du portefeuille car il s'agit de l'indicateur le plus significatif. Les changements peuvent être dus à des transactions ou à des variations de prix des actions.
| Titre | Actions (en millions) |
Valeur ($ en millions) |
% du portefeuille | ΔPortefeuille % |
|---|---|---|---|---|
| 0,00 | 0,85 | 2,1096 | 2,1096 | |
| 0,06 | 0,82 | 2,0216 | 2,0216 | |
| 0,00 | 0,76 | 1,8877 | 1,8877 | |
| 0,00 | 0,75 | 1,8527 | 1,8527 | |
| 0,01 | 0,74 | 1,8220 | 1,8220 | |
| 0,05 | 0,72 | 1,7918 | 1,7918 | |
| 0,01 | 0,70 | 1,7337 | 1,7337 | |
| 0,00 | 0,66 | 1,6266 | 1,6266 | |
| 0,01 | 0,65 | 1,6159 | 1,6159 | |
| 0,00 | 0,65 | 1,6143 | 1,6143 |
Principales baisses ce trimestre
Nous utilisons la variation de l'allocation du portefeuille car il s'agit de l'indicateur le plus significatif. Les changements peuvent être dus à des transactions ou à des variations de prix des actions.
| Titre | Actions (en millions) |
Valeur ($ en millions) |
% du portefeuille | ΔPortefeuille % |
|---|---|---|---|---|
| 0,00 | 0,00 | -2,4559 | ||
| 0,01 | 0,73 | 1,8048 | -2,3469 | |
| 0,01 | 0,60 | 1,4737 | -2,2099 | |
| 0,01 | 0,35 | 0,8757 | -2,0878 | |
| 0,00 | 0,00 | -1,8292 | ||
| 0,00 | 0,00 | -1,7823 | ||
| 0,01 | 0,76 | 1,8856 | -1,6867 | |
| 0,00 | 0,57 | 1,4202 | -1,2406 | |
| 0,00 | 0,71 | 1,7510 | -0,9781 | |
| 0,02 | 0,86 | 2,1167 | -0,4424 |
Déclarations 13F et dépôts de fonds
Ce formulaire a été déposé le 2025-08-27 pour la période de déclaration 2025-06-30. Cliquez sur l'icône du lien pour voir l'historique complet des transactions.
Mettre à niveau pour débloquer les données premium et exporter vers Excel ![]() .
.
| Titre | Type | Prix moyen de l'action | Actions (en millions) |
ΔActions (%) |
ΔActions (%) |
Valeur ($ en millions) |
Portefeuille (%) |
ΔPortefeuille (%) |
|
|---|---|---|---|---|---|---|---|---|---|
| OI / O-I Glass, Inc. | 0,08 | -1,86 | 1,17 | 26,08 | 2,8842 | 0,7160 | |||
| VMI / Valmont Industries, Inc. | 0,00 | -1,86 | 1,10 | 12,32 | 2,7300 | 0,4254 | |||
| REVG / REV Group, Inc. | 0,02 | -47,93 | 0,86 | -21,63 | 2,1167 | -0,4424 | |||
| RBC / RBC Bearings Incorporated | 0,00 | 0,85 | 2,1096 | 2,1096 | |||||
| PRM / Perimeter Solutions, Inc. | 0,06 | 0,82 | 2,0216 | 2,0216 | |||||
| NGVT / Ingevity Corporation | 0,02 | -1,86 | 0,80 | 6,82 | 1,9769 | 0,2222 | |||
| GT / The Goodyear Tire & Rubber Company | 0,07 | -1,86 | 0,77 | 10,20 | 1,8979 | 0,2642 | |||
| MANH / Manhattan Associates, Inc. | 0,00 | 0,76 | 1,8877 | 1,8877 | |||||
| MRCY / Mercury Systems, Inc. | 0,01 | -1,86 | 0,76 | 22,71 | 1,8856 | 0,4282 | |||
| CNM / Core & Main, Inc. | 0,01 | -59,94 | 0,76 | -49,93 | 1,8856 | -1,6867 | |||
| SLGN / Silgan Holdings Inc. | 0,01 | -1,86 | 0,76 | 3,97 | 1,8817 | 0,1665 | |||
| APPF / AppFolio, Inc. | 0,00 | 0,75 | 1,8527 | 1,8527 | |||||
| CWST / Casella Waste Systems, Inc. | 0,01 | 0,74 | 1,8220 | 1,8220 | |||||
| GSHD / Goosehead Insurance, Inc | 0,01 | -53,88 | 0,73 | -58,79 | 1,8048 | -2,3469 | |||
| HAYW / Hayward Holdings, Inc. | 0,05 | 0,72 | 1,7918 | 1,7918 | |||||
| HLNE / Hamilton Lane Incorporated | 0,00 | -36,37 | 0,71 | -39,21 | 1,7510 | -0,9781 | |||
| RGEN / Repligen Corporation | 0,01 | 0,70 | 1,7337 | 1,7337 | |||||
| ESI / Element Solutions Inc | 0,03 | 43,32 | 0,68 | 43,58 | 1,6881 | 0,5734 | |||
| SSB / SouthState Corporation | 0,01 | -1,79 | 0,68 | -2,72 | 1,6817 | 0,0442 | |||
| TCBI / Texas Capital Bancshares, Inc. | 0,01 | -1,86 | 0,66 | 4,28 | 1,6287 | 0,1484 | |||
| EXP / Eagle Materials Inc. | 0,00 | 0,66 | 1,6266 | 1,6266 | |||||
| NOVT / Novanta Inc. | 0,01 | 0,65 | 1,6159 | 1,6159 | |||||
| AIT / Applied Industrial Technologies, Inc. | 0,00 | 0,65 | 1,6143 | 1,6143 | |||||
| ALGM / Allegro MicroSystems, Inc. | 0,02 | -1,86 | 0,64 | 33,75 | 1,5788 | 0,4578 | |||
| KNSL / Kinsale Capital Group, Inc. | 0,00 | 0,63 | 1,5707 | 1,5707 | |||||
| MUSA / Murphy USA Inc. | 0,00 | 0,63 | 1,5610 | 1,5610 | |||||
| NBHC / National Bank Holdings Corporation | 0,02 | -1,85 | 0,62 | -3,42 | 1,5364 | 0,0262 | |||
| HEIA / Heico Corp. - Class A | 0,00 | 0,62 | 1,5293 | 1,5293 | |||||
| GWRE / Guidewire Software, Inc. | 0,00 | 0,61 | 1,5029 | 1,5029 | |||||
| AAP / Advance Auto Parts, Inc. | 0,01 | -7,80 | 0,60 | 9,22 | 1,4957 | 0,1985 | |||
| AZZ / AZZ Inc. | 0,01 | -1,86 | 0,60 | 11,03 | 1,4950 | 0,2169 | |||
| STAG / STAG Industrial, Inc. | 0,02 | -1,86 | 0,60 | -1,47 | 1,4914 | 0,0569 | |||
| CSW / CSW Industrials, Inc. | 0,00 | 0,60 | 1,4859 | 1,4859 | |||||
| SBCF / Seacoast Banking Corporation of Florida | 0,02 | -1,86 | 0,60 | 5,27 | 1,4842 | 0,1485 | |||
| BDC / Belden Inc. | 0,01 | -67,16 | 0,60 | -62,10 | 1,4737 | -2,2099 | |||
| COLB / Columbia Banking System, Inc. | 0,03 | -1,86 | 0,59 | -7,97 | 1,4584 | -0,0445 | |||
| FSS / Federal Signal Corporation | 0,01 | 0,58 | 1,4399 | 1,4399 | |||||
| GBCI / Glacier Bancorp, Inc. | 0,01 | -1,86 | 0,58 | -4,47 | 1,4299 | 0,0120 | |||
| AGYS / Agilysys, Inc. | 0,01 | 0,58 | 1,4292 | 1,4292 | |||||
| MORN / Morningstar, Inc. | 0,00 | 0,58 | 1,4291 | 1,4291 | |||||
| MEDP / Medpace Holdings, Inc. | 0,00 | -50,87 | 0,57 | -49,38 | 1,4202 | -1,2406 | |||
| DSGX / The Descartes Systems Group Inc. | 0,01 | 0,57 | 1,4170 | 1,4170 | |||||
| CADE / Cadence Bank | 0,02 | -1,86 | 0,57 | 3,25 | 1,4143 | 0,1172 | |||
| CRL / Charles River Laboratories International, Inc. | 0,00 | 0,57 | 1,4002 | 1,4002 | |||||
| LFUS / Littelfuse, Inc. | 0,00 | 8,52 | 0,56 | 25,11 | 1,3934 | 0,3370 | |||
| ENS / EnerSys | 0,01 | -0,67 | 0,56 | -6,95 | 1,3909 | -0,0266 | |||
| SPSC / SPS Commerce, Inc. | 0,00 | 0,55 | 1,3730 | 1,3730 | |||||
| SYNA / Synaptics Incorporated | 0,01 | 1,05 | 0,50 | 2,88 | 1,2372 | 0,0961 | |||
| ICUI / ICU Medical, Inc. | 0,00 | 13,30 | 0,49 | 7,69 | 1,2143 | 0,1466 | |||
| AHCO / AdaptHealth Corp. | 0,05 | -1,86 | 0,48 | -14,69 | 1,1939 | -0,1319 | |||
| APOG / Apogee Enterprises, Inc. | 0,01 | -2,09 | 0,48 | -14,13 | 1,1876 | -0,1247 | |||
| PCOR / Procore Technologies, Inc. | 0,01 | 0,48 | 1,1873 | 1,1873 | |||||
| PZZA / Papa John's International, Inc. | 0,01 | 23,45 | 0,47 | 47,32 | 1,1562 | 0,4108 | |||
| NX / Quanex Building Products Corporation | 0,02 | -1,86 | 0,46 | -0,22 | 1,1441 | 0,0570 | |||
| TECH / Bio-Techne Corporation | 0,01 | 0,46 | 1,1327 | 1,1327 | |||||
| KAI / Kadant Inc. | 0,00 | 0,44 | 1,0972 | 1,0972 | |||||
| WSBC / WesBanco, Inc. | 0,01 | 146,03 | 0,41 | 264,29 | 1,0117 | -0,0931 | |||
| MP / MP Materials Corp. | 0,01 | 0,38 | 0,9475 | 0,9475 | |||||
| VFC / V.F. Corporation | 0,03 | -1,86 | 0,36 | -25,72 | 0,8938 | -0,2467 | |||
| RMBS / Rambus Inc. | 0,01 | -77,34 | 0,35 | -72,05 | 0,8757 | -2,0878 | |||
| CRGY / Crescent Energy Company | 0,04 | 12,06 | 0,32 | -14,17 | 0,7948 | -0,0841 | |||
| AMBA / Ambarella, Inc. | 0,00 | -1,86 | 0,27 | 28,91 | 0,6732 | 0,1778 | |||
| THRM / Gentherm Incorporated | 0,01 | 26,58 | 0,27 | 34,17 | 0,6626 | 0,1935 | |||
| QDEL / QuidelOrtho Corporation | 0,01 | 2,42 | 0,27 | -15,77 | 0,6620 | -0,0816 | |||
| NEO / NeoGenomics, Inc. | 0,03 | 1,49 | 0,21 | -21,93 | 0,5212 | -0,1109 | |||
| ICHR / Ichor Holdings, Ltd. | 0,01 | -1,86 | 0,17 | -14,50 | 0,4231 | -0,0475 | |||
| BROS / Dutch Bros Inc. | 0,00 | -100,00 | 0,00 | -100,00 | -1,8292 | ||||
| FAN / Fabrinet | 0,00 | -100,00 | 0,00 | -100,00 | -1,7823 | ||||
| OLLI / Ollie's Bargain Outlet Holdings, Inc. | 0,00 | -100,00 | 0,00 | -100,00 | -2,4559 |