Statistiques de base
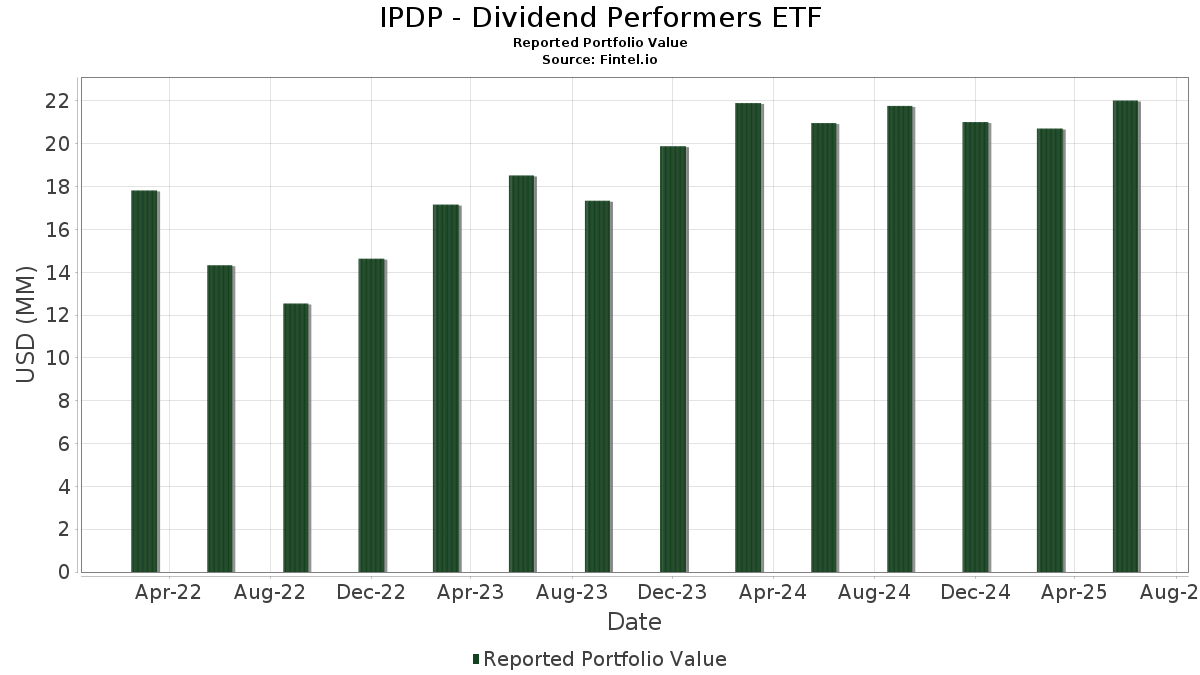
| Valeur du portefeuille | $ 22 016 382 |
| Positions actuelles | 58 |
Dernières positions, performances, ASG (à partir des dépôts 13F, 13D)
IPDP - Dividend Performers ETF a déclaré un total de 58 positions dans ses derniers dépôts auprès de la SEC. La valeur la plus récente du portefeuille est calculée à 22 016 382 USD. Les actifs sous gestion réels (ASG) sont cette valeur plus les liquidités (qui ne sont pas divulguées). Les principales positions de IPDP - Dividend Performers ETF sont Amphenol Corporation (US:APH) , KLA Corporation (US:KLAC) , Eaton Corporation plc (US:ETN) , Cisco Systems, Inc. (US:CSCO) , and Cardinal Health, Inc. (US:CAH) . Les nouvelles positions de IPDP - Dividend Performers ETF incluent Honeywell International Inc. (US:HON) , Broadridge Financial Solutions, Inc. (US:BR) , Dolby Laboratories, Inc. (US:DLB) , Zoetis Inc. (US:ZTS) , and .
Meilleures augmentations ce trimestre
Nous utilisons la variation de l'allocation du portefeuille car il s'agit de l'indicateur le plus significatif. Les changements peuvent être dus à des transactions ou à des variations de prix des actions.
| Titre | Actions (en millions) |
Valeur ($ en millions) |
% du portefeuille | ΔPortefeuille % |
|---|---|---|---|---|
| 0,00 | 0,46 | 2,0583 | 2,0583 | |
| 0,00 | 0,44 | 1,9998 | 1,9998 | |
| 0,01 | 0,43 | 1,9281 | 1,9281 | |
| 0,00 | 0,42 | 1,8984 | 1,8984 | |
| 0,00 | 0,48 | 2,1696 | 0,5701 | |
| 0,01 | 0,46 | 2,0916 | 0,3821 | |
| 0,01 | 0,50 | 2,2587 | 0,3344 | |
| 0,00 | 0,45 | 2,0207 | 0,3291 | |
| 0,00 | 0,45 | 2,0180 | 0,2687 | |
| 0,00 | 0,45 | 2,0324 | 0,2624 |
Principales baisses ce trimestre
Nous utilisons la variation de l'allocation du portefeuille car il s'agit de l'indicateur le plus significatif. Les changements peuvent être dus à des transactions ou à des variations de prix des actions.
| Titre | Actions (en millions) |
Valeur ($ en millions) |
% du portefeuille | ΔPortefeuille % |
|---|---|---|---|---|
| 0,00 | 0,44 | 2,0013 | -0,6274 | |
| 0,00 | 0,41 | 1,8712 | -0,4743 | |
| 0,00 | 0,44 | 2,0035 | -0,4508 | |
| 0,00 | 0,45 | 2,0161 | -0,4152 | |
| 0,00 | 0,43 | 1,9547 | -0,3697 | |
| 0,01 | 0,44 | 2,0014 | -0,3611 | |
| 0,00 | 0,44 | 1,9966 | -0,3511 | |
| 0,00 | 0,42 | 1,9182 | -0,3439 | |
| 0,00 | 0,43 | 1,9221 | -0,3290 | |
| 0,00 | 0,44 | 1,9957 | -0,2888 |
Déclarations 13F et dépôts de fonds
Ce formulaire a été déposé le 2025-08-28 pour la période de déclaration 2025-06-30. Cliquez sur l'icône du lien pour voir l'historique complet des transactions.
Mettre à niveau pour débloquer les données premium et exporter vers Excel ![]() .
.
| Titre | Type | Prix moyen de l'action | Actions (en millions) |
ΔActions (%) |
ΔActions (%) |
Valeur ($ en millions) |
Portefeuille (%) |
ΔPortefeuille (%) |
|
|---|---|---|---|---|---|---|---|---|---|
| APH / Amphenol Corporation | 0,01 | -17,66 | 0,50 | 23,82 | 2,2587 | 0,3344 | |||
| KLAC / KLA Corporation | 0,00 | -19,65 | 0,50 | 5,96 | 2,2504 | 0,0055 | |||
| ETN / Eaton Corporation plc | 0,00 | 9,08 | 0,48 | 43,28 | 2,1696 | 0,5701 | |||
| CSCO / Cisco Systems, Inc. | 0,01 | -10,87 | 0,48 | 0,21 | 2,1519 | -0,1160 | |||
| CAH / Cardinal Health, Inc. | 0,00 | -23,06 | 0,48 | -6,13 | 2,1476 | -0,2699 | |||
| SEIC / SEI Investments Company | 0,01 | -5,41 | 0,47 | 9,67 | 2,1013 | 0,0745 | |||
| HNI / HNI Corporation | 0,01 | 16,53 | 0,46 | 29,05 | 2,0916 | 0,3821 | |||
| LECO / Lincoln Electric Holdings, Inc. | 0,00 | 3,86 | 0,46 | 13,79 | 2,0909 | 0,1510 | |||
| ITT / ITT Inc. | 0,00 | -15,04 | 0,46 | -1,93 | 2,0700 | -0,0739 | |||
| QCOM / QUALCOMM Incorporated | 0,00 | 5,40 | 0,46 | 9,35 | 2,0632 | 0,0693 | |||
| HON / Honeywell International Inc. | 0,00 | 0,46 | 2,0583 | 2,0583 | |||||
| AMP / Ameriprise Financial, Inc. | 0,00 | 6,80 | 0,45 | 17,71 | 2,0451 | 0,2108 | |||
| SYK / Stryker Corporation | 0,00 | -1,89 | 0,45 | 4,16 | 2,0416 | -0,0262 | |||
| AIT / Applied Industrial Technologies, Inc. | 0,00 | 17,56 | 0,45 | 21,35 | 2,0324 | 0,2624 | |||
| WTS / Watts Water Technologies, Inc. | 0,00 | -13,40 | 0,45 | 4,43 | 2,0244 | -0,0231 | |||
| FAST / Fastenal Company | 0,01 | 96,19 | 0,45 | 6,18 | 2,0214 | 0,0122 | |||
| GL / Globe Life Inc. | 0,00 | 13,47 | 0,45 | 21,14 | 2,0207 | 0,3291 | |||
| TT / Trane Technologies plc | 0,00 | -6,16 | 0,45 | 21,86 | 2,0180 | 0,2687 | |||
| COR / Cencora, Inc. | 0,00 | -18,78 | 0,45 | -12,38 | 2,0161 | -0,4152 | |||
| MRK / Merck & Co., Inc. | 0,01 | 24,26 | 0,45 | 9,58 | 2,0156 | 0,0730 | |||
| DOV / Dover Corporation | 0,00 | 9,83 | 0,44 | 14,73 | 2,0069 | 0,1566 | |||
| ORI / Old Republic International Corporation | 0,01 | -3,38 | 0,44 | -5,34 | 2,0051 | -0,2311 | |||
| ABT / Abbott Laboratories | 0,00 | -15,91 | 0,44 | -13,81 | 2,0035 | -0,4508 | |||
| CSGS / CSG Systems International, Inc. | 0,01 | -17,16 | 0,44 | -10,71 | 2,0014 | -0,3611 | |||
| ABBV / AbbVie Inc. | 0,00 | -9,24 | 0,44 | -19,64 | 2,0013 | -0,6274 | |||
| BR / Broadridge Financial Solutions, Inc. | 0,00 | 0,44 | 1,9998 | 1,9998 | |||||
| MCK / McKesson Corporation | 0,00 | -17,51 | 0,44 | -10,18 | 1,9966 | -0,3511 | |||
| THG / The Hanover Insurance Group, Inc. | 0,00 | -5,52 | 0,44 | -7,74 | 1,9957 | -0,2888 | |||
| AAPL / Apple Inc. | 0,00 | 9,83 | 0,44 | 1,38 | 1,9895 | -0,0818 | |||
| CTAS / Cintas Corporation | 0,00 | -4,53 | 0,44 | 3,55 | 1,9759 | -0,0397 | |||
| DCI / Donaldson Company, Inc. | 0,01 | 8,53 | 0,44 | 12,08 | 1,9733 | 0,1165 | |||
| PRI / Primerica, Inc. | 0,00 | 6,05 | 0,44 | 2,11 | 1,9712 | -0,0697 | |||
| JNJ / Johnson & Johnson | 0,00 | -3,58 | 0,43 | -11,29 | 1,9547 | -0,3697 | |||
| TRV / The Travelers Companies, Inc. | 0,00 | -8,05 | 0,43 | -6,97 | 1,9331 | -0,2617 | |||
| MSI / Motorola Solutions, Inc. | 0,00 | 12,62 | 0,43 | 8,10 | 1,9322 | 0,0455 | |||
| DLB / Dolby Laboratories, Inc. | 0,01 | 0,43 | 1,9281 | 1,9281 | |||||
| ALL / The Allstate Corporation | 0,00 | -7,24 | 0,43 | -9,77 | 1,9221 | -0,3290 | |||
| HIG / The Hartford Insurance Group, Inc. | 0,00 | -12,66 | 0,42 | -10,55 | 1,9182 | -0,3439 | |||
| AOS / A. O. Smith Corporation | 0,01 | 5,78 | 0,42 | 6,02 | 1,9149 | 0,0091 | |||
| RGA / Reinsurance Group of America, Incorporated | 0,00 | 9,57 | 0,42 | 10,47 | 1,9083 | 0,0825 | |||
| BRC / Brady Corporation | 0,01 | 3,55 | 0,42 | -0,24 | 1,8996 | -0,1139 | |||
| IEX / IDEX Corporation | 0,00 | 23,15 | 0,42 | 19,66 | 1,8992 | 0,2204 | |||
| ZTS / Zoetis Inc. | 0,00 | 0,42 | 1,8984 | 1,8984 | |||||
| SNA / Snap-on Incorporated | 0,00 | 7,94 | 0,42 | -0,48 | 1,8926 | -0,1129 | |||
| GWW / W.W. Grainger, Inc. | 0,00 | 5,80 | 0,42 | 11,50 | 1,8849 | 0,0982 | |||
| ADP / Automatic Data Processing, Inc. | 0,00 | -9,00 | 0,41 | -8,20 | 1,8729 | -0,2806 | |||
| MMC / Marsh & McLennan Companies, Inc. | 0,00 | -5,96 | 0,41 | -15,68 | 1,8712 | -0,4743 | |||
| ACN / Accenture plc | 0,00 | 10,80 | 0,41 | 5,99 | 1,8435 | 0,0089 | |||
| ABM / ABM Industries Incorporated | 0,01 | 5,15 | 0,40 | 4,74 | 1,8000 | -0,0137 | |||
| CHE / Chemed Corporation | 0,00 | 20,47 | 0,37 | -8,60 | 1,6832 | -0,1855 | |||
| FGXXX / First American Funds Inc - First American Government Obligations Fund Class X | 0,04 | 0,54 | 0,04 | 0,00 | 0,1954 | -0,0099 | |||
| XSP US 08/15/25 P495 / DE (N/A) | 0,01 | 0,0316 | 0,0316 | ||||||
| XSP US 08/01/25 P495 / DE (N/A) | 0,00 | 0,0178 | 0,0178 | ||||||
| XSP US 07/18/25 P485 / DE (N/A) | 0,00 | 0,0055 | 0,0055 | ||||||
| XSP US 06/30/25 P485 / DE (N/A) | 0,00 | 0,0003 | 0,0003 | ||||||
| XSP US 07/18/25 P568 / DE (N/A) | -0,01 | -0,0228 | -0,0228 | ||||||
| XSP US 08/01/25 P580 / DE (N/A) | -0,03 | -0,1178 | -0,1178 | ||||||
| XSP US 08/15/25 P580 / DE (N/A) | -0,04 | -0,1923 | -0,1923 |