Statistiques de base
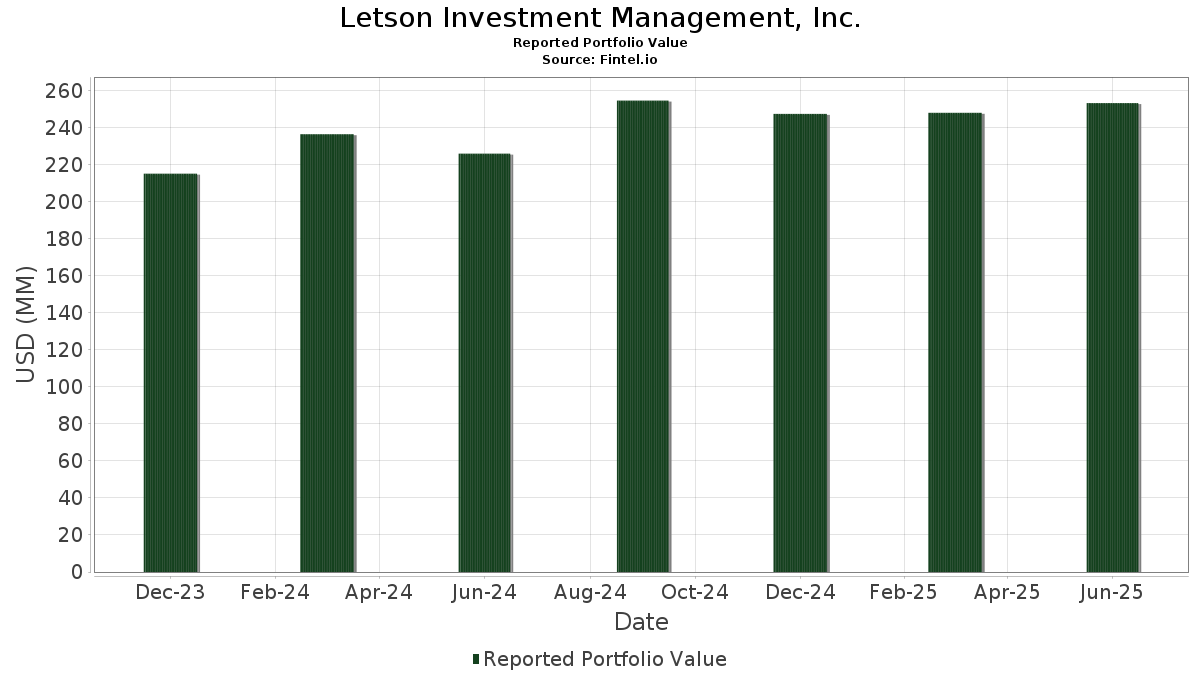
| Valeur du portefeuille | $ 253 251 785 |
| Positions actuelles | 93 |
Dernières positions, performances, ASG (à partir des dépôts 13F, 13D)
Letson Investment Management, Inc. a déclaré un total de 93 positions dans ses derniers dépôts auprès de la SEC. La valeur la plus récente du portefeuille est calculée à 253 251 785 USD. Les actifs sous gestion réels (ASG) sont cette valeur plus les liquidités (qui ne sont pas divulguées). Les principales positions de Letson Investment Management, Inc. sont AbbVie Inc. (US:ABBV) , Visa Inc. (US:V) , Abbott Laboratories (US:ABT) , Accenture plc (US:ACN) , and Johnson & Johnson (US:JNJ) . Les nouvelles positions de Letson Investment Management, Inc. incluent Kratos Defense & Security Solutions, Inc. (US:KTOS) , IonQ, Inc. (US:IONQ) , Centrus Energy Corp. (US:LEU) , Medtronic plc (US:MDT) , and Toast, Inc. (US:TOST) .
Meilleures augmentations ce trimestre
Nous utilisons la variation de l'allocation du portefeuille car il s'agit de l'indicateur le plus significatif. Les changements peuvent être dus à des transactions ou à des variations de prix des actions.
| Titre | Actions (en millions) |
Valeur ($ en millions) |
% du portefeuille | ΔPortefeuille % |
|---|---|---|---|---|
| 0,02 | 7,32 | 2,8899 | 0,6168 | |
| 0,03 | 10,15 | 4,0097 | 0,5548 | |
| 0,01 | 6,64 | 2,6210 | 0,5346 | |
| 0,11 | 7,71 | 3,0450 | 0,3516 | |
| 0,01 | 2,05 | 0,8076 | 0,3067 | |
| 0,01 | 0,61 | 0,2416 | 0,2416 | |
| 0,01 | 0,53 | 0,2087 | 0,2087 | |
| 0,11 | 5,09 | 2,0090 | 0,1998 | |
| 0,00 | 0,46 | 0,1808 | 0,1808 | |
| 0,01 | 3,15 | 1,2427 | 0,1693 |
Principales baisses ce trimestre
Nous utilisons la variation de l'allocation du portefeuille car il s'agit de l'indicateur le plus significatif. Les changements peuvent être dus à des transactions ou à des variations de prix des actions.
| Titre | Actions (en millions) |
Valeur ($ en millions) |
% du portefeuille | ΔPortefeuille % |
|---|---|---|---|---|
| 0,11 | 20,60 | 8,1360 | -1,2859 | |
| 0,08 | 12,04 | 4,7541 | -0,5179 | |
| 0,05 | 6,42 | 2,5336 | -0,4243 | |
| 0,01 | 2,37 | 0,9345 | -0,3767 | |
| 0,01 | 1,44 | 0,5684 | -0,3751 | |
| 0,04 | 12,47 | 4,9222 | -0,2754 | |
| 0,05 | 7,05 | 2,7850 | -0,2310 | |
| 0,05 | 3,88 | 1,5336 | -0,2271 | |
| 0,02 | 5,88 | 2,3226 | -0,2129 | |
| 0,01 | 3,63 | 1,4334 | -0,1999 |
Déclarations 13F et dépôts de fonds
Ce formulaire a été déposé le 2025-08-14 pour la période de déclaration 2025-06-30. Cliquez sur l'icône du lien pour voir l'historique complet des transactions.
Mettre à niveau pour débloquer les données premium et exporter vers Excel ![]() .
.
| Titre | Type | Prix moyen de l'action | Actions (en millions) |
ΔActions (%) |
ΔActions (%) |
Valeur ($ en millions) |
Portefeuille (%) |
ΔPortefeuille (%) |
|
|---|---|---|---|---|---|---|---|---|---|
| ABBV / AbbVie Inc. | 0,11 | -0,47 | 20,60 | -11,82 | 8,1360 | -1,2859 | |||
| V / Visa Inc. | 0,05 | -0,09 | 19,18 | 1,21 | 7,5753 | -0,0675 | |||
| ABT / Abbott Laboratories | 0,11 | -0,08 | 14,79 | 2,45 | 5,8395 | 0,0192 | |||
| ACN / Accenture plc | 0,04 | 0,96 | 12,47 | -3,30 | 4,9222 | -0,2754 | |||
| JNJ / Johnson & Johnson | 0,08 | -0,02 | 12,04 | -7,92 | 4,7541 | -0,5179 | |||
| AXP / American Express Company | 0,03 | -0,04 | 10,15 | 18,51 | 4,0097 | 0,5548 | |||
| SYK / Stryker Corporation | 0,02 | 0,00 | 8,53 | 6,28 | 3,3678 | 0,1320 | |||
| CARR / Carrier Global Corporation | 0,11 | 0,01 | 7,71 | 15,45 | 3,0450 | 0,3516 | |||
| TT / Trane Technologies plc | 0,02 | 0,00 | 7,32 | 29,82 | 2,8899 | 0,6168 | |||
| PAYX / Paychex, Inc. | 0,05 | 0,01 | 7,05 | -5,70 | 2,7850 | -0,2310 | |||
| INTU / Intuit Inc. | 0,01 | 0,01 | 6,64 | 28,28 | 2,6210 | 0,5346 | |||
| PEP / PepsiCo, Inc. | 0,05 | -0,67 | 6,42 | -12,53 | 2,5336 | -0,4243 | |||
| ADP / Automatic Data Processing, Inc. | 0,02 | 0,02 | 6,23 | 0,96 | 2,4585 | -0,0283 | |||
| MCD / McDonald's Corporation | 0,02 | 0,01 | 5,88 | -6,46 | 2,3226 | -0,2129 | |||
| EFX / Equifax Inc. | 0,02 | 0,00 | 5,20 | 6,49 | 2,0548 | 0,0844 | |||
| BAC / Bank of America Corporation | 0,11 | 0,00 | 5,09 | 13,40 | 2,0090 | 0,1998 | |||
| UNP / Union Pacific Corporation | 0,02 | 0,14 | 4,88 | -2,48 | 1,9273 | -0,0906 | |||
| CNI / Canadian National Railway Company | 0,04 | -0,82 | 4,58 | 5,88 | 1,8066 | 0,0642 | |||
| VTI / Vanguard Index Funds - Vanguard Total Stock Market ETF | 0,01 | 0,00 | 3,99 | 10,59 | 1,5751 | 0,1206 | |||
| MRK / Merck & Co., Inc. | 0,05 | 0,86 | 3,88 | -11,06 | 1,5336 | -0,2271 | |||
| AMGN / Amgen Inc. | 0,01 | 0,00 | 3,63 | -10,37 | 1,4334 | -0,1999 | |||
| CB / Chubb Limited | 0,01 | 0,76 | 3,39 | -3,33 | 1,3403 | -0,0757 | |||
| DIA / SPDR Dow Jones Industrial Average ETF Trust | 0,01 | 0,00 | 3,15 | 4,96 | 1,2456 | 0,0336 | |||
| JPM / JPMorgan Chase & Co. | 0,01 | 0,04 | 3,15 | 18,26 | 1,2427 | 0,1693 | |||
| KDP / Keurig Dr Pepper Inc. | 0,09 | 0,01 | 2,99 | -3,36 | 1,1815 | -0,0672 | |||
| PM / Philip Morris International Inc. | 0,02 | 0,00 | 2,92 | 14,71 | 1,1522 | 0,1268 | |||
| OTIS / Otis Worldwide Corporation | 0,03 | 0,14 | 2,69 | -3,93 | 1,0621 | -0,0667 | |||
| ITW / Illinois Tool Works Inc. | 0,01 | -0,30 | 2,48 | -0,60 | 0,9799 | -0,0268 | |||
| GNRC / Generac Holdings Inc. | 0,02 | -0,66 | 2,46 | 12,33 | 0,9714 | 0,0883 | |||
| BDX / Becton, Dickinson and Company | 0,01 | -3,22 | 2,37 | -27,22 | 0,9345 | -0,3767 | |||
| NOC / Northrop Grumman Corporation | 0,00 | 0,00 | 2,33 | -2,35 | 0,9187 | -0,0420 | |||
| COST / Costco Wholesale Corporation | 0,00 | 0,00 | 2,32 | 4,69 | 0,9166 | 0,0224 | |||
| RTX / RTX Corporation | 0,02 | 0,24 | 2,31 | 10,51 | 0,9133 | 0,0693 | |||
| MKC / McCormick & Company, Incorporated | 0,03 | 0,00 | 2,08 | -7,88 | 0,8217 | -0,0892 | |||
| AVGO / Broadcom Inc. | 0,01 | 0,00 | 2,05 | 64,65 | 0,8076 | 0,3067 | |||
| DIS / The Walt Disney Company | 0,02 | 0,00 | 1,94 | 25,70 | 0,7650 | 0,1433 | |||
| HD / The Home Depot, Inc. | 0,01 | 0,04 | 1,90 | 0,05 | 0,7501 | -0,0154 | |||
| CL / Colgate-Palmolive Company | 0,02 | 0,00 | 1,81 | -3,00 | 0,7153 | -0,0376 | |||
| AMP / Ameriprise Financial, Inc. | 0,00 | 0,00 | 1,80 | 10,27 | 0,7125 | 0,0526 | |||
| PKG / Packaging Corporation of America | 0,01 | 0,05 | 1,78 | -4,82 | 0,7023 | -0,0509 | |||
| YUM / Yum! Brands, Inc. | 0,01 | 0,00 | 1,55 | -5,84 | 0,6120 | -0,0517 | |||
| CVX / Chevron Corporation | 0,01 | -28,13 | 1,44 | -38,48 | 0,5684 | -0,3751 | |||
| NVDA / NVIDIA Corporation | 0,01 | 0,00 | 1,40 | 45,79 | 0,5534 | 0,1657 | |||
| MA / Mastercard Incorporated | 0,00 | 0,00 | 1,39 | 2,50 | 0,5508 | 0,0022 | |||
| NSC / Norfolk Southern Corporation | 0,01 | 0,04 | 1,39 | 8,11 | 0,5473 | 0,0303 | |||
| HON / Honeywell International Inc. | 0,01 | 0,00 | 1,36 | 9,96 | 0,5365 | 0,0384 | |||
| PGR / The Progressive Corporation | 0,00 | 0,00 | 1,07 | -5,74 | 0,4215 | -0,0350 | |||
| GPC / Genuine Parts Company | 0,01 | 0,00 | 1,07 | 1,81 | 0,4210 | -0,0012 | |||
| MSFT / Microsoft Corporation | 0,00 | 0,00 | 0,94 | 32,58 | 0,3698 | 0,0848 | |||
| KO / The Coca-Cola Company | 0,01 | 0,00 | 0,91 | -1,20 | 0,3574 | -0,0121 | |||
| SCI / Service Corporation International | 0,01 | 0,00 | 0,83 | 1,46 | 0,3288 | -0,0020 | |||
| SRE / Sempra | 0,01 | 0,00 | 0,77 | 6,19 | 0,3052 | 0,0117 | |||
| BMY / Bristol-Myers Squibb Company | 0,02 | 0,00 | 0,76 | -24,08 | 0,3015 | -0,1041 | |||
| MDLZ / Mondelez International, Inc. | 0,01 | 0,00 | 0,73 | -0,68 | 0,2897 | -0,0079 | |||
| FIS / Fidelity National Information Services, Inc. | 0,01 | 0,00 | 0,73 | 8,98 | 0,2877 | 0,0182 | |||
| VEA / Vanguard Tax-Managed Funds - Vanguard FTSE Developed Markets ETF | 0,01 | 0,00 | 0,72 | 12,27 | 0,2856 | 0,0256 | |||
| MU / Micron Technology, Inc. | 0,01 | 0,00 | 0,65 | 41,96 | 0,2579 | 0,0722 | |||
| ICE / Intercontinental Exchange, Inc. | 0,00 | 0,00 | 0,65 | 6,39 | 0,2564 | 0,0102 | |||
| UBER / Uber Technologies, Inc. | 0,01 | 0,00 | 0,62 | 28,04 | 0,2455 | 0,0497 | |||
| KTOS / Kratos Defense & Security Solutions, Inc. | 0,01 | 0,61 | 0,2416 | 0,2416 | |||||
| TJX / The TJX Companies, Inc. | 0,00 | 0,00 | 0,55 | 1,47 | 0,2189 | -0,0016 | |||
| IONQ / IonQ, Inc. | 0,01 | 0,53 | 0,2087 | 0,2087 | |||||
| PTON / Peloton Interactive, Inc. | 0,07 | 0,00 | 0,49 | 9,71 | 0,1922 | 0,0135 | |||
| PFE / Pfizer Inc. | 0,02 | 0,00 | 0,48 | -4,35 | 0,1914 | -0,0129 | |||
| PNC / The PNC Financial Services Group, Inc. | 0,00 | 0,00 | 0,46 | 6,19 | 0,1829 | 0,0068 | |||
| LEU / Centrus Energy Corp. | 0,00 | 0,46 | 0,1808 | 0,1808 | |||||
| APD / Air Products and Chemicals, Inc. | 0,00 | 0,00 | 0,42 | -4,37 | 0,1644 | -0,0111 | |||
| SHW / The Sherwin-Williams Company | 0,00 | 0,00 | 0,42 | -1,66 | 0,1642 | -0,0063 | |||
| COP / ConocoPhillips | 0,00 | 0,00 | 0,41 | -14,49 | 0,1631 | -0,0318 | |||
| GOOG / Alphabet Inc. | 0,00 | 0,04 | 0,41 | 13,41 | 0,1606 | 0,0162 | |||
| TMO / Thermo Fisher Scientific Inc. | 0,00 | 0,00 | 0,41 | -18,47 | 0,1604 | -0,0406 | |||
| AFL / Aflac Incorporated | 0,00 | 0,00 | 0,40 | -5,23 | 0,1577 | -0,0121 | |||
| RACE / Ferrari N.V. | 0,00 | 0,00 | 0,40 | 14,70 | 0,1573 | 0,0173 | |||
| PPLT / abrdn Platinum ETF Trust - abrdn Physical Platinum Shares ETF | 0,00 | 0,00 | 0,38 | 34,28 | 0,1504 | 0,0362 | |||
| LOW / Lowe's Companies, Inc. | 0,00 | 0,00 | 0,38 | -5,03 | 0,1496 | -0,0110 | |||
| IVV / iShares Trust - iShares Core S&P 500 ETF | 0,00 | 0,00 | 0,36 | 10,40 | 0,1429 | 0,0108 | |||
| XOM / Exxon Mobil Corporation | 0,00 | 0,00 | 0,35 | -9,37 | 0,1375 | -0,0174 | |||
| QQQ / Invesco QQQ Trust, Series 1 | 0,00 | 0,00 | 0,33 | 17,73 | 0,1311 | 0,0173 | |||
| ISRG / Intuitive Surgical, Inc. | 0,00 | 0,00 | 0,32 | 9,90 | 0,1272 | 0,0088 | |||
| MO / Altria Group, Inc. | 0,01 | 0,00 | 0,32 | -2,45 | 0,1259 | -0,0057 | |||
| ANET / Arista Networks Inc | 0,00 | 0,00 | 0,31 | 31,90 | 0,1212 | 0,0275 | |||
| TXN / Texas Instruments Incorporated | 0,00 | 0,00 | 0,30 | 15,59 | 0,1201 | 0,0140 | |||
| ASML / ASML Holding N.V. - Depositary Receipt (Common Stock) | 0,00 | 0,00 | 0,30 | 20,88 | 0,1190 | 0,0185 | |||
| PSX / Phillips 66 | 0,00 | 0,00 | 0,29 | -3,34 | 0,1144 | -0,0065 | |||
| AAPL / Apple Inc. | 0,00 | -24,14 | 0,25 | -30,00 | 0,0998 | -0,0456 | |||
| MDT / Medtronic plc | 0,00 | 0,25 | 0,0968 | 0,0968 | |||||
| ORCL / Oracle Corporation | 0,00 | 0,24 | 0,0956 | 0,0956 | |||||
| MMYT / MakeMyTrip Limited | 0,00 | 0,00 | 0,22 | 0,00 | 0,0879 | -0,0018 | |||
| TOST / Toast, Inc. | 0,00 | 0,21 | 0,0834 | 0,0834 | |||||
| LHX / L3Harris Technologies, Inc. | 0,00 | -40,66 | 0,21 | -28,96 | 0,0834 | -0,0364 | |||
| SJM / The J. M. Smucker Company | 0,00 | 0,00 | 0,21 | -17,13 | 0,0822 | -0,0190 | |||
| RJF / Raymond James Financial, Inc. | 0,00 | 0,20 | 0,0790 | 0,0790 | |||||
| MQ / Marqeta, Inc. | 0,03 | 0,00 | 0,20 | 41,43 | 0,0783 | 0,0218 | |||
| S / SentinelOne, Inc. | 0,00 | -100,00 | 0,00 | -100,00 | -0,0814 | ||||
| AES / The AES Corporation | 0,00 | -100,00 | 0,00 | -100,00 | -0,0544 |