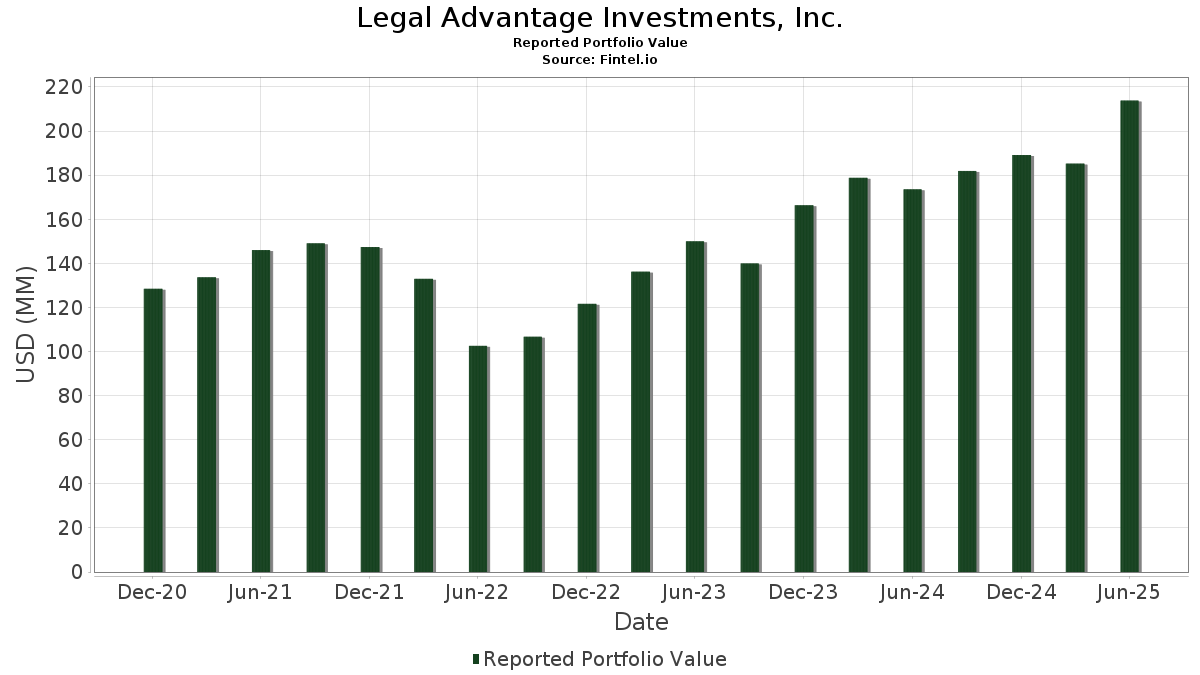
Statistiques de base
| Valeur du portefeuille | $ 213 841 043 |
| Positions actuelles | 94 |
Dernières positions, performances, ASG (à partir des dépôts 13F, 13D)
Legal Advantage Investments, Inc. a déclaré un total de 94 positions dans ses derniers dépôts auprès de la SEC. La valeur la plus récente du portefeuille est calculée à 213 841 043 USD. Les actifs sous gestion réels (ASG) sont cette valeur plus les liquidités (qui ne sont pas divulguées). Les principales positions de Legal Advantage Investments, Inc. sont Fiserv, Inc. (US:FI) , TransDigm Group Incorporated (US:TDG) , The Walt Disney Company (US:DIS) , Amazon.com, Inc. (US:AMZN) , and VSE Corporation (US:VSEC) . Les nouvelles positions de Legal Advantage Investments, Inc. incluent AppLovin Corporation (US:APP) , Natera, Inc. (US:NTRA) , TAT Technologies Ltd. (US:TATT) , Check Point Software Technologies Ltd. (US:CHKP) , and .
Meilleures augmentations ce trimestre
Nous utilisons la variation de l'allocation du portefeuille car il s'agit de l'indicateur le plus significatif. Les changements peuvent être dus à des transactions ou à des variations de prix des actions.
| Titre | Actions (en millions) |
Valeur ($ en millions) |
% du portefeuille | ΔPortefeuille % |
|---|---|---|---|---|
| 0,05 | 6,20 | 2,8974 | 0,8561 | |
| 0,01 | 4,51 | 2,1099 | 0,7685 | |
| 0,00 | 1,52 | 0,7121 | 0,7121 | |
| 0,00 | 5,19 | 2,4273 | 0,7096 | |
| 0,02 | 3,92 | 1,8320 | 0,4982 | |
| 0,01 | 0,99 | 0,4652 | 0,4652 | |
| 0,02 | 7,54 | 3,5240 | 0,4386 | |
| 0,07 | 8,47 | 3,9594 | 0,3206 | |
| 0,00 | 4,30 | 2,0112 | 0,3113 | |
| 0,03 | 3,87 | 1,8091 | 0,2983 |
Principales baisses ce trimestre
Nous utilisons la variation de l'allocation du portefeuille car il s'agit de l'indicateur le plus significatif. Les changements peuvent être dus à des transactions ou à des variations de prix des actions.
| Titre | Actions (en millions) |
Valeur ($ en millions) |
% du portefeuille | ΔPortefeuille % |
|---|---|---|---|---|
| 0,06 | 9,99 | 4,6736 | -1,6944 | |
| 0,01 | 3,38 | 1,5792 | -0,6312 | |
| 0,01 | 5,48 | 2,5638 | -0,4721 | |
| 0,01 | 3,71 | 1,7359 | -0,4242 | |
| 0,01 | 3,10 | 1,4475 | -0,3328 | |
| 0,03 | 1,72 | 0,8056 | -0,3144 | |
| 0,06 | 7,62 | 3,5651 | -0,2894 | |
| 0,03 | 2,72 | 1,2739 | -0,2412 | |
| 0,01 | 0,81 | 0,3779 | -0,1634 | |
| 0,00 | 0,80 | 0,3764 | -0,1463 |
Déclarations 13F et dépôts de fonds
Ce formulaire a été déposé le 2025-07-25 pour la période de déclaration 2025-06-30. Cliquez sur l'icône du lien pour voir l'historique complet des transactions.
Mettre à niveau pour débloquer les données premium et exporter vers Excel ![]() .
.
| Titre | Type | Prix moyen de l'action | Actions (en millions) |
ΔActions (%) |
ΔActions (%) |
Valeur ($ en millions) |
Portefeuille (%) |
ΔPortefeuille (%) |
|
|---|---|---|---|---|---|---|---|---|---|
| FI / Fiserv, Inc. | 0,06 | 8,52 | 9,99 | -15,28 | 4,6736 | -1,6944 | |||
| TDG / TransDigm Group Incorporated | 0,01 | 8,30 | 9,93 | 19,05 | 4,6414 | 0,1407 | |||
| DIS / The Walt Disney Company | 0,07 | -0,03 | 8,47 | 25,61 | 3,9594 | 0,3206 | |||
| AMZN / Amazon.com, Inc. | 0,04 | 2,91 | 7,75 | 18,68 | 3,6252 | 0,0986 | |||
| VSEC / VSE Corporation | 0,06 | -2,18 | 7,62 | 6,78 | 3,5651 | -0,2894 | |||
| MSFT / Microsoft Corporation | 0,02 | -0,49 | 7,54 | 31,85 | 3,5240 | 0,4386 | |||
| ESLT / Elbit Systems Ltd. | 0,01 | -1,33 | 6,67 | 15,61 | 3,1173 | 0,0042 | |||
| PLTR / Palantir Technologies Inc. | 0,05 | 1,45 | 6,20 | 63,85 | 2,8974 | 0,8561 | |||
| SCHW / The Charles Schwab Corporation | 0,07 | -1,83 | 6,08 | 14,43 | 2,8442 | -0,0252 | |||
| VEEV / Veeva Systems Inc. | 0,02 | -0,98 | 5,80 | 23,12 | 2,7143 | 0,1690 | |||
| PANW / Palo Alto Networks, Inc. | 0,03 | 0,21 | 5,73 | 20,18 | 2,6795 | 0,1057 | |||
| WGS / GeneDx Holdings Corp. | 0,06 | 19,76 | 5,59 | 24,82 | 2,6160 | 0,1967 | |||
| TYL / Tyler Technologies, Inc. | 0,01 | -4,39 | 5,48 | -2,51 | 2,5638 | -0,4721 | |||
| INTU / Intuit Inc. | 0,01 | -5,67 | 5,44 | 21,02 | 2,5417 | 0,1169 | |||
| MELI / MercadoLibre, Inc. | 0,00 | 21,77 | 5,19 | 63,16 | 2,4273 | 0,7096 | |||
| ASML / ASML Holding N.V. - Depositary Receipt (Common Stock) | 0,01 | 50,13 | 4,51 | 81,60 | 2,1099 | 0,7685 | |||
| VTI / Vanguard Index Funds - Vanguard Total Stock Market ETF | 0,01 | 0,05 | 4,32 | 10,64 | 2,0181 | -0,0876 | |||
| NFLX / Netflix, Inc. | 0,00 | -4,89 | 4,30 | 36,59 | 2,0112 | 0,3113 | |||
| NVDD / Direxion Shares ETF Trust - Direxion Daily NVDA Bear 1X Shares | 0,02 | 8,77 | 3,92 | 58,58 | 1,8320 | 0,4982 | |||
| META / Meta Platforms, Inc. | 0,01 | -3,21 | 3,89 | 23,94 | 1,8207 | 0,1250 | |||
| BA / The Boeing Company | 0,02 | 9,61 | 3,87 | 34,70 | 1,8098 | 0,2584 | |||
| RTX / RTX Corporation | 0,03 | 25,40 | 3,87 | 38,24 | 1,8091 | 0,2983 | |||
| ADBE / Adobe Inc. | 0,01 | -8,03 | 3,71 | -7,22 | 1,7359 | -0,4242 | |||
| ORCL / Oracle Corporation | 0,02 | -11,35 | 3,67 | 38,67 | 1,7173 | 0,2873 | |||
| AAPL / Apple Inc. | 0,02 | 37,51 | 3,46 | 27,02 | 1,6181 | 0,1474 | |||
| IDXX / IDEXX Laboratories, Inc. | 0,01 | 0,00 | 3,43 | 27,71 | 1,6039 | 0,1542 | |||
| TMO / Thermo Fisher Scientific Inc. | 0,01 | 1,22 | 3,38 | -17,54 | 1,5792 | -0,6312 | |||
| NOC / Northrop Grumman Corporation | 0,01 | -6,78 | 3,10 | -6,13 | 1,4475 | -0,3328 | |||
| SHOP / Shopify Inc. | 0,03 | 8,30 | 3,01 | 30,80 | 1,4084 | 0,1657 | |||
| SSNC / SS&C Technologies Holdings, Inc. | 0,03 | -2,08 | 2,72 | -2,92 | 1,2739 | -0,2412 | |||
| AMAT / Applied Materials, Inc. | 0,01 | -4,94 | 2,47 | 19,94 | 1,1533 | 0,0431 | |||
| MOGA / Moog, Inc. - Class A | 0,01 | 0,00 | 2,28 | 4,40 | 1,0655 | -0,1127 | |||
| TSM / Taiwan Semiconductor Manufacturing Company Limited - Depositary Receipt (Common Stock) | 0,01 | 0,00 | 2,05 | 36,52 | 0,9564 | 0,1472 | |||
| ADI / Analog Devices, Inc. | 0,01 | 0,00 | 1,74 | 18,08 | 0,8123 | 0,0178 | |||
| FNF / Fidelity National Financial, Inc. | 0,03 | -3,61 | 1,72 | -16,97 | 0,8056 | -0,3144 | |||
| V / Visa Inc. | 0,00 | 0,00 | 1,70 | 1,31 | 0,7970 | -0,1112 | |||
| ULTA / Ulta Beauty, Inc. | 0,00 | -4,07 | 1,65 | 22,44 | 0,7734 | 0,0442 | |||
| VST / Vistra Corp. | 0,01 | 0,00 | 1,61 | 65,09 | 0,7523 | 0,2260 | |||
| JPM / JPMorgan Chase & Co. | 0,01 | -4,02 | 1,56 | 13,46 | 0,7291 | -0,0129 | |||
| XYZ / Block, Inc. | 0,02 | -0,91 | 1,55 | 23,84 | 0,7267 | 0,0496 | |||
| APP / AppLovin Corporation | 0,00 | 1,52 | 0,7121 | 0,7121 | |||||
| CRM / Salesforce, Inc. | 0,01 | -0,62 | 1,48 | 0,95 | 0,6933 | -0,0993 | |||
| TT / Trane Technologies plc | 0,00 | -5,72 | 1,44 | 22,41 | 0,6746 | 0,0384 | |||
| GOOG / Alphabet Inc. | 0,01 | 0,00 | 1,42 | 13,61 | 0,6636 | -0,0111 | |||
| MA / Mastercard Incorporated | 0,00 | 0,00 | 1,39 | 2,51 | 0,6493 | -0,0818 | |||
| ZS / Zscaler, Inc. | 0,00 | 0,00 | 1,26 | 58,26 | 0,5872 | 0,1588 | |||
| FIS / Fidelity National Information Services, Inc. | 0,02 | 0,00 | 1,25 | 8,96 | 0,5863 | -0,0346 | |||
| CYBR / CyberArk Software Ltd. | 0,00 | 40,00 | 1,14 | 68,49 | 0,5328 | 0,1678 | |||
| ZTS / Zoetis Inc. | 0,01 | -2,96 | 1,02 | -8,10 | 0,4777 | -0,1223 | |||
| IBM / International Business Machines Corporation | 0,00 | -1,46 | 1,00 | 16,88 | 0,4665 | 0,0055 | |||
| TWLO / Twilio Inc. | 0,01 | 0,99 | 0,4652 | 0,4652 | |||||
| OKTA / Okta, Inc. | 0,01 | 91,18 | 0,95 | 81,52 | 0,4460 | 0,1625 | |||
| AXP / American Express Company | 0,00 | 0,00 | 0,91 | 18,67 | 0,4251 | 0,0112 | |||
| TECH / Bio-Techne Corporation | 0,02 | 40,21 | 0,90 | 23,05 | 0,4195 | 0,0259 | |||
| FTXP / Foothills Exploration, Inc. | 0,00 | 0,00 | 0,90 | 31,81 | 0,4189 | 0,0519 | |||
| DHI / D.R. Horton, Inc. | 0,01 | -0,78 | 0,83 | 0,73 | 0,3858 | -0,0568 | |||
| VRTX / Vertex Pharmaceuticals Incorporated | 0,00 | 0,00 | 0,82 | -8,16 | 0,3847 | -0,0989 | |||
| RBRK / Rubrik, Inc. | 0,01 | 121,95 | 0,82 | 226,00 | 0,3813 | 0,2463 | |||
| ZBH / Zimmer Biomet Holdings, Inc. | 0,01 | 0,00 | 0,81 | -19,36 | 0,3779 | -0,1634 | |||
| AMGN / Amgen Inc. | 0,00 | -7,24 | 0,80 | -16,94 | 0,3764 | -0,1463 | |||
| MNDY / monday.com Ltd. | 0,00 | 14,29 | 0,75 | 47,84 | 0,3530 | 0,0773 | |||
| WMT / Walmart Inc. | 0,01 | 0,00 | 0,73 | 11,40 | 0,3429 | -0,0125 | |||
| GD / General Dynamics Corporation | 0,00 | 0,00 | 0,73 | 7,05 | 0,3410 | -0,0269 | |||
| BRK.A / Berkshire Hathaway Inc. | 0,00 | 0,00 | 0,73 | -8,77 | 0,3408 | -0,0902 | |||
| GOOGL / Alphabet Inc. | 0,00 | 0,00 | 0,72 | 13,88 | 0,3379 | -0,0044 | |||
| MRK / Merck & Co., Inc. | 0,01 | 126,00 | 0,72 | 99,16 | 0,3346 | 0,1408 | |||
| WTW / Willis Towers Watson Public Limited Company | 0,00 | -2,31 | 0,65 | -11,35 | 0,3031 | -0,0918 | |||
| FBIN / Fortune Brands Innovations, Inc. | 0,01 | 0,00 | 0,59 | -15,43 | 0,2769 | -0,1011 | |||
| NTRA / Natera, Inc. | 0,00 | 0,59 | 0,2765 | 0,2765 | |||||
| LRCX / Lam Research Corporation | 0,01 | 0,00 | 0,58 | 33,87 | 0,2719 | 0,0375 | |||
| FVRR / Fiverr International Ltd. | 0,02 | 43,48 | 0,58 | 77,91 | 0,2716 | 0,0952 | |||
| BMA / Banco Macro S.A. - Depositary Receipt (Common Stock) | 0,01 | 0,00 | 0,55 | -6,93 | 0,2577 | -0,0623 | |||
| CB / Chubb Limited | 0,00 | 0,00 | 0,51 | -3,98 | 0,2371 | -0,0482 | |||
| BHP / BHP Group Limited - Depositary Receipt (Common Stock) | 0,01 | -4,27 | 0,43 | -5,29 | 0,2014 | -0,0438 | |||
| PYPL / PayPal Holdings, Inc. | 0,01 | -4,24 | 0,42 | 9,11 | 0,1964 | -0,0115 | |||
| PHM / PulteGroup, Inc. | 0,00 | -2,49 | 0,41 | 0,00 | 0,1933 | -0,0298 | |||
| EBAY / eBay Inc. | 0,01 | -9,76 | 0,41 | -0,72 | 0,1933 | -0,0316 | |||
| IOT / Samsara Inc. | 0,01 | 25,00 | 0,40 | 29,74 | 0,1860 | 0,0205 | |||
| TATT / TAT Technologies Ltd. | 0,01 | 0,40 | 0,1857 | 0,1857 | |||||
| BBAR / Banco BBVA Argentina S.A. - Depositary Receipt (Common Stock) | 0,02 | 0,00 | 0,40 | -8,99 | 0,1847 | -0,0500 | |||
| TRV / The Travelers Companies, Inc. | 0,00 | 0,00 | 0,37 | 1,10 | 0,1725 | -0,0243 | |||
| JNJ / Johnson & Johnson | 0,00 | -4,20 | 0,35 | -11,90 | 0,1630 | -0,0502 | |||
| AFL / Aflac Incorporated | 0,00 | -11,11 | 0,34 | -15,75 | 0,1578 | -0,0583 | |||
| ON / ON Semiconductor Corporation | 0,01 | -3,15 | 0,32 | 24,81 | 0,1507 | 0,0112 | |||
| RIO / Rio Tinto Group - Depositary Receipt (Common Stock) | 0,01 | -2,73 | 0,31 | -5,45 | 0,1459 | -0,0325 | |||
| SUPV / Grupo Supervielle S.A. - Depositary Receipt (Common Stock) | 0,03 | 0,00 | 0,30 | -18,98 | 0,1419 | -0,0601 | |||
| VCYT / Veracyte, Inc. | 0,01 | -2,92 | 0,30 | -11,64 | 0,1387 | -0,0422 | |||
| BRK.B / Berkshire Hathaway Inc. | 0,00 | 0,00 | 0,29 | -8,78 | 0,1363 | -0,0362 | |||
| MDT / Medtronic plc | 0,00 | 0,00 | 0,25 | -3,12 | 0,1164 | -0,0221 | |||
| AZN / AstraZeneca PLC - Depositary Receipt (Common Stock) | 0,00 | -5,33 | 0,25 | -9,82 | 0,1160 | -0,0328 | |||
| CHKP / Check Point Software Technologies Ltd. | 0,00 | 0,22 | 0,1035 | 0,1035 | |||||
| GEHC / GE HealthCare Technologies Inc. | 0,00 | 0,00 | 0,21 | -8,33 | 0,0980 | -0,0253 | |||
| TXN / Texas Instruments Incorporated | 0,00 | 0,21 | 0,0971 | 0,0971 | |||||
| HOV / Hovnanian Enterprises, Inc. | 0,00 | 0,00 | 0,20 | -0,49 | 0,0953 | -0,0149 | |||
| HAL / Halliburton Company | 0,00 | -100,00 | 0,00 | 0,0000 | |||||
| GRAL / GRAIL, Inc. | 0,00 | -100,00 | 0,00 | 0,0000 | |||||
| LHX / L3Harris Technologies, Inc. | 0,00 | -100,00 | 0,00 | 0,0000 | |||||
| INMD / InMode Ltd. | 0,00 | -100,00 | 0,00 | 0,0000 | |||||
| MCK / McKesson Corporation | 0,00 | -100,00 | 0,00 | 0,0000 | |||||
| LMT / Lockheed Martin Corporation | 0,00 | -100,00 | 0,00 | 0,0000 | |||||
| BMY / Bristol-Myers Squibb Company | 0,00 | -100,00 | 0,00 | 0,0000 | |||||
| SPT / Sprout Social, Inc. | 0,00 | -100,00 | 0,00 | 0,0000 |