Statistiques de base
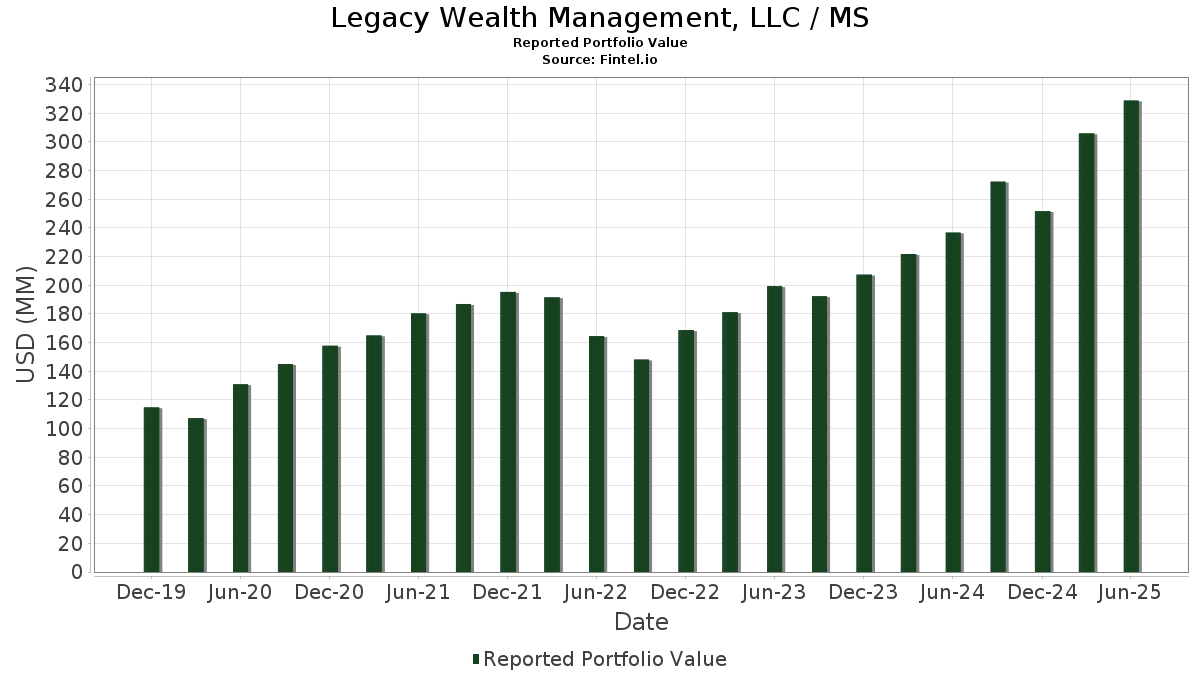
| Valeur du portefeuille | $ 328 852 648 |
| Positions actuelles | 90 |
Dernières positions, performances, ASG (à partir des dépôts 13F, 13D)
Legacy Wealth Management, LLC / MS a déclaré un total de 90 positions dans ses derniers dépôts auprès de la SEC. La valeur la plus récente du portefeuille est calculée à 328 852 648 USD. Les actifs sous gestion réels (ASG) sont cette valeur plus les liquidités (qui ne sont pas divulguées). Les principales positions de Legacy Wealth Management, LLC / MS sont SPDR S&P 500 ETF (US:SPY) , NVIDIA Corporation (US:NVDA) , Microsoft Corporation (US:MSFT) , Apple Inc. (US:AAPL) , and SPDR Series Trust - SPDR Portfolio S&P 500 ETF (US:SPLG) . Les nouvelles positions de Legacy Wealth Management, LLC / MS incluent Hubbell Incorporated (US:HUBB) , SPDR Series Trust - SPDR Portfolio S&P 600 Small Cap ETF (US:SPSM) , Invesco Exchange-Traded Self-Indexed Fund Trust - Invesco BulletShares 2030 Corporate Bond ETF (US:BSCU) , SPDR Series Trust - SPDR Portfolio Short Term Corporate Bond ETF (US:SPSB) , and .
Meilleures augmentations ce trimestre
Nous utilisons la variation de l'allocation du portefeuille car il s'agit de l'indicateur le plus significatif. Les changements peuvent être dus à des transactions ou à des variations de prix des actions.
| Titre | Actions (en millions) |
Valeur ($ en millions) |
% du portefeuille | ΔPortefeuille % |
|---|---|---|---|---|
| 0,32 | 50,43 | 15,3364 | 13,6965 | |
| 0,05 | 25,83 | 7,8546 | 1,3668 | |
| 0,02 | 2,89 | 0,8789 | 0,7918 | |
| 0,01 | 2,00 | 0,6088 | 0,6088 | |
| 0,00 | 1,76 | 0,5361 | 0,5361 | |
| 0,03 | 6,72 | 2,0442 | 0,5148 | |
| 0,02 | 0,86 | 0,2614 | 0,2614 | |
| 0,02 | 3,71 | 1,1275 | 0,2333 | |
| 0,05 | 9,45 | 2,8728 | 0,2031 | |
| 0,01 | 2,10 | 0,6374 | 0,1643 |
Principales baisses ce trimestre
Nous utilisons la variation de l'allocation du portefeuille car il s'agit de l'indicateur le plus significatif. Les changements peuvent être dus à des transactions ou à des variations de prix des actions.
| Titre | Actions (en millions) |
Valeur ($ en millions) |
% du portefeuille | ΔPortefeuille % |
|---|---|---|---|---|
| 0,11 | 22,43 | 6,8221 | -10,6165 | |
| 0,01 | 0,81 | 0,2466 | -0,7936 | |
| 0,01 | 3,79 | 1,1536 | -0,6003 | |
| 0,03 | 1,37 | 0,4154 | -0,5357 | |
| 0,02 | 7,29 | 2,2171 | -0,4608 | |
| 0,09 | 56,82 | 17,2769 | -0,4196 | |
| 0,01 | 1,54 | 0,4679 | -0,3766 | |
| 0,01 | 4,32 | 1,3133 | -0,3017 | |
| 0,11 | 2,06 | 0,6250 | -0,2464 | |
| 0,01 | 4,27 | 1,2981 | -0,1962 |
Déclarations 13F et dépôts de fonds
Ce formulaire a été déposé le 2025-07-01 pour la période de déclaration 2025-06-30. Cliquez sur l'icône du lien pour voir l'historique complet des transactions.
Mettre à niveau pour débloquer les données premium et exporter vers Excel ![]() .
.
| Titre | Type | Prix moyen de l'action | Actions (en millions) |
ΔActions (%) |
ΔActions (%) |
Valeur ($ en millions) |
Portefeuille (%) |
ΔPortefeuille (%) |
|
|---|---|---|---|---|---|---|---|---|---|
| SPY / SPDR S&P 500 ETF | 0,09 | -4,99 | 56,82 | 4,94 | 17,2769 | -0,4196 | |||
| NVDA / NVIDIA Corporation | 0,32 | 589,57 | 50,43 | 905,26 | 15,3364 | 13,6965 | |||
| MSFT / Microsoft Corporation | 0,05 | -1,79 | 25,83 | 30,14 | 7,8546 | 1,3668 | |||
| AAPL / Apple Inc. | 0,11 | -54,47 | 22,43 | -57,95 | 6,8221 | -10,6165 | |||
| SPLG / SPDR Series Trust - SPDR Portfolio S&P 500 ETF | 0,14 | -0,64 | 10,46 | 9,83 | 3,1806 | 0,0679 | |||
| PANW / Palo Alto Networks, Inc. | 0,05 | -3,55 | 9,45 | 15,67 | 2,8728 | 0,2031 | |||
| WMT / Walmart Inc. | 0,08 | -2,18 | 7,67 | 8,95 | 2,3320 | 0,0313 | |||
| GOOGL / Alphabet Inc. | 0,04 | -9,44 | 7,54 | 3,20 | 2,2926 | -0,0953 | |||
| V / Visa Inc. | 0,02 | -12,16 | 7,29 | -11,01 | 2,2171 | -0,4608 | |||
| AMZN / Amazon.com, Inc. | 0,03 | 24,59 | 6,72 | 43,66 | 2,0442 | 0,5148 | |||
| BSX / Boston Scientific Corporation | 0,05 | -3,75 | 5,35 | 2,49 | 1,6282 | -0,0795 | |||
| RTX / RTX Corporation | 0,04 | -4,61 | 5,32 | 5,16 | 1,6188 | -0,0359 | |||
| UNH / UnitedHealth Group Incorporated | 0,01 | 77,34 | 4,66 | 5,62 | 1,4172 | -0,0250 | |||
| TJX / The TJX Companies, Inc. | 0,04 | -3,00 | 4,66 | -1,65 | 1,4160 | -0,1316 | |||
| AJG / Arthur J. Gallagher & Co. | 0,01 | -5,73 | 4,32 | -12,59 | 1,3133 | -0,3017 | |||
| CB / Chubb Limited | 0,01 | -2,67 | 4,27 | -6,63 | 1,2981 | -0,1962 | |||
| HON / Honeywell International Inc. | 0,02 | -1,35 | 4,21 | 8,50 | 1,2810 | 0,0119 | |||
| TMO / Thermo Fisher Scientific Inc. | 0,01 | -13,23 | 3,79 | -29,30 | 1,1536 | -0,6003 | |||
| VTI / Vanguard Index Funds - Vanguard Total Stock Market ETF | 0,01 | -4,05 | 3,75 | 6,09 | 1,1390 | -0,0148 | |||
| DHR / Danaher Corporation | 0,02 | 40,65 | 3,71 | 35,54 | 1,1275 | 0,2333 | |||
| COST / Costco Wholesale Corporation | 0,00 | -3,13 | 3,68 | 1,38 | 1,1177 | -0,0672 | |||
| BAC / Bank of America Corporation | 0,08 | -2,78 | 3,63 | 10,24 | 1,1033 | 0,0275 | |||
| JPM / JPMorgan Chase & Co. | 0,01 | -4,56 | 3,61 | 12,79 | 1,0974 | 0,0516 | |||
| IQV / IQVIA Holdings Inc. | 0,02 | 14,47 | 3,50 | 2,34 | 1,0657 | -0,0538 | |||
| SYK / Stryker Corporation | 0,01 | -2,58 | 3,36 | 3,55 | 1,0215 | -0,0390 | |||
| LHX / L3Harris Technologies, Inc. | 0,01 | -1,36 | 3,27 | 18,21 | 0,9952 | 0,0903 | |||
| ABT / Abbott Laboratories | 0,02 | -3,64 | 3,24 | -1,19 | 0,9856 | -0,0866 | |||
| META / Meta Platforms, Inc. | 0,00 | -16,90 | 3,13 | 6,39 | 0,9514 | -0,0097 | |||
| COP / ConocoPhillips | 0,03 | 15,03 | 2,89 | -1,73 | 0,8791 | -0,0823 | |||
| IEX / IDEX Corporation | 0,02 | 1 017,65 | 2,89 | 986,47 | 0,8789 | 0,7918 | |||
| ZTS / Zoetis Inc. | 0,02 | -3,17 | 2,84 | -8,28 | 0,8628 | -0,1484 | |||
| EQH / Equitable Holdings, Inc. | 0,04 | -3,36 | 2,20 | 4,07 | 0,6694 | -0,0219 | |||
| AVGO / Broadcom Inc. | 0,01 | -12,03 | 2,10 | 44,85 | 0,6374 | 0,1643 | |||
| BSCT / Invesco Exchange-Traded Self-Indexed Fund Trust - Invesco BulletShares 2029 Corporate Bond ETF | 0,11 | -23,60 | 2,06 | -22,92 | 0,6250 | -0,2464 | |||
| ADBE / Adobe Inc. | 0,01 | 2,00 | 0,6088 | 0,6088 | |||||
| HUBB / Hubbell Incorporated | 0,00 | 1,76 | 0,5361 | 0,5361 | |||||
| LOW / Lowe's Companies, Inc. | 0,01 | -3,25 | 1,69 | -7,92 | 0,5124 | -0,0860 | |||
| UNP / Union Pacific Corporation | 0,01 | -1,79 | 1,58 | -4,36 | 0,4807 | -0,0595 | |||
| GOOG / Alphabet Inc. | 0,01 | 2,19 | 1,56 | 16,04 | 0,4754 | 0,0350 | |||
| XOM / Exxon Mobil Corporation | 0,01 | -34,30 | 1,54 | -40,46 | 0,4679 | -0,3766 | |||
| T / AT&T Inc. | 0,05 | -13,39 | 1,53 | -11,36 | 0,4651 | -0,0989 | |||
| MCD / McDonald's Corporation | 0,01 | 0,00 | 1,49 | -6,47 | 0,4527 | -0,0675 | |||
| MTDR / Matador Resources Company | 0,03 | -49,74 | 1,37 | -53,08 | 0,4154 | -0,5357 | |||
| ISRG / Intuitive Surgical, Inc. | 0,00 | -7,60 | 1,11 | 1,37 | 0,3374 | -0,0203 | |||
| PKB / Invesco Exchange-Traded Fund Trust - Invesco Building & Construction ETF | 0,01 | -14,29 | 1,10 | -10,14 | 0,3344 | -0,0654 | |||
| FTV / Fortive Corporation | 0,02 | -2,76 | 0,96 | -30,71 | 0,2917 | -0,1609 | |||
| AXP / American Express Company | 0,00 | 0,00 | 0,96 | 18,46 | 0,2910 | 0,0272 | |||
| BSCS / Invesco Exchange-Traded Self-Indexed Fund Trust - Invesco BulletShares 2028 Corporate Bond ETF | 0,05 | 6,52 | 0,93 | 7,23 | 0,2841 | -0,0006 | |||
| VOO / Vanguard Index Funds - Vanguard S&P 500 ETF | 0,00 | 0,00 | 0,93 | 10,56 | 0,2835 | 0,0078 | |||
| SPSM / SPDR Series Trust - SPDR Portfolio S&P 600 Small Cap ETF | 0,02 | 0,86 | 0,2614 | 0,2614 | |||||
| A / Agilent Technologies, Inc. | 0,01 | -74,74 | 0,81 | -74,51 | 0,2466 | -0,7936 | |||
| LDOS / Leidos Holdings, Inc. | 0,00 | 0,00 | 0,68 | 16,95 | 0,2080 | 0,0168 | |||
| BRK.B / Berkshire Hathaway Inc. | 0,00 | -26,87 | 0,68 | -33,30 | 0,2067 | -0,1264 | |||
| KKR / KKR & Co. Inc. | 0,01 | -32,53 | 0,67 | -22,34 | 0,2042 | -0,0785 | |||
| LIN / Linde plc | 0,00 | 0,00 | 0,67 | 0,76 | 0,2023 | -0,0135 | |||
| BLK / BlackRock, Inc. | 0,00 | 0,00 | 0,63 | 10,88 | 0,1924 | 0,0058 | |||
| CVX / Chevron Corporation | 0,00 | -10,58 | 0,61 | -23,46 | 0,1847 | -0,0747 | |||
| BSCR / Invesco Exchange-Traded Self-Indexed Fund Trust - Invesco BulletShares 2027 Corporate Bond ETF | 0,03 | 86,51 | 0,60 | 87,23 | 0,1830 | 0,0779 | |||
| OEF / iShares Trust - iShares S&P 100 ETF | 0,00 | 6,66 | 0,59 | 20,00 | 0,1807 | 0,0187 | |||
| KO / The Coca-Cola Company | 0,01 | 0,00 | 0,59 | -1,16 | 0,1807 | -0,0159 | |||
| VGT / Vanguard World Fund - Vanguard Information Technology ETF | 0,00 | -50,39 | 0,59 | -39,28 | 0,1792 | -0,1381 | |||
| BX / Blackstone Inc. | 0,00 | -35,05 | 0,59 | -30,52 | 0,1782 | -0,0974 | |||
| AMGN / Amgen Inc. | 0,00 | 0,00 | 0,54 | -10,45 | 0,1644 | -0,0328 | |||
| FI / Fiserv, Inc. | 0,00 | 0,00 | 0,52 | -21,90 | 0,1573 | -0,0593 | |||
| AME / AMETEK, Inc. | 0,00 | -5,34 | 0,50 | -0,60 | 0,1513 | -0,0121 | |||
| AVY / Avery Dennison Corporation | 0,00 | 0,00 | 0,42 | -1,41 | 0,1281 | -0,0116 | |||
| IWR / iShares Trust - iShares Russell Mid-Cap ETF | 0,00 | -60,53 | 0,39 | -57,38 | 0,1197 | -0,1818 | |||
| TRMK / Trustmark Corporation | 0,01 | -1,93 | 0,39 | 3,72 | 0,1186 | -0,0044 | |||
| ORCL / Oracle Corporation | 0,00 | -45,20 | 0,38 | -14,29 | 0,1169 | -0,0298 | |||
| IWB / iShares Trust - iShares Russell 1000 ETF | 0,00 | 0,00 | 0,36 | 10,56 | 0,1084 | 0,0031 | |||
| CSCO / Cisco Systems, Inc. | 0,00 | -0,56 | 0,34 | 12,04 | 0,1019 | 0,0039 | |||
| HD / The Home Depot, Inc. | 0,00 | -6,03 | 0,32 | -5,88 | 0,0973 | -0,0140 | |||
| GAB / The Gabelli Equity Trust Inc. | 0,05 | 184,29 | 0,31 | 200,00 | 0,0933 | 0,0599 | |||
| SPTM / SPDR Series Trust - SPDR Portfolio S&P 1500 Composite Stock Market ETF | 0,00 | -46,45 | 0,30 | -41,07 | 0,0904 | -0,0744 | |||
| EGP / EastGroup Properties, Inc. | 0,00 | 0,94 | 0,27 | -4,27 | 0,0818 | -0,0101 | |||
| NXPI / NXP Semiconductors N.V. | 0,00 | -34,51 | 0,27 | -24,79 | 0,0815 | -0,0348 | |||
| VCSH / Vanguard Scottsdale Funds - Vanguard Short-Term Corporate Bond ETF | 0,00 | -57,20 | 0,26 | -57,00 | 0,0805 | -0,1202 | |||
| SPGI / S&P Global Inc. | 0,00 | 0,00 | 0,26 | 3,54 | 0,0802 | -0,0029 | |||
| TSME / Thrivent ETF Trust - Thrivent Small-Mid Cap Equity ETF | 0,01 | 0,26 | 0,0792 | 0,0792 | |||||
| CRWD / CrowdStrike Holdings, Inc. | 0,00 | -36,36 | 0,26 | -8,13 | 0,0791 | -0,0134 | |||
| NEE / NextEra Energy, Inc. | 0,00 | 0,00 | 0,26 | -1,92 | 0,0780 | -0,0076 | |||
| CHY / Calamos Convertible and High Income Fund | 0,02 | 68,65 | 0,25 | 84,33 | 0,0753 | 0,0312 | |||
| BSCU / Invesco Exchange-Traded Self-Indexed Fund Trust - Invesco BulletShares 2030 Corporate Bond ETF | 0,01 | 0,25 | 0,0749 | 0,0749 | |||||
| CHI / Calamos Convertible Opportunities and Income Fund | 0,02 | 71,98 | 0,24 | 88,98 | 0,0732 | 0,0315 | |||
| IWM / iShares Trust - iShares Russell 2000 ETF | 0,00 | -43,37 | 0,24 | -38,87 | 0,0729 | -0,0550 | |||
| MLPA / Global X Funds - Global X MLP ETF | 0,00 | 0,00 | 0,24 | -5,60 | 0,0718 | -0,0100 | |||
| SPSB / SPDR Series Trust - SPDR Portfolio Short Term Corporate Bond ETF | 0,01 | 0,24 | 0,0717 | 0,0717 | |||||
| AZN / AstraZeneca PLC - Depositary Receipt (Common Stock) | 0,00 | 0,00 | 0,23 | -5,04 | 0,0690 | -0,0090 | |||
| LLY / Eli Lilly and Company | 0,00 | 0,00 | 0,22 | -5,68 | 0,0659 | -0,0092 | |||
| BSCQ / Invesco Exchange-Traded Self-Indexed Fund Trust - Invesco BulletShares 2026 Corporate Bond ETF | 0,01 | -26,22 | 0,20 | -26,22 | 0,0601 | -0,0273 | |||
| CP / Canadian Pacific Kansas City Limited | 0,00 | -100,00 | 0,00 | 0,0000 | |||||
| LRCX / Lam Research Corporation | 0,00 | -100,00 | 0,00 | 0,0000 | |||||
| BRO / Brown & Brown, Inc. | 0,00 | -100,00 | 0,00 | 0,0000 | |||||
| EW / Edwards Lifesciences Corporation | 0,00 | -100,00 | 0,00 | 0,0000 | |||||
| JNJ / Johnson & Johnson | 0,00 | -100,00 | 0,00 | 0,0000 | |||||
| CPK / Chesapeake Utilities Corporation | 0,00 | -100,00 | 0,00 | 0,0000 | |||||
| AMLP / ALPS ETF Trust - Alerian MLP ETF | 0,00 | -100,00 | 0,00 | 0,0000 | |||||
| WAL / Western Alliance Bancorporation | 0,00 | -100,00 | 0,00 | 0,0000 | |||||
| CNI / Canadian National Railway Company | 0,00 | -100,00 | 0,00 | 0,0000 | |||||
| ES / Eversource Energy | 0,00 | -100,00 | 0,00 | 0,0000 | |||||
| ABBV / AbbVie Inc. | 0,00 | -100,00 | 0,00 | 0,0000 | |||||
| CSQ / Calamos Strategic Total Return Fund | 0,00 | -100,00 | 0,00 | 0,0000 | |||||
| CRM / Salesforce, Inc. | 0,00 | -100,00 | 0,00 | 0,0000 |