Statistiques de base
| Valeur du portefeuille | $ 849 591 825 |
| Positions actuelles | 68 |
Dernières positions, performances, ASG (à partir des dépôts 13F, 13D)
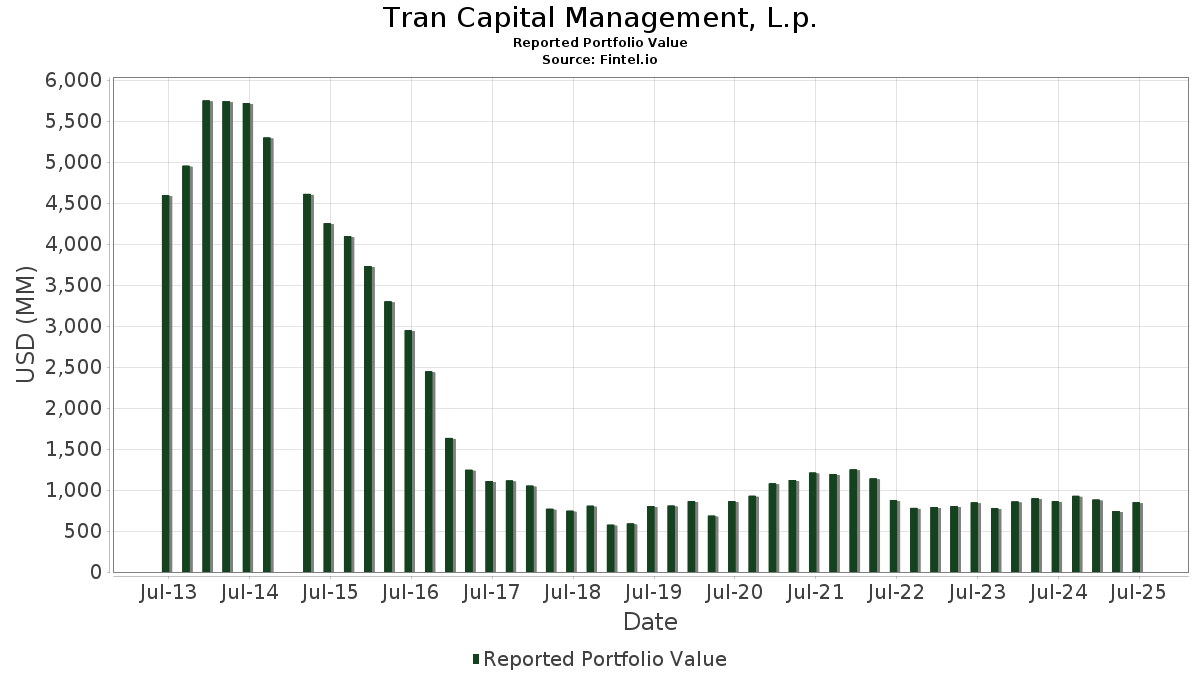
Tran Capital Management, L.p. a déclaré un total de 68 positions dans ses derniers dépôts auprès de la SEC. La valeur la plus récente du portefeuille est calculée à 849 591 825 USD. Les actifs sous gestion réels (ASG) sont cette valeur plus les liquidités (qui ne sont pas divulguées). Les principales positions de Tran Capital Management, L.p. sont Microsoft Corporation (US:MSFT) , Amazon.com, Inc. (US:AMZN) , NVIDIA Corporation (US:NVDA) , Talen Energy Corporation (US:TLN) , and Meta Platforms, Inc. (US:META) . Les nouvelles positions de Tran Capital Management, L.p. incluent Capital One Financial Corporation (IT:1COF) , Tenet Healthcare Corporation (US:THC) , LPL Financial Holdings Inc. (US:LPLA) , Markel Group Inc. (US:MKL) , and .
Meilleures augmentations ce trimestre
Nous utilisons la variation de l'allocation du portefeuille car il s'agit de l'indicateur le plus significatif. Les changements peuvent être dus à des transactions ou à des variations de prix des actions.
| Titre | Actions (en millions) |
Valeur ($ en millions) |
% du portefeuille | ΔPortefeuille % |
|---|---|---|---|---|
| 0,01 | 19,18 | 2,2573 | 1,9523 | |
| 0,04 | 14,32 | 1,6856 | 1,6856 | |
| 0,06 | 31,34 | 3,6890 | 1,5563 | |
| 0,06 | 13,11 | 1,5433 | 1,5433 | |
| 0,38 | 60,56 | 7,1277 | 1,4151 | |
| 0,01 | 17,39 | 2,0472 | 1,2786 | |
| 0,13 | 65,95 | 7,7627 | 0,9629 | |
| 0,20 | 43,37 | 5,1048 | 0,7441 | |
| 0,04 | 6,24 | 0,7341 | 0,7341 | |
| 0,06 | 44,91 | 5,2866 | 0,4947 |
Principales baisses ce trimestre
Nous utilisons la variation de l'allocation du portefeuille car il s'agit de l'indicateur le plus significatif. Les changements peuvent être dus à des transactions ou à des variations de prix des actions.
| Titre | Actions (en millions) |
Valeur ($ en millions) |
% du portefeuille | ΔPortefeuille % |
|---|---|---|---|---|
| 0,00 | 0,39 | 0,0463 | -2,4031 | |
| 0,01 | 0,74 | 0,0876 | -1,2219 | |
| 0,18 | 35,99 | 4,2361 | -1,0184 | |
| 0,11 | 26,00 | 3,0603 | -0,9023 | |
| 0,13 | 30,56 | 3,5969 | -0,6183 | |
| 0,05 | 8,86 | 1,0430 | -0,4023 | |
| 0,09 | 25,12 | 2,9572 | -0,3987 | |
| 0,29 | 23,00 | 2,7077 | -0,3703 | |
| 0,04 | 11,83 | 1,3923 | -0,3134 | |
| 0,03 | 10,92 | 1,2850 | -0,2327 |
Déclarations 13F et dépôts de fonds
Ce formulaire a été déposé le 2025-07-14 pour la période de déclaration 2025-06-30. Cliquez sur l'icône du lien pour voir l'historique complet des transactions.
Mettre à niveau pour débloquer les données premium et exporter vers Excel ![]() .
.
| Titre | Type | Prix moyen de l'action | Actions (en millions) |
ΔActions (%) |
ΔActions (%) |
Valeur ($ en millions) |
Portefeuille (%) |
ΔPortefeuille (%) |
|
|---|---|---|---|---|---|---|---|---|---|
| MSFT / Microsoft Corporation | 0,13 | -1,52 | 65,95 | 30,49 | 7,7627 | 0,9629 | |||
| AMZN / Amazon.com, Inc. | 0,29 | -1,57 | 64,12 | 13,50 | 7,5477 | -0,0535 | |||
| NVDA / NVIDIA Corporation | 0,38 | -2,17 | 60,56 | 42,62 | 7,1277 | 1,4151 | |||
| TLN / Talen Energy Corporation | 0,20 | -23,74 | 59,19 | 11,06 | 6,9668 | -0,2038 | |||
| META / Meta Platforms, Inc. | 0,06 | -1,53 | 44,91 | 26,10 | 5,2866 | 0,4947 | |||
| FERG / Ferguson Enterprises Inc. | 0,20 | -1,54 | 43,37 | 33,81 | 5,1048 | 0,7441 | |||
| PANW / Palo Alto Networks, Inc. | 0,19 | -1,31 | 38,25 | 18,36 | 4,5025 | 0,1543 | |||
| DHR / Danaher Corporation | 0,18 | -4,37 | 35,99 | -7,85 | 4,2361 | -1,0184 | |||
| INTU / Intuit Inc. | 0,04 | -0,83 | 32,37 | 27,21 | 3,8104 | 0,3867 | |||
| MLM / Martin Marietta Materials, Inc. | 0,06 | 4,84 | 32,01 | 20,38 | 3,7676 | 0,1900 | |||
| GEV / GE Vernova Inc. | 0,06 | 14,07 | 31,34 | 97,72 | 3,6890 | 1,5563 | |||
| TSM / Taiwan Semiconductor Manufacturing Company Limited - Depositary Receipt (Common Stock) | 0,13 | -28,51 | 30,56 | -2,46 | 3,5969 | -0,6183 | |||
| VEEV / Veeva Systems Inc. | 0,10 | -0,56 | 27,56 | 23,63 | 3,2444 | 0,2447 | |||
| TMUS / T-Mobile US, Inc. | 0,11 | -1,19 | 26,00 | -11,73 | 3,0603 | -0,9023 | |||
| CRM / Salesforce, Inc. | 0,09 | -0,88 | 25,12 | 0,72 | 2,9572 | -0,3987 | |||
| CSGP / CoStar Group, Inc. | 0,29 | -0,91 | 23,00 | 0,55 | 2,7077 | -0,3703 | |||
| FICO / Fair Isaac Corporation | 0,01 | 753,62 | 19,18 | 746,29 | 2,2573 | 1,9523 | |||
| GTLB / GitLab Inc. | 0,41 | 28,34 | 18,33 | 23,18 | 2,1570 | 0,1555 | |||
| GOOGL / Alphabet Inc. | 0,10 | -1,69 | 17,68 | 12,03 | 2,0812 | -0,0422 | |||
| NFLX / Netflix, Inc. | 0,01 | 112,01 | 17,39 | 204,48 | 2,0472 | 1,2786 | |||
| SCHW / The Charles Schwab Corporation | 0,17 | -7,22 | 15,10 | 8,14 | 1,7777 | -0,1013 | |||
| ELV / Elevance Health, Inc. | 0,04 | 14,32 | 1,6856 | 1,6856 | |||||
| 1COF / Capital One Financial Corporation | 0,06 | 13,11 | 1,5433 | 1,5433 | |||||
| PGR / The Progressive Corporation | 0,04 | -1,05 | 11,83 | -6,70 | 1,3923 | -0,3134 | |||
| SHW / The Sherwin-Williams Company | 0,03 | -1,58 | 10,92 | -3,23 | 1,2850 | -0,2327 | |||
| NKE / NIKE, Inc. | 0,13 | 27,69 | 9,05 | 42,89 | 1,0656 | 0,2132 | |||
| AER / AerCap Holdings N.V. | 0,08 | -0,91 | 8,93 | 13,47 | 1,0510 | -0,0077 | |||
| EXPE / Expedia Group, Inc. | 0,05 | -17,80 | 8,86 | -17,51 | 1,0430 | -0,4023 | |||
| APD / Air Products and Chemicals, Inc. | 0,03 | -2,65 | 8,16 | -6,90 | 0,9600 | -0,2185 | |||
| THC / Tenet Healthcare Corporation | 0,04 | 6,24 | 0,7341 | 0,7341 | |||||
| ACN / Accenture plc | 0,01 | -3,78 | 3,57 | -7,82 | 0,4204 | -0,1009 | |||
| GGG / Graco Inc. | 0,02 | -13,24 | 2,00 | -10,67 | 0,2355 | -0,0659 | |||
| AAPL / Apple Inc. | 0,01 | -0,39 | 1,89 | -8,01 | 0,2230 | -0,0540 | |||
| EXR / Extra Space Storage Inc. | 0,01 | 0,00 | 1,76 | -0,68 | 0,2067 | -0,0312 | |||
| KEYS / Keysight Technologies, Inc. | 0,01 | -8,90 | 1,32 | -0,30 | 0,1550 | -0,0228 | |||
| ADP / Automatic Data Processing, Inc. | 0,00 | 0,00 | 1,21 | 1,00 | 0,1425 | -0,0189 | |||
| PAYX / Paychex, Inc. | 0,01 | 0,00 | 1,15 | -5,67 | 0,1350 | -0,0287 | |||
| SPY / SPDR S&P 500 ETF | 0,00 | 0,00 | 1,12 | 10,45 | 0,1318 | -0,0046 | |||
| NTAP / NetApp, Inc. | 0,01 | 0,00 | 1,08 | 21,28 | 0,1275 | 0,0074 | |||
| TSLA / Tesla, Inc. | 0,00 | 0,00 | 1,01 | 22,71 | 0,1183 | 0,0080 | |||
| LPLA / LPL Financial Holdings Inc. | 0,00 | 0,96 | 0,1127 | 0,1127 | |||||
| LHX / L3Harris Technologies, Inc. | 0,00 | 0,00 | 0,89 | 19,76 | 0,1043 | 0,0048 | |||
| LLY / Eli Lilly and Company | 0,00 | 0,00 | 0,88 | -5,60 | 0,1033 | -0,0218 | |||
| AFL / Aflac Incorporated | 0,01 | 0,00 | 0,84 | -5,17 | 0,0993 | -0,0204 | |||
| TXN / Texas Instruments Incorporated | 0,00 | 0,00 | 0,78 | 15,49 | 0,0923 | 0,0010 | |||
| ENTG / Entegris, Inc. | 0,01 | -91,70 | 0,74 | -92,36 | 0,0876 | -1,2219 | |||
| DIS / The Walt Disney Company | 0,01 | 0,00 | 0,72 | 25,57 | 0,0845 | 0,0076 | |||
| EEM / iShares, Inc. - iShares MSCI Emerging Markets ETF | 0,01 | 7,09 | 0,64 | 18,17 | 0,0759 | 0,0025 | |||
| CSCO / Cisco Systems, Inc. | 0,01 | 0,00 | 0,59 | 12,40 | 0,0694 | -0,0012 | |||
| AMD / Advanced Micro Devices, Inc. | 0,00 | -2,52 | 0,55 | 34,56 | 0,0647 | 0,0098 | |||
| MKL / Markel Group Inc. | 0,00 | 0,54 | 0,0637 | 0,0637 | |||||
| SCHP / Schwab Strategic Trust - Schwab U.S. TIPS ETF | 0,02 | 0,00 | 0,49 | -0,81 | 0,0574 | -0,0087 | |||
| SCHR / Schwab Strategic Trust - Schwab Intermediate-Term U.S. Treasury ETF | 0,02 | 0,00 | 0,48 | 0,63 | 0,0569 | -0,0077 | |||
| RSP / Invesco Exchange-Traded Fund Trust - Invesco S&P 500 Equal Weight ETF | 0,00 | 0,00 | 0,47 | 4,97 | 0,0548 | -0,0049 | |||
| XYZ / Block, Inc. | 0,01 | 0,00 | 0,46 | 25,07 | 0,0541 | 0,0046 | |||
| IEFA / iShares Trust - iShares Core MSCI EAFE ETF | 0,01 | 15,30 | 0,46 | 27,37 | 0,0537 | 0,0055 | |||
| IWM / iShares Trust - iShares Russell 2000 ETF | 0,00 | 0,05 | 0,45 | 8,41 | 0,0531 | -0,0030 | |||
| VMBS / Vanguard Scottsdale Funds - Vanguard Mortgage-Backed Securities ETF | 0,01 | 0,00 | 0,39 | 0,25 | 0,0464 | -0,0066 | |||
| BLDR / Builders FirstSource, Inc. | 0,00 | -97,69 | 0,39 | -97,84 | 0,0463 | -2,4031 | |||
| IEF / iShares Trust - iShares 7-10 Year Treasury Bond ETF | 0,00 | 0,00 | 0,33 | 0,30 | 0,0389 | -0,0054 | |||
| BFB / Brown-Forman Corp. - Class B | 0,01 | 0,00 | 0,31 | -20,66 | 0,0367 | -0,0162 | |||
| HD / The Home Depot, Inc. | 0,00 | 0,00 | 0,28 | 0,00 | 0,0333 | -0,0047 | |||
| AHR / American Healthcare REIT, Inc. | 0,01 | 0,00 | 0,27 | 21,62 | 0,0318 | 0,0018 | |||
| JNJ / Johnson & Johnson | 0,00 | 0,00 | 0,24 | -7,92 | 0,0288 | -0,0069 | |||
| BRK.B / Berkshire Hathaway Inc. | 0,00 | 0,00 | 0,24 | -9,02 | 0,0286 | -0,0072 | |||
| JPM / JPMorgan Chase & Co. | 0,00 | 0,23 | 0,0273 | 0,0273 | |||||
| PFF / iShares Trust - iShares Preferred and Income Securities ETF | 0,01 | 0,00 | 0,22 | 0,00 | 0,0257 | -0,0037 | |||
| TECH / Bio-Techne Corporation | 0,00 | 0,00 | 0,21 | -12,39 | 0,0242 | -0,0073 | |||
| IQV / IQVIA Holdings Inc. | 0,00 | -100,00 | 0,00 | 0,0000 | |||||
| ELF / e.l.f. Beauty, Inc. | 0,00 | -100,00 | 0,00 | 0,0000 | |||||
| JEF / Jefferies Financial Group Inc. | 0,00 | -100,00 | 0,00 | 0,0000 |