Statistiques de base
| Profil de l'initié | KKR Credit Advisors (US) LLC |
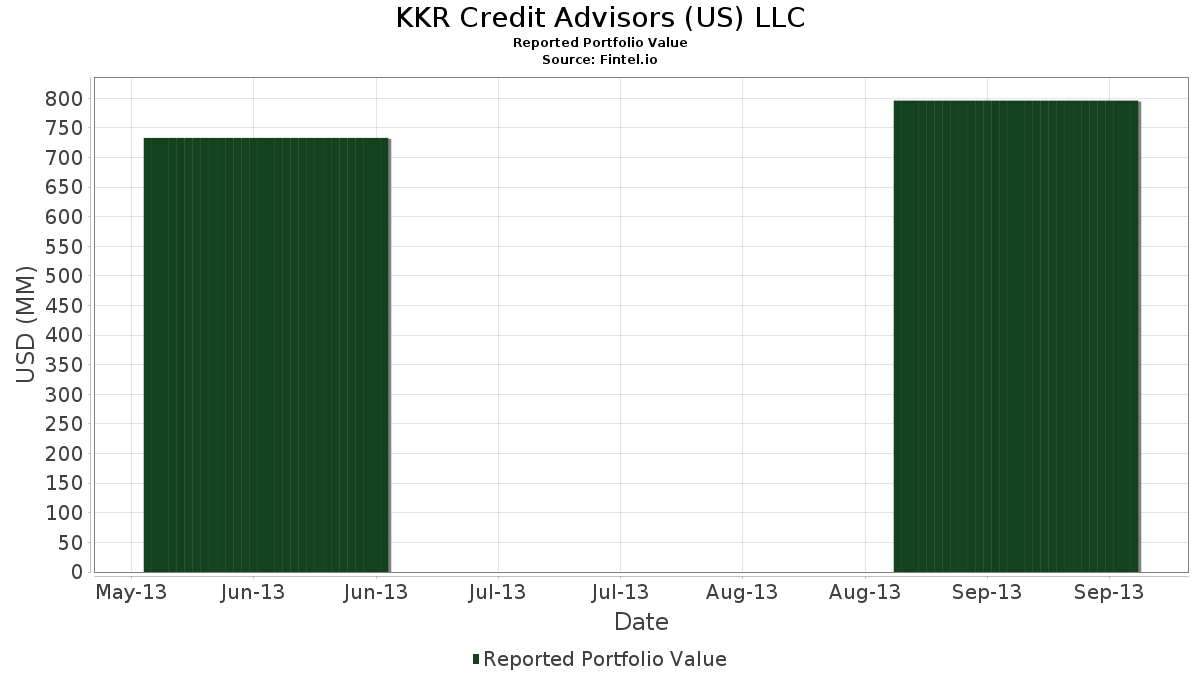
| Valeur du portefeuille | $ 796 306 000 |
| Positions actuelles | 63 |
Dernières positions, performances, ASG (à partir des dépôts 13F, 13D)
KKR Credit Advisors (US) LLC a déclaré un total de 63 positions dans ses derniers dépôts auprès de la SEC. La valeur la plus récente du portefeuille est calculée à 796 306 000 USD. Les actifs sous gestion réels (ASG) sont cette valeur plus les liquidités (qui ne sont pas divulguées). Les principales positions de KKR Credit Advisors (US) LLC sont Masonite International Corporation (US:DOOR) , Amedisys, Inc. (US:AMED) , Verint Systems Inc. (US:VRNT) , Wyndham Destinations, Inc. (US:) , and Comcast Corporation (US:CMCSA) . Les nouvelles positions de KKR Credit Advisors (US) LLC incluent Masonite International Corporation (US:DOOR) , Wyndham Destinations, Inc. (US:) , Lamar Advertising Company (US:LAMR) , Cameron International Corporation (US:CAM) , and Stillwater Mining Company (US:SWC) .
Meilleures augmentations ce trimestre
Nous utilisons la variation de l'allocation du portefeuille car il s'agit de l'indicateur le plus significatif. Les changements peuvent être dus à des transactions ou à des variations de prix des actions.
| Titre | Actions (en millions) |
Valeur ($ en millions) |
% du portefeuille | ΔPortefeuille % |
|---|---|---|---|---|
| 1,24 | 60,54 | 7,6021 | 7,6021 | |
| 2,92 | 50,21 | 6,3056 | 5,1007 | |
| 0,78 | 28,97 | 3,6378 | 3,6378 | |
| 0,47 | 28,66 | 3,5986 | 3,5986 | |
| 0,52 | 22,37 | 2,8096 | 2,8096 | |
| 0,45 | 21,16 | 2,6578 | 2,6578 | |
| 0,12 | 19,45 | 2,4420 | 2,4420 | |
| 0,33 | 19,09 | 2,3969 | 2,3969 | |
| 0,02 | 18,66 | 2,3429 | 2,3429 | |
| 1,67 | 18,38 | 2,3077 | 2,3077 |
Principales baisses ce trimestre
Nous utilisons la variation de l'allocation du portefeuille car il s'agit de l'indicateur le plus significatif. Les changements peuvent être dus à des transactions ou à des variations de prix des actions.
| Titre | Actions (en millions) |
Valeur ($ en millions) |
% du portefeuille | ΔPortefeuille % |
|---|---|---|---|---|
| 0,00 | 0,00 | -2,4618 | ||
| 0,00 | 0,00 | -2,1002 | ||
| 0,00 | 0,00 | -2,0120 | ||
| 0,00 | 0,00 | -1,9392 | ||
| 0,00 | 0,00 | -1,3642 | ||
| 0,00 | 0,00 | -0,9732 | ||
| 0,11 | 9,44 | 1,1851 | -0,7655 | |
| 0,00 | 0,00 | -0,3220 | ||
| 0,00 | 0,00 | -0,0803 | ||
| 0,33 | 15,33 | 1,9254 | -0,0374 |
Déclarations 13F et dépôts de fonds
Ce formulaire a été déposé le 2013-11-14 pour la période de déclaration 2013-09-30. Cliquez sur l'icône du lien pour voir l'historique complet des transactions.
Mettre à niveau pour débloquer les données premium et exporter vers Excel ![]() .
.
| Titre | Type | Prix moyen de l'action | Actions (en millions) |
ΔActions (%) |
ΔActions (%) |
Valeur ($ en millions) |
Portefeuille (%) |
ΔPortefeuille (%) |
|
|---|---|---|---|---|---|---|---|---|---|
| DOOR / Masonite International Corporation | 1,24 | 60,54 | 7,6021 | 7,6021 | |||||
| AMED / Amedisys, Inc. | 2,92 | 283,52 | 50,21 | 468,33 | 6,3056 | 5,1007 | |||
| VRNT / Verint Systems Inc. | 0,78 | -52,51 | 28,97 | -50,39 | 3,6378 | 3,6378 | |||
| / Wyndham Destinations, Inc. | 0,47 | 28,66 | 3,5986 | 3,5986 | |||||
| CMCSA / Comcast Corporation | 0,54 | 55,88 | 24,45 | 68,45 | 3,0707 | 1,0910 | |||
| CIT / CIT Group Inc | 0,49 | 8,92 | 23,95 | 13,91 | 3,0071 | 0,1403 | |||
| RLGY / Realogy Holdings Corp | 0,52 | 31,06 | 22,37 | 17,37 | 2,8096 | 2,8096 | |||
| LAMR / Lamar Advertising Company | Call | 0,45 | 21,16 | 2,6578 | 2,6578 | ||||
| GM / General Motors Company | 0,59 | 0,00 | 21,16 | 7,98 | 2,6566 | -0,0151 | |||
| COMVERSE INC / (20585P105) | 0,62 | 19,70 | 0,0000 | ||||||
| PPG / PPG Industries, Inc. | 0,12 | -13,39 | 19,45 | -1,18 | 2,4420 | 2,4420 | |||
| PTEN / Patterson-UTI Energy, Inc. | 0,90 | 227,86 | 19,22 | 262,18 | 2,4138 | 1,6900 | |||
| ENB / Enbridge Inc. | 0,46 | 16,57 | 19,20 | 15,66 | 2,4111 | 0,1471 | |||
| CAM / Cameron International Corporation | 0,33 | 19,09 | 2,3969 | 2,3969 | |||||
| GOOGL / Alphabet Inc. | 0,02 | -0,47 | 18,66 | -0,97 | 2,3429 | 2,3429 | |||
| SWC / Stillwater Mining Company | 1,67 | 18,38 | 2,3077 | 2,3077 | |||||
| UNP / Union Pacific Corporation | 0,12 | 92,68 | 17,99 | 94,00 | 2,2589 | 0,9944 | |||
| APD / Air Products and Chemicals, Inc. | 0,15 | 15,68 | 1,9686 | 1,9686 | |||||
| NWSA / News Corporation | 0,97 | 229,39 | 15,66 | 246,90 | 1,9665 | 1,3508 | |||
| LAMR / Lamar Advertising Company | 0,33 | -1,72 | 15,33 | 6,53 | 1,9254 | -0,0374 | |||
| ITT / ITT Inc. | 0,41 | 14,56 | 1,8284 | 1,8284 | |||||
| FDX / FedEx Corporation | 0,13 | 14,44 | 1,8127 | 1,8127 | |||||
| EBAY / eBay Inc. | 0,26 | -54,62 | 14,26 | -51,04 | 1,7903 | 1,7903 | |||
| PCP / Precision Castparts Corporation | 0,06 | -1,90 | 14,09 | -1,37 | 1,7693 | 1,7693 | |||
| HAL / Halliburton Company | 0,29 | 165,08 | 13,96 | 205,96 | 1,7536 | 1,1312 | |||
| BEAM / Beam Therapeutics Inc. | 0,20 | -9,24 | 12,99 | -7,03 | 1,6319 | 1,6319 | |||
| EXP / Eagle Materials Inc. | 0,17 | -35,41 | 12,48 | -29,29 | 1,5671 | 1,5671 | |||
| HES / Hess Corporation | 0,15 | -30,27 | 11,92 | -18,89 | 1,4967 | 1,4967 | |||
| MDLZ / Mondelez International, Inc. | 0,37 | 11,69 | 1,4679 | 1,4679 | |||||
| XLV / The Select Sector SPDR Trust - The Health Care Select Sector SPDR Fund | 0,23 | -16,44 | 11,65 | -11,20 | 1,4631 | 1,4631 | |||
| MS / Morgan Stanley | 0,40 | 10,72 | 1,3463 | 1,3463 | |||||
| EMC / Global X Funds - Global X Emerging Markets Great Consumer ETF | 0,42 | 25,75 | 10,68 | 36,08 | 1,3417 | 0,2710 | |||
| CX / CEMEX, S.A.B. de C.V. - Depositary Receipt (Common Stock) | 0,94 | 10,51 | 1,3197 | 1,3197 | |||||
| AAP / Advance Auto Parts, Inc. | 0,12 | 9,91 | 1,2449 | 1,2449 | |||||
| EOG / EOG Resources, Inc. | 0,06 | -35,59 | 9,84 | -17,20 | 1,2351 | 1,2351 | |||
| ETN / Eaton Corporation plc | 0,14 | 9,78 | 1,2275 | 1,2275 | |||||
| HD / The Home Depot, Inc. | 0,13 | -27,09 | 9,51 | -28,62 | 1,1945 | 1,1945 | |||
| WBC / Wabco Holdings, Inc. | 0,11 | -41,51 | 9,44 | -34,02 | 1,1851 | -0,7655 | |||
| OMC / Omnicom Group Inc. | 0,15 | 9,27 | 1,1640 | 1,1640 | |||||
| VSI / Vitamin Shoppe, Inc. | 0,21 | 308,31 | 9,11 | 298,34 | 1,1440 | 0,8321 | |||
| GM.WS.A / General Motors Company | 0,31 | 0,00 | 8,25 | 10,08 | 1,0365 | 1,0365 | |||
| BEAV / B/E Aerospace, Inc. | 0,10 | -55,90 | 7,28 | -48,39 | 0,9141 | 0,9141 | |||
| JAH / Jarden Corporation | 0,15 | 7,26 | 0,9117 | 0,9117 | |||||
| RLGY / Realogy Holdings Corp | Call | 0,16 | 6,88 | 0,8644 | 0,8644 | ||||
| TWC / Spectrum Management Holding Company LLC | 0,06 | -59,34 | 6,88 | -59,66 | 0,8634 | 0,8634 | |||
| PRU / Prudential Financial, Inc. | 0,08 | 6,54 | 0,8217 | 0,8217 | |||||
| MET / MetLife, Inc. | 0,14 | 6,54 | 0,8213 | 0,8213 | |||||
| GM.WS.B / General Motors Company - Warrants 07/10/2019 | 0,31 | 0,00 | 5,81 | 13,76 | 0,7297 | 0,7297 | |||
| HP / Helmerich & Payne, Inc. | 0,05 | 3,72 | 0,4675 | 0,4675 | |||||
| BHI / Baker Hughes Inc. | 0,07 | -26,83 | 3,68 | -22,10 | 0,4625 | 0,4625 | |||
| PM / Philip Morris International Inc. | 0,04 | 3,55 | 0,4458 | 0,4458 | |||||
| / Wyndham Destinations, Inc. | 0,18 | 3,54 | 0,4444 | 0,4444 | |||||
| US20605P1012 / Concho Resources, Inc. | 0,03 | 3,11 | 0,3908 | 0,3908 | |||||
| GTIV / Gentiva Health Services Inc | 0,19 | 2,24 | 0,2812 | 0,2812 | |||||
| JO / Barclays Bank PLC - ZC SP ETN REDEEM 23/01/2048 USD 50 - Ser B_BJO | 0,08 | 2,07 | 0,2603 | 0,2603 | |||||
| ATHL / | 0,04 | 1,42 | 0,1782 | 0,1782 | |||||
| EWZ / iShares, Inc. - iShares MSCI Brazil ETF | 0,03 | 1,32 | 0,1660 | 0,1660 | |||||
| LPI / Laredo Petroleum Inc. | 0,04 | 1,21 | 0,1525 | 0,1525 | |||||
| XEC / Cimarex Energy Co. | 0,01 | 1,20 | 0,1501 | 0,1501 | |||||
| EWW / iShares, Inc. - iShares MSCI Mexico ETF | 0,02 | 1,17 | 0,1468 | 0,1468 | |||||
| GLDD / Great Lakes Dredge & Dock Corporation | 0,12 | 0,00 | 0,85 | -5,12 | 0,1071 | 0,1071 | |||
| ESSX / Essex Rental Corp. | 0,20 | 0,70 | 0,0874 | 0,0874 | |||||
| AGO / Assured Guaranty Ltd. | 0,03 | 0,47 | 0,0593 | 0,0593 | |||||
| TPR / Tapestry, Inc. | Put | 0,00 | -100,00 | 0,00 | -100,00 | -0,9732 | |||
| IP / International Paper Company | 0,00 | -100,00 | 0,00 | -100,00 | 0,0000 | 0,0000 | |||
| SPB / Spectrum Brands Holdings, Inc. | 0,00 | -100,00 | 0,00 | -100,00 | 0,0000 | 0,0000 | |||
| QCOM / QUALCOMM Incorporated | 0,00 | -100,00 | 0,00 | -100,00 | 0,0000 | 0,0000 | |||
| CVC / Cablevision Systems Corp. | 0,00 | -100,00 | 0,00 | -100,00 | -0,0803 | ||||
| XHB / SPDR Series Trust - SPDR S&P Homebuilders ETF | Call | 0,00 | -100,00 | 0,00 | -100,00 | 0,0000 | 0,0000 | ||
| EVTC / EVERTEC, Inc. | 0,00 | -100,00 | 0,00 | -100,00 | 0,0000 | ||||
| XLF / The Select Sector SPDR Trust - The Financial Select Sector SPDR Fund | 0,00 | -100,00 | 0,00 | -100,00 | -2,4618 | ||||
| MA / Mastercard Incorporated | 0,00 | -100,00 | 0,00 | -100,00 | 0,0000 | 0,0000 | |||
| SWN / Southwestern Energy Company | 0,00 | -100,00 | 0,00 | -100,00 | 0,0000 | ||||
| EQIX / Equinix, Inc. | 0,00 | -100,00 | 0,00 | -100,00 | 0,0000 | 0,0000 | |||
| COST / Costco Wholesale Corporation | 0,00 | -100,00 | 0,00 | -100,00 | -1,9392 | ||||
| TSCO / Tractor Supply Company | 0,00 | -100,00 | 0,00 | -100,00 | -1,3642 | ||||
| TDG / TransDigm Group Incorporated | 0,00 | -100,00 | 0,00 | -100,00 | 0,0000 | ||||
| 00B65Z9D7 / Noble Corporation plc | 0,00 | -100,00 | 0,00 | -100,00 | 0,0000 | ||||
| CSCO / Cisco Systems, Inc. | Call | 0,00 | -100,00 | 0,00 | -100,00 | 0,0000 | |||
| V / Visa Inc. | 0,00 | -100,00 | 0,00 | -100,00 | 0,0000 | 0,0000 | |||
| WMB / The Williams Companies, Inc. | 0,00 | -100,00 | 0,00 | -100,00 | 0,0000 | ||||
| WMB / The Williams Companies, Inc. | Call | 0,00 | -100,00 | 0,00 | -100,00 | 0,0000 | |||
| CSCO / Cisco Systems, Inc. | 0,00 | -100,00 | 0,00 | -100,00 | 0,0000 | ||||
| PLCMP0000017 / Comp SA | 0,00 | -100,00 | 0,00 | -100,00 | -0,3220 | ||||
| AMT / American Tower Corporation | 0,00 | -100,00 | 0,00 | -100,00 | 0,0000 | ||||
| PLCMP0000017 / Comp SA | Call | 0,00 | -100,00 | 0,00 | -100,00 | -2,0120 | |||
| SHW / The Sherwin-Williams Company | Call | 0,00 | -100,00 | 0,00 | -100,00 | 0,0000 | 0,0000 | ||
| LOW / Lowe's Companies, Inc. | Call | 0,00 | -100,00 | 0,00 | -100,00 | 0,0000 | 0,0000 | ||
| LOW / Lowe's Companies, Inc. | 0,00 | -100,00 | 0,00 | -100,00 | 0,0000 | 0,0000 | |||
| AAPL / Apple Inc. | 0,00 | -100,00 | 0,00 | -100,00 | 0,0000 | 0,0000 | |||
| EEM / iShares, Inc. - iShares MSCI Emerging Markets ETF | Call | 0,00 | -100,00 | 0,00 | -100,00 | -2,1002 | |||
| AEO / American Eagle Outfitters, Inc. | 0,00 | -100,00 | 0,00 | -100,00 | 0,0000 | 0,0000 |