Statistiques de base
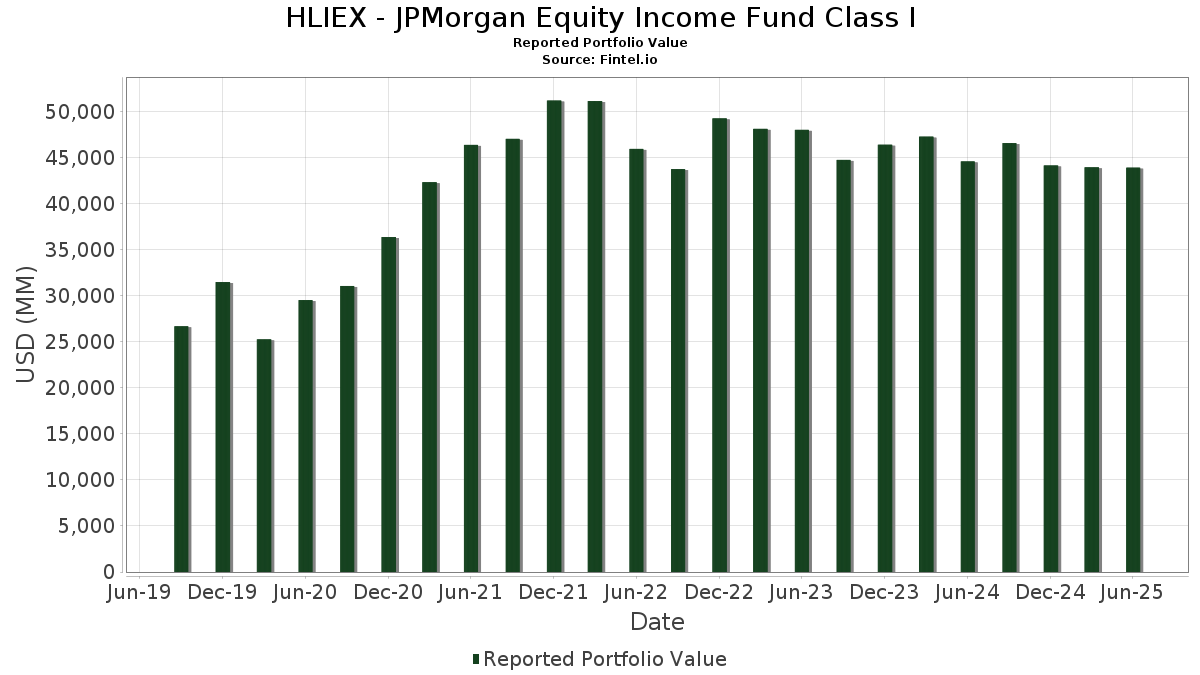
| Valeur du portefeuille | $ 43 885 891 899 |
| Positions actuelles | 85 |
Dernières positions, performances, ASG (à partir des dépôts 13F, 13D)
HLIEX - JPMorgan Equity Income Fund Class I a déclaré un total de 85 positions dans ses derniers dépôts auprès de la SEC. La valeur la plus récente du portefeuille est calculée à 43 885 891 899 USD. Les actifs sous gestion réels (ASG) sont cette valeur plus les liquidités (qui ne sont pas divulguées). Les principales positions de HLIEX - JPMorgan Equity Income Fund Class I sont Wells Fargo & Company (US:WFC) , Bank of America Corporation (US:BAC) , The Charles Schwab Corporation (US:SCHW) , Philip Morris International Inc. (US:PM) , and Microsoft Corporation (US:MSFT) . Les nouvelles positions de HLIEX - JPMorgan Equity Income Fund Class I incluent American Tower Corporation (US:AMT) , .
Meilleures augmentations ce trimestre
Nous utilisons la variation de l'allocation du portefeuille car il s'agit de l'indicateur le plus significatif. Les changements peuvent être dus à des transactions ou à des variations de prix des actions.
| Titre | Actions (en millions) |
Valeur ($ en millions) |
% du portefeuille | ΔPortefeuille % |
|---|---|---|---|---|
| 5,59 | 455,00 | 1,0363 | 0,8393 | |
| 3,25 | 494,77 | 1,1269 | 0,8331 | |
| 2,64 | 941,56 | 2,1445 | 0,6133 | |
| 1,92 | 954,57 | 2,1742 | 0,5349 | |
| 0,96 | 212,65 | 0,4843 | 0,4843 | |
| 3,77 | 543,45 | 1,2378 | 0,4617 | |
| 21,63 | 1 732,94 | 3,9470 | 0,4136 | |
| 28,63 | 1 354,97 | 3,0861 | 0,3671 | |
| 2,42 | 527,99 | 1,2026 | 0,3589 | |
| 11,97 | 1 092,37 | 2,4880 | 0,3091 |
Principales baisses ce trimestre
Nous utilisons la variation de l'allocation du portefeuille car il s'agit de l'indicateur le plus significatif. Les changements peuvent être dus à des transactions ou à des variations de prix des actions.
| Titre | Actions (en millions) |
Valeur ($ en millions) |
% du portefeuille | ΔPortefeuille % |
|---|---|---|---|---|
| 2,40 | 750,06 | 1,7084 | -1,1571 | |
| 2,77 | 514,60 | 1,1721 | -0,8101 | |
| 11,49 | 531,76 | 1,2112 | -0,6908 | |
| 5,19 | 743,20 | 1,6928 | -0,6219 | |
| 1,26 | 110,02 | 0,2506 | -0,5267 | |
| 0,86 | 199,37 | 0,4541 | -0,3570 | |
| 3,04 | 328,20 | 0,7475 | -0,3402 | |
| 9,51 | 853,20 | 1,9433 | -0,3288 | |
| 1,82 | 313,90 | 0,7150 | -0,1836 | |
| 2,99 | 447,61 | 1,0195 | -0,1451 |
Déclarations 13F et dépôts de fonds
Ce formulaire a été déposé le 2025-08-26 pour la période de déclaration 2025-06-30. Cliquez sur l'icône du lien pour voir l'historique complet des transactions.
Mettre à niveau pour débloquer les données premium et exporter vers Excel ![]() .
.
| Titre | Type | Prix moyen de l'action | Actions (en millions) |
ΔActions (%) |
ΔActions (%) |
Valeur ($ en millions) |
Portefeuille (%) |
ΔPortefeuille (%) |
|
|---|---|---|---|---|---|---|---|---|---|
| WFC / Wells Fargo & Company | 21,63 | 0,00 | 1 732,94 | 11,60 | 3,9470 | 0,4136 | |||
| BAC / Bank of America Corporation | 28,63 | 0,00 | 1 354,97 | 13,40 | 3,0861 | 0,3671 | |||
| SCHW / The Charles Schwab Corporation | 11,97 | -2,12 | 1 092,37 | 14,08 | 2,4880 | 0,3091 | |||
| PM / Philip Morris International Inc. | 5,96 | -4,03 | 1 084,83 | 10,11 | 2,4709 | 0,2290 | |||
| MSFT / Microsoft Corporation | 1,92 | 0,00 | 954,57 | 32,50 | 2,1742 | 0,5349 | |||
| ETN / Eaton Corporation plc | 2,64 | 6,55 | 941,56 | 39,93 | 2,1445 | 0,6133 | |||
| AXP / American Express Company | 2,81 | -5,02 | 895,54 | 12,61 | 2,0397 | 0,2300 | |||
| APD / Air Products and Chemicals, Inc. | 3,03 | 5,53 | 855,92 | 0,92 | 1,9495 | 0,0196 | |||
| COP / ConocoPhillips | 9,51 | 0,00 | 853,20 | -14,55 | 1,9433 | -0,3288 | |||
| DE / Deere & Company | 1,67 | -2,46 | 851,28 | 5,67 | 1,9389 | 0,1057 | |||
| COF / Capital One Financial Corporation | 3,88 | -2,60 | 825,77 | 15,57 | 1,8808 | 0,2549 | |||
| NSC / Norfolk Southern Corporation | 3,17 | 0,00 | 811,57 | 8,07 | 1,8485 | 0,1396 | |||
| GD / General Dynamics Corporation | 2,57 | -5,20 | 751,02 | 1,44 | 1,7106 | 0,0258 | |||
| UNH / UnitedHealth Group Incorporated | 2,40 | 0,00 | 750,06 | -40,44 | 1,7084 | -1,1571 | |||
| CVX / Chevron Corporation | 5,19 | -14,64 | 743,20 | -26,94 | 1,6928 | -0,6219 | |||
| MS / Morgan Stanley | 5,19 | -14,65 | 731,46 | 3,04 | 1,6660 | 0,0507 | |||
| LOW / Lowe's Companies, Inc. | 3,27 | 0,00 | 726,04 | -4,87 | 1,6537 | -0,0831 | |||
| MCD / McDonald's Corporation | 2,46 | 0,00 | 717,96 | -6,47 | 1,6353 | -0,1115 | |||
| CMCSA / Comcast Corporation | 19,79 | 0,00 | 706,43 | -3,28 | 1,6090 | -0,0530 | |||
| TXN / Texas Instruments Incorporated | 3,31 | 3,94 | 686,29 | 20,09 | 1,5631 | 0,2626 | |||
| JNJ / Johnson & Johnson | 4,46 | 0,00 | 681,69 | -7,89 | 1,5527 | -0,1315 | |||
| RTX / RTX Corporation | 4,66 | -16,34 | 680,20 | -7,78 | 1,5493 | -0,1291 | |||
| ADI / Analog Devices, Inc. | 2,85 | -14,02 | 677,20 | 1,48 | 1,5424 | 0,0238 | |||
| UNP / Union Pacific Corporation | 2,84 | 7,37 | 654,39 | 4,57 | 1,4905 | 0,0665 | |||
| GS / The Goldman Sachs Group, Inc. | 0,91 | -4,83 | 647,25 | 23,29 | 1,4742 | 0,2796 | |||
| DOV / Dover Corporation | 3,51 | -3,37 | 643,95 | 0,79 | 1,4667 | 0,0128 | |||
| HD / The Home Depot, Inc. | 1,74 | 0,00 | 639,29 | 0,04 | 1,4561 | 0,0019 | |||
| CVS / CVS Health Corporation | 9,06 | -5,92 | 625,10 | -4,21 | 1,4238 | -0,0612 | |||
| PG / The Procter & Gamble Company | 3,91 | 0,00 | 623,63 | -6,51 | 1,4204 | -0,0976 | |||
| ABT / Abbott Laboratories | 4,50 | -3,64 | 612,60 | -1,20 | 1,3953 | -0,0157 | |||
| BK / The Bank of New York Mellon Corporation | 6,64 | 0,00 | 604,76 | 8,63 | 1,3774 | 0,1106 | |||
| EOG / EOG Resources, Inc. | 5,04 | 8,50 | 603,36 | 1,20 | 1,3742 | 0,0175 | |||
| TJX / The TJX Companies, Inc. | 4,58 | -3,28 | 565,09 | -1,93 | 1,2871 | -0,0242 | |||
| WMT / Walmart Inc. | 5,70 | 0,00 | 557,55 | 11,38 | 1,2699 | 0,1308 | |||
| STX / Seagate Technology Holdings plc | 3,77 | -6,22 | 543,45 | 59,34 | 1,2378 | 0,4617 | |||
| BMY / Bristol-Myers Squibb Company | 11,49 | -16,17 | 531,76 | -36,38 | 1,2112 | -0,6908 | |||
| NXPI / NXP Semiconductors N.V. | 2,42 | 23,87 | 527,99 | 42,40 | 1,2026 | 0,3589 | |||
| CI / The Cigna Group | 1,58 | 0,00 | 522,11 | 0,48 | 1,1892 | 0,0068 | |||
| ABBV / AbbVie Inc. | 2,77 | -33,32 | 514,60 | -40,92 | 1,1721 | -0,8101 | |||
| PNC / The PNC Financial Services Group, Inc. | 2,75 | -14,75 | 513,37 | -9,59 | 1,1693 | -0,1228 | |||
| D / Dominion Energy, Inc. | 9,00 | 0,00 | 508,67 | 0,80 | 1,1586 | 0,0103 | |||
| AJG / Arthur J. Gallagher & Co. | 1,57 | -3,92 | 502,70 | -10,91 | 1,1450 | -0,1390 | |||
| MMM / 3M Company | 3,25 | 269,61 | 494,77 | 283,15 | 1,1269 | 0,8331 | |||
| PH / Parker-Hannifin Corporation | 0,71 | 0,00 | 494,23 | 14,91 | 1,1257 | 0,1469 | |||
| PGR / The Progressive Corporation | 1,84 | 4,65 | 492,15 | -1,32 | 1,1209 | -0,0140 | |||
| ARES / Ares Management Corporation | 2,80 | -8,28 | 484,47 | 8,36 | 1,1034 | 0,0860 | |||
| KO / The Coca-Cola Company | 6,80 | 0,00 | 481,44 | -1,21 | 1,0966 | -0,0125 | |||
| FIS / Fidelity National Information Services, Inc. | 5,59 | 389,46 | 455,00 | 427,28 | 1,0363 | 0,8393 | |||
| NEE / NextEra Energy, Inc. | 6,49 | -4,42 | 450,76 | -6,40 | 1,0267 | -0,0692 | |||
| BX / Blackstone Inc. | 2,99 | -18,27 | 447,61 | -12,54 | 1,0195 | -0,1451 | |||
| HPE / Hewlett Packard Enterprise Company | 19,86 | 4,17 | 406,15 | 38,07 | 0,9251 | 0,2557 | |||
| XEL / Xcel Energy Inc. | 5,79 | 0,00 | 394,12 | -3,80 | 0,8977 | -0,0346 | |||
| GLW / Corning Incorporated | 7,31 | 20,56 | 384,40 | 38,49 | 0,8755 | 0,2439 | |||
| MRK / Merck & Co., Inc. | 4,72 | 51,75 | 373,79 | 33,83 | 0,8514 | 0,2158 | |||
| MDLZ / Mondelez International, Inc. | 5,39 | 0,00 | 363,64 | -0,60 | 0,8282 | -0,0043 | |||
| VTR / Ventas, Inc. | 5,66 | 0,00 | 357,24 | -8,16 | 0,8137 | -0,0715 | |||
| XOM / Exxon Mobil Corporation | 3,04 | -24,25 | 328,20 | -31,34 | 0,7475 | -0,3402 | |||
| VZ / Verizon Communications Inc. | 7,58 | 6,21 | 328,08 | 1,31 | 0,7473 | 0,0104 | |||
| BLK / BlackRock, Inc. | 0,31 | -11,86 | 325,06 | -2,29 | 0,7404 | -0,0167 | |||
| BDX / Becton, Dickinson and Company | 1,82 | 5,71 | 313,90 | -20,51 | 0,7150 | -0,1836 | |||
| CMS / CMS Energy Corporation | 4,49 | 0,00 | 311,20 | -7,76 | 0,7088 | -0,0589 | |||
| PLD / Prologis, Inc. | 2,88 | 0,00 | 303,24 | -5,97 | 0,6907 | -0,0432 | |||
| COR / Cencora, Inc. | 1,00 | 0,00 | 299,88 | 7,82 | 0,6830 | 0,0501 | |||
| PEP / PepsiCo, Inc. | 2,26 | 0,00 | 298,68 | -11,94 | 0,6803 | -0,0915 | |||
| CB / Chubb Limited | 1,00 | 0,00 | 288,64 | -4,06 | 0,6574 | -0,0272 | |||
| YUM / Yum! Brands, Inc. | 1,87 | 0,00 | 276,81 | -5,83 | 0,6305 | -0,0384 | |||
| PEG / Public Service Enterprise Group Incorporated | 3,10 | -14,98 | 260,68 | -13,04 | 0,5937 | -0,0884 | |||
| TRV / The Travelers Companies, Inc. | 0,97 | 0,00 | 258,95 | 1,16 | 0,5898 | 0,0073 | |||
| CME / CME Group Inc. | 0,94 | 0,00 | 258,04 | 3,89 | 0,5877 | 0,0225 | |||
| LLY / Eli Lilly and Company | 0,32 | 33,26 | 246,11 | 25,78 | 0,5606 | 0,1153 | |||
| DLR / Digital Realty Trust, Inc. | 1,37 | 22,72 | 238,53 | 49,30 | 0,5433 | 0,1797 | |||
| DGX / Quest Diagnostics Incorporated | 1,29 | 0,00 | 232,21 | 6,16 | 0,5289 | 0,0312 | |||
| IBM / International Business Machines Corporation | 0,74 | -10,94 | 219,59 | 5,58 | 0,5002 | 0,0268 | |||
| AMT / American Tower Corporation | 0,96 | 212,65 | 0,4843 | 0,4843 | |||||
| PKG / Packaging Corporation of America | 1,12 | 65,18 | 210,46 | 57,20 | 0,4794 | 0,1747 | |||
| AVB / AvalonBay Communities, Inc. | 0,99 | 0,00 | 201,71 | -5,18 | 0,4594 | -0,0247 | |||
| NKE / NIKE, Inc. | 2,84 | 15,28 | 201,70 | 29,01 | 0,4594 | 0,1036 | |||
| HON / Honeywell International Inc. | 0,86 | -49,14 | 199,37 | -44,07 | 0,4541 | -0,3570 | |||
| HSY / The Hershey Company | 1,18 | 0,00 | 196,19 | -2,97 | 0,4468 | -0,0133 | |||
| LRCX / Lam Research Corporation | 1,94 | 27,17 | 188,79 | 70,27 | 0,4300 | 0,1777 | |||
| RSG / Republic Services, Inc. | 0,73 | -10,13 | 178,94 | -8,48 | 0,4076 | -0,0374 | |||
| MMC / Marsh & McLennan Companies, Inc. | 0,54 | -15,79 | 118,87 | -24,55 | 0,2708 | -0,0878 | |||
| MDT / Medtronic plc | 1,26 | -66,80 | 110,02 | -67,79 | 0,2506 | -0,5267 | |||
| JIMXX / JPMorgan Trust I. - JPMorgan Prime Money Market Fund IM | 76,33 | 38,74 | 76,34 | 38,73 | 0,1739 | 0,0487 | |||
| AAPL / Apple Inc. | 0,37 | 0,00 | 75,57 | -7,63 | 0,1721 | -0,0141 |