Statistiques de base
| Valeur du portefeuille | $ 23 084 629 322 |
| Positions actuelles | 104 |
Dernières positions, performances, ASG (à partir des dépôts 13F, 13D)
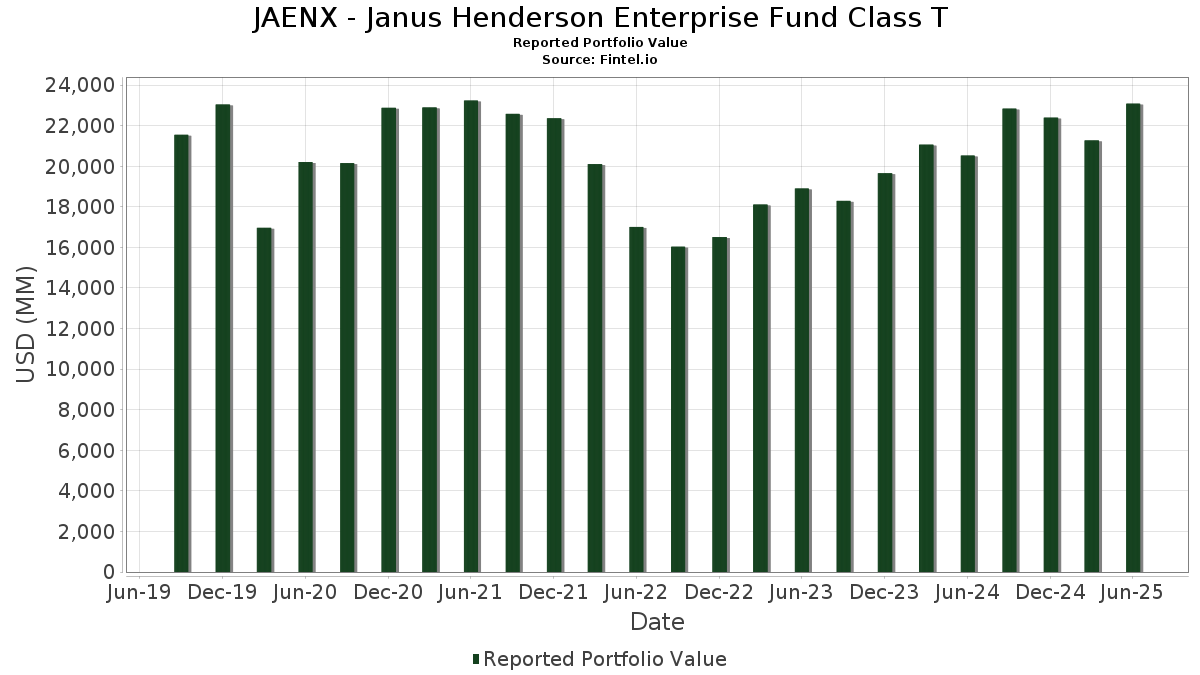
JAENX - Janus Henderson Enterprise Fund Class T a déclaré un total de 104 positions dans ses derniers dépôts auprès de la SEC. La valeur la plus récente du portefeuille est calculée à 23 084 629 322 USD. Les actifs sous gestion réels (ASG) sont cette valeur plus les liquidités (qui ne sont pas divulguées). Les principales positions de JAENX - Janus Henderson Enterprise Fund Class T sont Constellation Software Inc. (US:CNSWF) , SS&C Technologies Holdings, Inc. (US:SSNC) , Intact Financial Corporation (CA:IFC) , Flex Ltd. (US:FLEX) , and Ferguson Enterprises Inc. (US:FERG) . Les nouvelles positions de JAENX - Janus Henderson Enterprise Fund Class T incluent Ralliant Corporation (US:RAL) , Chime Financial, Inc. (US:CHYM) , .
Meilleures augmentations ce trimestre
Nous utilisons la variation de l'allocation du portefeuille car il s'agit de l'indicateur le plus significatif. Les changements peuvent être dus à des transactions ou à des variations de prix des actions.
| Titre | Actions (en millions) |
Valeur ($ en millions) |
% du portefeuille | ΔPortefeuille % |
|---|---|---|---|---|
| 801,16 | 801,32 | 3,4736 | 3,4736 | |
| 15,42 | 769,97 | 3,3377 | 0,9397 | |
| 2,83 | 615,23 | 2,6670 | 0,6723 | |
| 1,93 | 331,84 | 1,4385 | 0,4853 | |
| 1,70 | 593,83 | 2,5742 | 0,4617 | |
| 6,39 | 153,35 | 0,6648 | 0,4022 | |
| 6,72 | 343,16 | 1,4876 | 0,3674 | |
| 1,66 | 80,47 | 0,3488 | 0,3488 | |
| 4,32 | 359,15 | 1,5569 | 0,3481 | |
| 10,08 | 422,09 | 1,8297 | 0,3436 |
Principales baisses ce trimestre
Nous utilisons la variation de l'allocation du portefeuille car il s'agit de l'indicateur le plus significatif. Les changements peuvent être dus à des transactions ou à des variations de prix des actions.
| Titre | Actions (en millions) |
Valeur ($ en millions) |
% du portefeuille | ΔPortefeuille % |
|---|---|---|---|---|
| 2,69 | 484,79 | 2,1015 | -1,0738 | |
| 4,98 | 259,52 | 1,1250 | -0,9404 | |
| 5,63 | 605,19 | 2,6234 | -0,7483 | |
| 7,10 | 95,51 | 0,4140 | -0,5347 | |
| 0,64 | 196,49 | 0,8518 | -0,4674 | |
| 4,33 | 395,30 | 1,7136 | -0,4364 | |
| 2,89 | 341,57 | 1,4807 | -0,3937 | |
| 9,77 | 809,04 | 3,5071 | -0,3289 | |
| 2,88 | 234,88 | 1,0182 | -0,3236 | |
| 16,47 | 79,58 | 0,3450 | -0,3198 |
Déclarations 13F et dépôts de fonds
Ce formulaire a été déposé le 2025-08-29 pour la période de déclaration 2025-06-30. Cliquez sur l'icône du lien pour voir l'historique complet des transactions.
Mettre à niveau pour débloquer les données premium et exporter vers Excel ![]() .
.
| Titre | Type | Prix moyen de l'action | Actions (en millions) |
ΔActions (%) |
ΔActions (%) |
Valeur ($ en millions) |
Portefeuille (%) |
ΔPortefeuille (%) |
|
|---|---|---|---|---|---|---|---|---|---|
| CNSWF / Constellation Software Inc. | 0,31 | -1,89 | 1 144,91 | 13,60 | 4,9631 | 0,2261 | |||
| SSNC / SS&C Technologies Holdings, Inc. | 9,77 | 0,00 | 809,04 | -0,87 | 3,5071 | -0,3289 | |||
| Janus Henderson Cash Liquidity Fund LLC / EC (N/A) | 801,16 | 801,32 | 3,4736 | 3,4736 | |||||
| IFC / Intact Financial Corporation | 3,42 | 0,00 | 794,70 | 13,81 | 3,4449 | 0,1632 | |||
| FLEX / Flex Ltd. | 15,42 | 0,00 | 769,97 | 50,91 | 3,3377 | 0,9397 | |||
| FERG / Ferguson Enterprises Inc. | 2,83 | 6,67 | 615,23 | 44,97 | 2,6670 | 0,6723 | |||
| BSX / Boston Scientific Corporation | 5,63 | -20,77 | 605,19 | -15,64 | 2,6234 | -0,7483 | |||
| APP / AppLovin Corporation | 1,70 | 0,00 | 593,83 | 32,12 | 2,5742 | 0,4617 | |||
| LPLA / LPL Financial Holdings Inc. | 1,52 | 0,00 | 570,78 | 14,62 | 2,4743 | 0,1338 | |||
| RVTY / Revvity, Inc. | 5,38 | 19,97 | 520,33 | 9,68 | 2,2556 | 0,0258 | |||
| FWONK / Formula One Group | 4,95 | -8,39 | 517,34 | 6,36 | 2,2426 | -0,0435 | |||
| TDY / Teledyne Technologies Incorporated | 1,00 | 0,00 | 513,00 | 2,93 | 2,2238 | -0,1186 | |||
| GDDY / GoDaddy Inc. | 2,69 | -28,21 | 484,79 | -28,24 | 2,1015 | -1,0738 | |||
| WRB / W. R. Berkley Corporation | 6,05 | -6,55 | 444,54 | -3,51 | 1,9270 | -0,2384 | |||
| LNT / Alliant Energy Corporation | 7,23 | 0,00 | 437,03 | -6,03 | 1,8945 | -0,2913 | |||
| BR / Broadridge Financial Solutions, Inc. | 1,78 | 0,00 | 433,75 | 0,24 | 1,8803 | -0,1536 | |||
| ARMK / Aramark | 10,08 | 10,06 | 422,09 | 33,49 | 1,8297 | 0,3436 | |||
| DOX / Amdocs Limited | 4,33 | -13,34 | 395,30 | -13,58 | 1,7136 | -0,4364 | |||
| NXPI / NXP Semiconductors N.V. | 1,80 | 0,00 | 393,31 | 14,96 | 1,7050 | 0,0969 | |||
| ON / ON Semiconductor Corporation | 7,40 | 0,00 | 387,66 | 28,80 | 1,6805 | 0,2659 | |||
| JBHT / J.B. Hunt Transport Services, Inc. | 2,58 | 0,00 | 370,44 | -2,94 | 1,6058 | -0,1880 | |||
| WEX / WEX Inc. | 2,50 | 0,00 | 367,09 | -6,45 | 1,5913 | -0,2530 | |||
| CTVA / Corteva, Inc. | 4,88 | 0,00 | 363,77 | 18,43 | 1,5769 | 0,1333 | |||
| IR / Ingersoll Rand Inc. | 4,32 | 34,36 | 359,15 | 39,65 | 1,5569 | 0,3481 | |||
| APG / APi Group Corporation | 6,72 | 0,86 | 343,16 | 43,99 | 1,4876 | 0,3674 | |||
| TFX / Teleflex Incorporated | 2,89 | 0,00 | 341,57 | -14,35 | 1,4807 | -0,3937 | |||
| AEE / Ameren Corporation | 3,51 | 0,00 | 337,33 | -4,34 | 1,4623 | -0,1951 | |||
| DASH / DoorDash, Inc. | 1,35 | -7,78 | 333,75 | 24,39 | 1,4468 | 0,1857 | |||
| PTC / PTC Inc. | 1,93 | 47,10 | 331,84 | 63,61 | 1,4385 | 0,4853 | |||
| DAY / Dayforce Inc. | 5,79 | 34,77 | 320,92 | 27,97 | 1,3911 | 0,2125 | |||
| CLH / Clean Harbors, Inc. | 1,30 | 0,00 | 300,66 | 17,29 | 1,3033 | 0,0985 | |||
| DTE / DTE Energy Company | 2,07 | 0,00 | 273,90 | -4,20 | 1,1873 | -0,1565 | |||
| RBA / RB Global, Inc. | 2,54 | 0,00 | 270,17 | 5,87 | 1,1712 | -0,0282 | |||
| LAMR / Lamar Advertising Company | 2,19 | 11,09 | 265,86 | 18,49 | 1,1525 | 0,0979 | |||
| FTV / Fortive Corporation | 4,98 | -17,10 | 259,52 | -40,94 | 1,1250 | -0,9404 | |||
| GIL / Gildan Activewear Inc. | 5,10 | 0,00 | 251,26 | 11,35 | 1,0892 | 0,0287 | |||
| CDW / CDW Corporation | 1,37 | 5,08 | 244,40 | 17,10 | 1,0595 | 0,0785 | |||
| CSGP / CoStar Group, Inc. | 2,99 | 1 310,49 | 240,39 | 37,98 | 1,0421 | 0,2811 | |||
| OKE / ONEOK, Inc. | 2,88 | 0,00 | 234,88 | -17,73 | 1,0182 | -0,3236 | |||
| KMX / CarMax, Inc. | 3,48 | 0,00 | 234,23 | -13,74 | 1,0153 | -0,2609 | |||
| WAT / Waters Corporation | 0,67 | 0,00 | 232,62 | -5,30 | 1,0084 | -0,1461 | |||
| KLAC / KLA Corporation | 0,24 | -9,45 | 218,76 | 19,31 | 0,9483 | 0,0866 | |||
| ST / Sensata Technologies Holding plc | 6,98 | 0,00 | 210,08 | 24,06 | 0,9107 | 0,1148 | |||
| SCHW / The Charles Schwab Corporation | 2,19 | -10,35 | 199,43 | 4,50 | 0,8645 | -0,0325 | |||
| RYAAY / Ryanair Holdings plc - Depositary Receipt (Common Stock) | 3,44 | 0,00 | 198,45 | 36,11 | 0,8602 | 0,1750 | |||
| WTW / Willis Towers Watson Public Limited Company | 0,64 | -22,81 | 196,49 | -29,99 | 0,8518 | -0,4674 | |||
| TRU / TransUnion | 2,09 | 0,00 | 183,56 | 6,04 | 0,7957 | -0,0179 | |||
| STE / STERIS plc | 0,74 | 0,00 | 177,57 | 5,99 | 0,7697 | -0,0177 | |||
| VLTO / Veralto Corporation | 1,74 | 0,00 | 176,08 | 3,59 | 0,7633 | -0,0356 | |||
| ARGX / argenx SE - Depositary Receipt (Common Stock) | 0,31 | 9,65 | 172,03 | 2,12 | 0,7457 | -0,0460 | |||
| TFII / TFI International Inc. | 1,89 | 0,00 | 169,42 | 15,78 | 0,7344 | 0,0467 | |||
| ASND / Ascendis Pharma A/S - Depositary Receipt (Common Stock) | 0,98 | 0,00 | 168,61 | 10,74 | 0,7309 | 0,0153 | |||
| ICUI / ICU Medical, Inc. | 1,23 | 0,00 | 162,64 | -4,83 | 0,7050 | -0,0982 | |||
| RTO / Rentokil Initial plc - Depositary Receipt (Common Stock) | 6,39 | -48,32 | 153,35 | 174,50 | 0,6648 | 0,4022 | |||
| CBOE / Cboe Global Markets, Inc. | 0,64 | 0,00 | 148,86 | 3,06 | 0,6453 | -0,0336 | |||
| DLTR / Dollar Tree, Inc. | 1,40 | 0,00 | 138,95 | 31,93 | 0,6023 | 0,1073 | |||
| 6GI / Entain Plc | 11,13 | -4,69 | 137,69 | 56,45 | 0,5968 | 0,1832 | |||
| DT / Dynatrace, Inc. | 2,46 | 0,00 | 135,67 | 17,09 | 0,5881 | 0,0436 | |||
| TEL / TE Connectivity plc | 0,80 | -7,19 | 135,19 | 10,78 | 0,5860 | 0,0125 | |||
| BURL / Burlington Stores, Inc. | 0,55 | 0,00 | 127,20 | -2,39 | 0,5514 | -0,0611 | |||
| TOITF / Topicus.com Inc. | 1,00 | 0,00 | 125,47 | 27,70 | 0,5439 | 0,0821 | |||
| ILMN / Illumina, Inc. | 1,26 | 0,00 | 120,69 | 20,25 | 0,5232 | 0,0515 | |||
| COO / The Cooper Companies, Inc. | 1,68 | 0,00 | 119,48 | -15,64 | 0,5179 | -0,1477 | |||
| GPN / Global Payments Inc. | 1,49 | -8,87 | 119,37 | -25,51 | 0,5175 | -0,2357 | |||
| SARO / StandardAero, Inc. | 3,56 | 0,00 | 112,83 | 18,81 | 0,4891 | 0,0427 | |||
| W / Wayfair Inc. | 2,17 | 0,00 | 111,16 | 59,66 | 0,4818 | 0,1546 | |||
| CMPR / Cimpress plc | 2,36 | 0,00 | 110,70 | 3,91 | 0,4799 | -0,0208 | |||
| LINE / Lineage, Inc. | 2,41 | 8,30 | 105,08 | -19,61 | 0,4555 | -0,1588 | |||
| ULS / UL Solutions Inc. | 1,41 | 0,00 | 102,84 | 29,19 | 0,4458 | 0,0716 | |||
| GMED / Globus Medical, Inc. | 1,74 | 144,02 | 102,53 | 96,75 | 0,4445 | 0,1995 | |||
| AVTR / Avantor, Inc. | 7,10 | -43,02 | 95,51 | -52,68 | 0,4140 | -0,5347 | |||
| LNTH / Lantheus Holdings, Inc. | 1,13 | 9,79 | 92,74 | -7,92 | 0,4020 | -0,0713 | |||
| RVMD / Revolution Medicines, Inc. | 2,40 | 18,61 | 88,45 | 23,41 | 0,3834 | 0,0466 | |||
| PCVX / Vaxcyte, Inc. | 2,64 | 91,40 | 85,91 | 64,79 | 0,3724 | 0,1274 | |||
| RAL / Ralliant Corporation | 1,66 | 80,47 | 0,3488 | 0,3488 | |||||
| RTO / Rentokil Initial plc - Depositary Receipt (Common Stock) | 16,47 | 157,72 | 79,58 | -48,11 | 0,3450 | -0,3198 | |||
| FSV / FirstService Corporation | 0,44 | 61,43 | 76,10 | 69,87 | 0,3299 | 0,1193 | |||
| FWONA / Formula One Group | 0,73 | 0,00 | 69,47 | 16,56 | 0,3012 | 0,0210 | |||
| RYAOF / Ryanair Holdings plc | 2,03 | 0,00 | 57,48 | 40,92 | 0,2492 | 0,0575 | |||
| ZD / Ziff Davis, Inc. | 1,58 | 0,00 | 47,87 | -19,45 | 0,2075 | -0,0718 | |||
| Janus Henderson Cash Collateral Fund / EC (N/A) | 17,39 | 17,39 | 0,0754 | 0,0754 | |||||
| CHYM / Chime Financial, Inc. | 0,41 | 14,31 | 0,0620 | 0,0620 | |||||
| Receive Performance on Equity.RYANAIR HOLDINGS_IE_ / DE (N/A) | 7,78 | 0,0337 | 0,0337 | ||||||
| Receive Performance on Equity.RYANAIR HOLDINGS_IE_ / DE (N/A) | 7,78 | 0,0337 | 0,0337 | ||||||
| Royal Bank of Canada / STIV (N/A) | 4,35 | 0,0189 | 0,0189 | ||||||
| Sell USD / Buy EUR / DFE (N/A) | 1,87 | 0,0081 | 0,0081 | ||||||
| Sell USD / Buy EUR / DFE (N/A) | 1,87 | 0,0081 | 0,0081 | ||||||
| Sell USD / Buy CAD / DFE (N/A) | 0,13 | 0,0005 | 0,0005 | ||||||
| Sell CAD / Buy USD / DFE (N/A) | -0,07 | -0,0003 | -0,0003 | ||||||
| Sell CAD / Buy USD / DFE (N/A) | -0,10 | -0,0004 | -0,0004 | ||||||
| Sell CAD / Buy USD / DFE (N/A) | -0,13 | -0,0005 | -0,0005 | ||||||
| Sell CAD / Buy USD / DFE (N/A) | -0,21 | -0,0009 | -0,0009 | ||||||
| Sell CAD / Buy USD / DFE (N/A) | -0,21 | -0,0009 | -0,0009 | ||||||
| Sell CAD / Buy USD / DFE (N/A) | -0,29 | -0,0013 | -0,0013 | ||||||
| Sell CAD / Buy USD / DFE (N/A) | -0,48 | -0,0021 | -0,0021 | ||||||
| Sell EUR / Buy USD / DFE (N/A) | -0,53 | -0,0023 | -0,0023 | ||||||
| Sell EUR / Buy USD / DFE (N/A) | -0,64 | -0,0028 | -0,0028 | ||||||
| Sell CAD / Buy USD / DFE (N/A) | -0,84 | -0,0036 | -0,0036 | ||||||
| Sell CAD / Buy USD / DFE (N/A) | -0,85 | -0,0037 | -0,0037 | ||||||
| Sell EUR / Buy USD / DFE (N/A) | -1,16 | -0,0050 | -0,0050 | ||||||
| Sell EUR / Buy USD / DFE (N/A) | -2,01 | -0,0087 | -0,0087 | ||||||
| Sell EUR / Buy USD / DFE (N/A) | -2,01 | -0,0087 | -0,0087 | ||||||
| Sell EUR / Buy USD / DFE (N/A) | -2,01 | -0,0087 | -0,0087 | ||||||
| Sell EUR / Buy USD / DFE (N/A) | -4,15 | -0,0180 | -0,0180 |