Statistiques de base
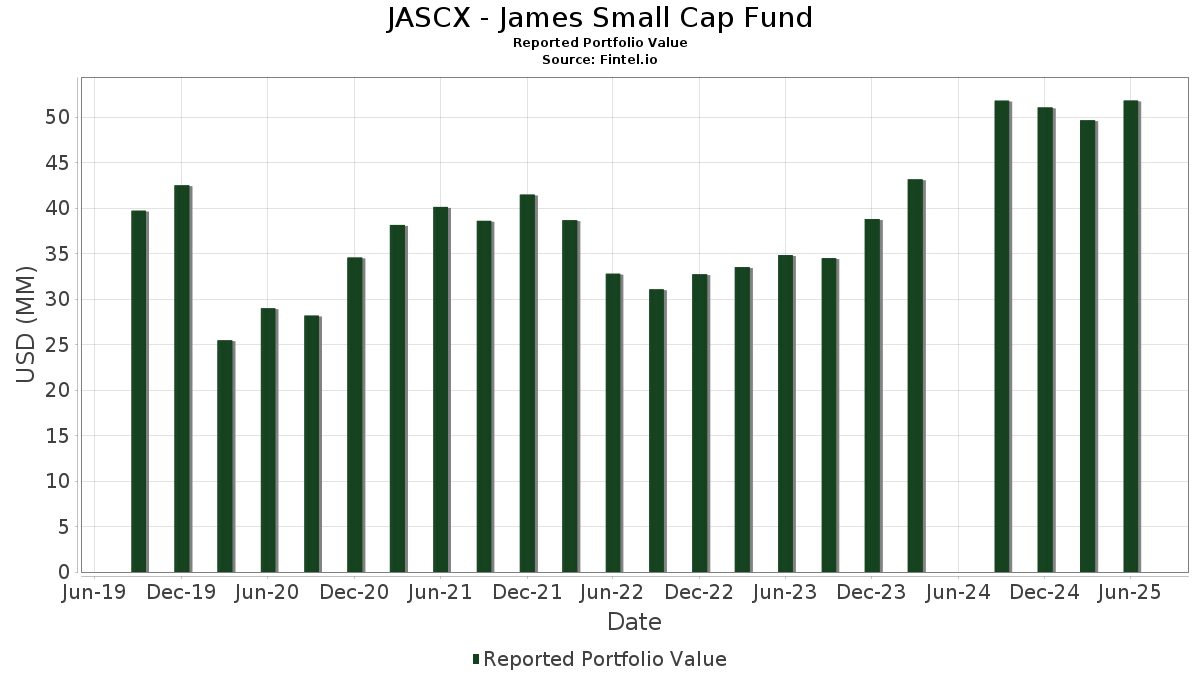
| Valeur du portefeuille | $ 51 823 442 |
| Positions actuelles | 87 |
Dernières positions, performances, ASG (à partir des dépôts 13F, 13D)
JASCX - James Small Cap Fund a déclaré un total de 87 positions dans ses derniers dépôts auprès de la SEC. La valeur la plus récente du portefeuille est calculée à 51 823 442 USD. Les actifs sous gestion réels (ASG) sont cette valeur plus les liquidités (qui ne sont pas divulguées). Les principales positions de JASCX - James Small Cap Fund sont Brinker International, Inc. (US:EAT) , Enova International, Inc. (US:ENVA) , First American Funds Inc - First American Treasury Obligations Fund Class X (US:FXFXX) , Evercore Inc. (US:EVR) , and Piper Sandler Companies (US:PIPR) . Les nouvelles positions de JASCX - James Small Cap Fund incluent First American Funds Inc - First American Treasury Obligations Fund Class X (US:FXFXX) , ACM Research, Inc. (US:ACMR) , InterDigital, Inc. (US:IDCC) , .
Meilleures augmentations ce trimestre
Nous utilisons la variation de l'allocation du portefeuille car il s'agit de l'indicateur le plus significatif. Les changements peuvent être dus à des transactions ou à des variations de prix des actions.
| Titre | Actions (en millions) |
Valeur ($ en millions) |
% du portefeuille | ΔPortefeuille % |
|---|---|---|---|---|
| 0,01 | 1,82 | 3,5122 | 0,8213 | |
| 0,02 | 0,41 | 0,8009 | 0,8009 | |
| 0,01 | 2,67 | 5,1550 | 0,7416 | |
| 0,00 | 0,38 | 0,7367 | 0,7367 | |
| 0,00 | 0,69 | 1,3284 | 0,6533 | |
| 0,00 | 0,83 | 1,5956 | 0,4886 | |
| 0,02 | 1,99 | 3,8430 | 0,3963 | |
| 0,01 | 0,76 | 1,4656 | 0,3690 | |
| 0,00 | 0,71 | 1,3652 | 0,3657 | |
| 0,01 | 1,69 | 3,2687 | 0,2518 |
Principales baisses ce trimestre
Nous utilisons la variation de l'allocation du portefeuille car il s'agit de l'indicateur le plus significatif. Les changements peuvent être dus à des transactions ou à des variations de prix des actions.
| Titre | Actions (en millions) |
Valeur ($ en millions) |
% du portefeuille | ΔPortefeuille % |
|---|---|---|---|---|
| 0,01 | 1,06 | 2,0466 | -1,2523 | |
| 1,95 | 3,7750 | -1,0706 | ||
| 0,01 | 1,24 | 2,3909 | -0,6036 | |
| 0,02 | 0,70 | 1,3596 | -0,3749 | |
| 0,06 | 0,55 | 1,0548 | -0,3737 | |
| 0,01 | 0,55 | 1,0652 | -0,2882 | |
| 0,02 | 0,32 | 0,6185 | -0,1708 | |
| 0,01 | 0,45 | 0,8615 | -0,1447 | |
| 0,01 | 0,44 | 0,8591 | -0,1436 | |
| 0,01 | 0,79 | 1,5186 | -0,1433 |
Déclarations 13F et dépôts de fonds
Ce formulaire a été déposé le 2025-08-29 pour la période de déclaration 2025-06-30. Cliquez sur l'icône du lien pour voir l'historique complet des transactions.
Mettre à niveau pour débloquer les données premium et exporter vers Excel ![]() .
.
| Titre | Type | Prix moyen de l'action | Actions (en millions) |
ΔActions (%) |
ΔActions (%) |
Valeur ($ en millions) |
Portefeuille (%) |
ΔPortefeuille (%) |
|
|---|---|---|---|---|---|---|---|---|---|
| EAT / Brinker International, Inc. | 0,01 | 0,00 | 2,67 | 21,01 | 5,1550 | 0,7416 | |||
| ENVA / Enova International, Inc. | 0,02 | 0,00 | 1,99 | 15,51 | 3,8430 | 0,3963 | |||
| FXFXX / First American Funds Inc - First American Treasury Obligations Fund Class X | 1,95 | -19,30 | 3,7750 | -1,0706 | |||||
| EVR / Evercore Inc. | 0,01 | 0,00 | 1,82 | 35,19 | 3,5122 | 0,8213 | |||
| PIPR / Piper Sandler Companies | 0,01 | 0,00 | 1,69 | 12,21 | 3,2687 | 0,2518 | |||
| COKE / Coca-Cola Consolidated, Inc. | 0,01 | 900,00 | 1,24 | -17,26 | 2,3909 | -0,6036 | |||
| CNXN / PC Connection, Inc. | 0,02 | 0,00 | 1,15 | 5,40 | 2,2248 | 0,0380 | |||
| HLI / Houlihan Lokey, Inc. | 0,01 | 0,00 | 1,13 | 11,41 | 2,1911 | 0,1542 | |||
| CORT / Corcept Therapeutics Incorporated | 0,01 | 0,00 | 1,06 | -35,76 | 2,0466 | -1,2523 | |||
| MTG / MGIC Investment Corporation | 0,04 | 0,00 | 1,06 | 12,35 | 2,0393 | 0,1591 | |||
| FBP / First BanCorp. | 0,05 | 0,00 | 0,99 | 8,63 | 1,9223 | 0,0898 | |||
| RDN / Radian Group Inc. | 0,03 | 0,00 | 0,97 | 8,92 | 1,8656 | 0,0914 | |||
| FCN / FTI Consulting, Inc. | 0,01 | 0,00 | 0,91 | -1,52 | 1,7511 | -0,0917 | |||
| AGO / Assured Guaranty Ltd. | 0,01 | 0,00 | 0,90 | -1,10 | 1,7339 | -0,0827 | |||
| INVA / Innoviva, Inc. | 0,04 | 0,00 | 0,89 | 10,76 | 1,7120 | 0,1117 | |||
| PATK / Patrick Industries, Inc. | 0,01 | 0,00 | 0,86 | 9,04 | 1,6558 | 0,0840 | |||
| NVMI / Nova Ltd. | 0,00 | 0,00 | 0,83 | 49,46 | 1,5956 | 0,4886 | |||
| ADC / Agree Realty Corporation | 0,01 | 0,00 | 0,79 | -5,42 | 1,5186 | -0,1433 | |||
| URBN / Urban Outfitters, Inc. | 0,01 | 0,00 | 0,76 | 38,57 | 1,4656 | 0,3690 | |||
| WINA / Winmark Corporation | 0,00 | 0,00 | 0,73 | 18,85 | 1,4020 | 0,1795 | |||
| WCC / WESCO International, Inc. | 0,00 | 0,00 | 0,71 | 19,36 | 1,3713 | 0,1802 | |||
| BOOT / Boot Barn Holdings, Inc. | 0,00 | 0,00 | 0,71 | 41,48 | 1,3652 | 0,3657 | |||
| NSA / National Storage Affiliates Trust | 0,02 | 0,00 | 0,70 | -18,82 | 1,3596 | -0,3749 | |||
| ITGR / Integer Holdings Corporation | 0,01 | 0,00 | 0,70 | 4,17 | 1,3537 | 0,0081 | |||
| STRL / Sterling Infrastructure, Inc. | 0,00 | 0,00 | 0,69 | 103,86 | 1,3284 | 0,6533 | |||
| PSMT / PriceSmart, Inc. | 0,01 | 0,00 | 0,67 | 19,64 | 1,2958 | 0,1732 | |||
| OTTR / Otter Tail Corporation | 0,01 | 0,00 | 0,64 | -4,07 | 1,2296 | -0,0982 | |||
| HCC / Warrior Met Coal, Inc. | 0,01 | 0,00 | 0,63 | -3,96 | 1,2210 | -0,0959 | |||
| R / Ryder System, Inc. | 0,00 | 0,00 | 0,62 | 10,61 | 1,1902 | 0,0751 | |||
| GNRC / Generac Holdings Inc. | 0,00 | 0,00 | 0,61 | 13,08 | 1,1868 | 0,0996 | |||
| WT / WisdomTree, Inc. | 0,05 | 0,00 | 0,56 | 29,10 | 1,0810 | 0,2132 | |||
| SUPN / Supernus Pharmaceuticals, Inc. | 0,02 | 0,00 | 0,55 | -3,83 | 1,0680 | -0,0814 | |||
| HALO / Halozyme Therapeutics, Inc. | 0,01 | 0,00 | 0,55 | -18,49 | 1,0652 | -0,2882 | |||
| DVAX / Dynavax Technologies Corporation | 0,06 | 0,00 | 0,55 | -23,56 | 1,0548 | -0,3737 | |||
| MTDR / Matador Resources Company | 0,01 | 0,00 | 0,53 | -6,65 | 1,0312 | -0,1124 | |||
| EZPW / EZCORP, Inc. | 0,04 | 0,00 | 0,53 | -5,84 | 1,0301 | -0,1015 | |||
| SSB / SouthState Corporation | 0,01 | 0,00 | 0,52 | -0,77 | 0,9996 | -0,0447 | |||
| NSIT / Insight Enterprises, Inc. | 0,00 | 0,00 | 0,50 | -7,96 | 0,9621 | -0,1204 | |||
| IDA / IDACORP, Inc. | 0,00 | 0,00 | 0,48 | -0,82 | 0,9334 | -0,0399 | |||
| AVA / Avista Corporation | 0,01 | 0,00 | 0,47 | -9,37 | 0,9172 | -0,1310 | |||
| ATGE / Adtalem Global Education Inc. | 0,00 | 0,00 | 0,47 | 26,27 | 0,9118 | 0,1647 | |||
| AX / Axos Financial, Inc. | 0,01 | 0,00 | 0,47 | 17,97 | 0,9012 | 0,1091 | |||
| TRNO / Terreno Realty Corporation | 0,01 | 0,00 | 0,45 | -11,35 | 0,8615 | -0,1447 | |||
| IOSP / Innospec Inc. | 0,01 | 0,00 | 0,44 | -11,20 | 0,8591 | -0,1436 | |||
| POWL / Powell Industries, Inc. | 0,00 | 0,00 | 0,44 | 23,40 | 0,8578 | 0,1387 | |||
| AVT / Avnet, Inc. | 0,01 | 0,00 | 0,44 | 10,35 | 0,8463 | 0,0521 | |||
| BCC / Boise Cascade Company | 0,00 | 0,00 | 0,43 | -11,48 | 0,8350 | -0,1422 | |||
| MGY / Magnolia Oil & Gas Corporation | 0,02 | 0,00 | 0,43 | -11,00 | 0,8298 | -0,1360 | |||
| BKE / The Buckle, Inc. | 0,01 | 0,00 | 0,43 | 18,23 | 0,8283 | 0,1033 | |||
| POR / Portland General Electric Company | 0,01 | 0,00 | 0,42 | -9,01 | 0,8210 | -0,1125 | |||
| YETI / YETI Holdings, Inc. | 0,01 | 0,00 | 0,42 | -4,75 | 0,8139 | -0,0714 | |||
| TBBK / The Bancorp, Inc. | 0,01 | 0,00 | 0,42 | 7,79 | 0,8037 | 0,0316 | |||
| ACMR / ACM Research, Inc. | 0,02 | 0,41 | 0,8009 | 0,8009 | |||||
| CASY / Casey's General Stores, Inc. | 0,00 | 0,00 | 0,41 | 17,38 | 0,7978 | 0,0949 | |||
| IDCC / InterDigital, Inc. | 0,00 | 0,38 | 0,7367 | 0,7367 | |||||
| NHC / National HealthCare Corporation | 0,00 | 0,00 | 0,38 | 15,55 | 0,7332 | 0,0746 | |||
| PRGS / Progress Software Corporation | 0,01 | 0,00 | 0,38 | 23,93 | 0,7323 | 0,1203 | |||
| AIT / Applied Industrial Technologies, Inc. | 0,00 | 0,00 | 0,37 | 3,35 | 0,7157 | -0,0030 | |||
| DINO / HF Sinclair Corporation | 0,01 | 0,00 | 0,37 | 25,00 | 0,7072 | 0,1209 | |||
| SBRA / Sabra Health Care REIT, Inc. | 0,02 | 0,00 | 0,36 | 5,54 | 0,7009 | 0,0131 | |||
| FHI / Federated Hermes, Inc. | 0,01 | 0,00 | 0,35 | 8,44 | 0,6723 | 0,0317 | |||
| ANDE / The Andersons, Inc. | 0,01 | 0,00 | 0,35 | -14,36 | 0,6691 | -0,1405 | |||
| ENSG / The Ensign Group, Inc. | 0,00 | 0,00 | 0,35 | 19,38 | 0,6681 | 0,0876 | |||
| EPR / EPR Properties | 0,01 | 0,00 | 0,34 | 10,71 | 0,6598 | 0,0426 | |||
| OPCH / Option Care Health, Inc. | 0,01 | 0,00 | 0,34 | -6,83 | 0,6591 | -0,0755 | |||
| AFG / American Financial Group, Inc. | 0,00 | 0,00 | 0,33 | -4,06 | 0,6415 | -0,0500 | |||
| STAG / STAG Industrial, Inc. | 0,01 | 0,00 | 0,32 | 0,62 | 0,6249 | -0,0195 | |||
| BZH / Beazer Homes USA, Inc. | 0,01 | 0,00 | 0,32 | 9,56 | 0,6213 | 0,0347 | |||
| GPK / Graphic Packaging Holding Company | 0,02 | 0,00 | 0,32 | -18,78 | 0,6185 | -0,1708 | |||
| XHR / Xenia Hotels & Resorts, Inc. | 0,03 | 0,00 | 0,32 | 7,12 | 0,6111 | 0,0189 | |||
| KTB / Kontoor Brands, Inc. | 0,00 | 0,00 | 0,30 | 3,08 | 0,5819 | -0,0040 | |||
| NOG / Northern Oil and Gas, Inc. | 0,01 | 0,00 | 0,30 | -6,31 | 0,5752 | -0,0601 | |||
| MHO / M/I Homes, Inc. | 0,00 | 0,00 | 0,28 | -1,79 | 0,5326 | -0,0292 | |||
| ACLS / Axcelis Technologies, Inc. | 0,00 | 0,00 | 0,28 | 40,31 | 0,5323 | 0,1393 | |||
| ANIP / ANI Pharmaceuticals, Inc. | 0,00 | 0,00 | 0,26 | -2,58 | 0,5107 | -0,0321 | |||
| HI / Hillenbrand, Inc. | 0,01 | 0,00 | 0,26 | -17,03 | 0,5095 | -0,1253 | |||
| ALKS / Alkermes plc | 0,01 | 0,00 | 0,26 | -13,42 | 0,5004 | -0,0978 | |||
| UE / Urban Edge Properties | 0,01 | 0,00 | 0,26 | -1,54 | 0,4950 | -0,0271 | |||
| BKU / BankUnited, Inc. | 0,01 | 0,00 | 0,25 | 3,29 | 0,4856 | -0,0011 | |||
| CNR / Core Natural Resources, Inc. | 0,00 | 0,00 | 0,23 | -9,41 | 0,4465 | -0,0648 | |||
| MUR / Murphy Oil Corporation | 0,01 | 0,00 | 0,21 | -20,91 | 0,4038 | -0,1241 | |||
| ASO / Academy Sports and Outdoors, Inc. | 0,00 | 0,00 | 0,20 | -1,95 | 0,3901 | -0,0212 | |||
| CLF / Cleveland-Cliffs Inc. | 0,02 | 0,00 | 0,19 | -7,92 | 0,3610 | -0,0434 | |||
| SLVM / Sylvamo Corporation | 0,00 | 0,00 | 0,19 | -25,30 | 0,3606 | -0,1394 | |||
| SNX / TD SYNNEX Corporation | 0,00 | 0,00 | 0,15 | 30,70 | 0,2885 | 0,0596 | |||
| CHRD / Chord Energy Corporation | 0,00 | 0,00 | 0,14 | -13,86 | 0,2770 | -0,0569 | |||
| CNXC / Concentrix Corporation | 0,00 | 0,00 | 0,13 | -5,04 | 0,2554 | -0,0231 |