Statistiques de base
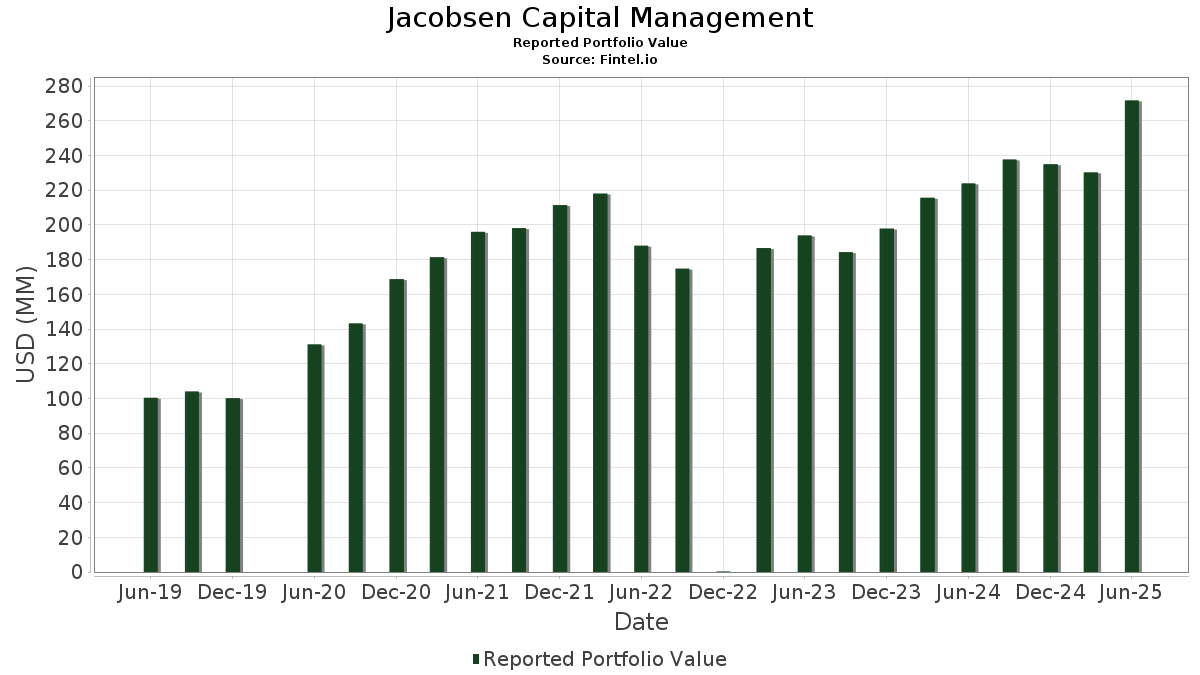
| Valeur du portefeuille | $ 271 631 378 |
| Positions actuelles | 116 |
Dernières positions, performances, ASG (à partir des dépôts 13F, 13D)
Jacobsen Capital Management a déclaré un total de 116 positions dans ses derniers dépôts auprès de la SEC. La valeur la plus récente du portefeuille est calculée à 271 631 378 USD. Les actifs sous gestion réels (ASG) sont cette valeur plus les liquidités (qui ne sont pas divulguées). Les principales positions de Jacobsen Capital Management sont Vanguard Tax-Managed Funds - Vanguard FTSE Developed Markets ETF (US:VEA) , Vanguard Index Funds - Vanguard Growth ETF (US:VUG) , Vanguard Index Funds - Vanguard Value ETF (US:VTV) , Vanguard Index Funds - Vanguard Small-Cap Value ETF (US:VBR) , and Vanguard Index Funds - Vanguard Small-Cap Growth ETF (US:VBK) . Les nouvelles positions de Jacobsen Capital Management incluent GE Vernova Inc. (US:GEV) , BlackRock, Inc. (US:BLK) , CrowdStrike Holdings, Inc. (US:CRWD) , Elevance Health, Inc. (US:ELV) , and Lam Research Corporation (US:LRCX) .
Meilleures augmentations ce trimestre
Nous utilisons la variation de l'allocation du portefeuille car il s'agit de l'indicateur le plus significatif. Les changements peuvent être dus à des transactions ou à des variations de prix des actions.
| Titre | Actions (en millions) |
Valeur ($ en millions) |
% du portefeuille | ΔPortefeuille % |
|---|---|---|---|---|
| 0,05 | 7,74 | 2,8490 | 0,7379 | |
| 0,02 | 7,83 | 2,8814 | 0,6406 | |
| 0,10 | 44,88 | 16,5228 | 0,3653 | |
| 0,01 | 2,55 | 0,9385 | 0,3331 | |
| 0,00 | 3,15 | 1,1611 | 0,2120 | |
| 0,02 | 4,04 | 1,4875 | 0,1669 | |
| 0,01 | 1,79 | 0,6581 | 0,1661 | |
| 0,02 | 5,17 | 1,9039 | 0,1416 | |
| 0,04 | 11,23 | 4,1335 | 0,1237 | |
| 0,00 | 0,32 | 0,1196 | 0,1196 |
Principales baisses ce trimestre
Nous utilisons la variation de l'allocation du portefeuille car il s'agit de l'indicateur le plus significatif. Les changements peuvent être dus à des transactions ou à des variations de prix des actions.
| Titre | Actions (en millions) |
Valeur ($ en millions) |
% du portefeuille | ΔPortefeuille % |
|---|---|---|---|---|
| 0,19 | 32,84 | 12,0890 | -1,6116 | |
| 0,03 | 7,11 | 2,6170 | -0,4132 | |
| 0,98 | 56,10 | 20,6535 | -0,4039 | |
| 0,04 | 5,72 | 2,1061 | -0,3868 | |
| 0,07 | 13,93 | 5,1276 | -0,3752 | |
| 0,06 | 4,72 | 1,7389 | -0,2935 | |
| 0,00 | 0,21 | 0,0783 | -0,2494 | |
| 0,03 | 2,60 | 0,9589 | -0,2147 | |
| 0,00 | 1,60 | 0,5884 | -0,1246 | |
| 0,00 | 0,64 | 0,2367 | -0,1150 |
Déclarations 13F et dépôts de fonds
Ce formulaire a été déposé le 2025-07-30 pour la période de déclaration 2025-06-30. Cliquez sur l'icône du lien pour voir l'historique complet des transactions.
Mettre à niveau pour débloquer les données premium et exporter vers Excel ![]() .
.
| Titre | Type | Prix moyen de l'action | Actions (en millions) |
ΔActions (%) |
ΔActions (%) |
Valeur ($ en millions) |
Portefeuille (%) |
ΔPortefeuille (%) |
|
|---|---|---|---|---|---|---|---|---|---|
| VEA / Vanguard Tax-Managed Funds - Vanguard FTSE Developed Markets ETF | 0,98 | 3,21 | 56,10 | 15,76 | 20,6535 | -0,4039 | |||
| VUG / Vanguard Index Funds - Vanguard Growth ETF | 0,10 | 2,08 | 44,88 | 20,69 | 16,5228 | 0,3653 | |||
| VTV / Vanguard Index Funds - Vanguard Value ETF | 0,19 | 1,78 | 32,84 | 4,14 | 12,0890 | -1,6116 | |||
| VBR / Vanguard Index Funds - Vanguard Small-Cap Value ETF | 0,07 | 5,05 | 13,93 | 9,97 | 5,1276 | -0,3752 | |||
| VBK / Vanguard Index Funds - Vanguard Small-Cap Growth ETF | 0,04 | 10,60 | 11,23 | 21,66 | 4,1335 | 0,1237 | |||
| SCHF / Schwab Strategic Trust - Schwab International Equity ETF | 0,41 | 3,97 | 9,11 | 16,16 | 3,3522 | -0,0536 | |||
| MSFT / Microsoft Corporation | 0,02 | 14,53 | 7,83 | 51,75 | 2,8814 | 0,6406 | |||
| NVDA / NVIDIA Corporation | 0,05 | 9,26 | 7,74 | 59,25 | 2,8490 | 0,7379 | |||
| AAPL / Apple Inc. | 0,03 | 10,35 | 7,11 | 1,92 | 2,6170 | -0,4132 | |||
| EXR / Extra Space Storage Inc. | 0,04 | 0,42 | 5,72 | -0,30 | 2,1061 | -0,3868 | |||
| VB / Vanguard Index Funds - Vanguard Small-Cap ETF | 0,02 | 19,30 | 5,17 | 27,49 | 1,9039 | 0,1416 | |||
| BIV / Vanguard Bond Index Funds - Vanguard Intermediate-Term Bond ETF | 0,06 | -0,03 | 4,72 | 0,98 | 1,7389 | -0,2935 | |||
| AMZN / Amazon.com, Inc. | 0,02 | 15,29 | 4,04 | 32,94 | 1,4875 | 0,1669 | |||
| GOOGL / Alphabet Inc. | 0,02 | 5,46 | 3,47 | 20,19 | 1,2758 | 0,0230 | |||
| META / Meta Platforms, Inc. | 0,00 | 12,74 | 3,15 | 44,37 | 1,1611 | 0,2120 | |||
| BSV / Vanguard Bond Index Funds - Vanguard Short-Term Bond ETF | 0,03 | -4,09 | 2,60 | -3,59 | 0,9589 | -0,2147 | |||
| AVGO / Broadcom Inc. | 0,01 | 11,13 | 2,55 | 82,99 | 0,9385 | 0,3331 | |||
| V / Visa Inc. | 0,01 | 11,14 | 1,97 | 12,61 | 0,7237 | -0,0349 | |||
| TSLA / Tesla, Inc. | 0,01 | 28,79 | 1,79 | 57,86 | 0,6581 | 0,1661 | |||
| BRK.B / Berkshire Hathaway Inc. | 0,00 | 6,78 | 1,60 | -2,56 | 0,5884 | -0,1246 | |||
| JPM / JPMorgan Chase & Co. | 0,01 | 7,38 | 1,54 | 26,96 | 0,5670 | 0,0398 | |||
| GOOG / Alphabet Inc. | 0,01 | 27,93 | 1,33 | 45,30 | 0,4891 | 0,0917 | |||
| MA / Mastercard Incorporated | 0,00 | 10,80 | 1,26 | 13,65 | 0,4628 | -0,0180 | |||
| LLY / Eli Lilly and Company | 0,00 | 15,86 | 1,22 | 9,34 | 0,4486 | -0,0355 | |||
| SCHX / Schwab Strategic Trust - Schwab U.S. Large-Cap ETF | 0,04 | 0,07 | 1,01 | 10,70 | 0,3736 | -0,0244 | |||
| HD / The Home Depot, Inc. | 0,00 | 15,20 | 0,99 | 15,35 | 0,3652 | -0,0088 | |||
| NFLX / Netflix, Inc. | 0,00 | 5,09 | 0,97 | 50,94 | 0,3559 | 0,0776 | |||
| WMT / Walmart Inc. | 0,01 | 13,71 | 0,94 | 26,68 | 0,3461 | 0,0236 | |||
| BKNG / Booking Holdings Inc. | 0,00 | -2,44 | 0,93 | 22,65 | 0,3410 | 0,0127 | |||
| XOM / Exxon Mobil Corporation | 0,01 | 41,10 | 0,88 | 27,93 | 0,3255 | 0,0251 | |||
| GLD / SPDR Gold Trust | 0,00 | 0,00 | 0,88 | 5,75 | 0,3252 | -0,0376 | |||
| SPGI / S&P Global Inc. | 0,00 | -0,06 | 0,87 | 3,72 | 0,3187 | -0,0440 | |||
| APH / Amphenol Corporation | 0,01 | -3,41 | 0,87 | 45,38 | 0,3186 | 0,0601 | |||
| GJR / Strats Trust For Procter & Gambel Security - Preferred Security | 0,01 | 7,53 | 0,81 | 0,63 | 0,2964 | -0,0516 | |||
| IWF / iShares Trust - iShares Russell 1000 Growth ETF | 0,00 | 0,42 | 0,80 | 18,06 | 0,2961 | 0,0002 | |||
| COST / Costco Wholesale Corporation | 0,00 | 7,55 | 0,78 | 12,65 | 0,2854 | -0,0138 | |||
| JNJ / Johnson & Johnson | 0,00 | 54,32 | 0,75 | 42,29 | 0,2751 | 0,0467 | |||
| ABBV / AbbVie Inc. | 0,00 | 11,65 | 0,68 | -1,16 | 0,2521 | -0,0488 | |||
| ORCL / Oracle Corporation | 0,00 | 10,04 | 0,65 | 72,22 | 0,2399 | 0,0754 | |||
| TMO / Thermo Fisher Scientific Inc. | 0,00 | -2,52 | 0,64 | -20,52 | 0,2367 | -0,1150 | |||
| GE / General Electric Company | 0,00 | 12,42 | 0,58 | 44,78 | 0,2144 | 0,0394 | |||
| KO / The Coca-Cola Company | 0,01 | 14,25 | 0,58 | 12,84 | 0,2138 | -0,0098 | |||
| SHW / The Sherwin-Williams Company | 0,00 | -5,01 | 0,57 | -6,53 | 0,2111 | -0,0556 | |||
| PLTR / Palantir Technologies Inc. | 0,00 | 13,62 | 0,57 | 83,65 | 0,2110 | 0,0753 | |||
| CSCO / Cisco Systems, Inc. | 0,01 | 30,32 | 0,56 | 46,60 | 0,2064 | 0,0401 | |||
| RTX / RTX Corporation | 0,00 | 3,11 | 0,53 | 13,68 | 0,1961 | -0,0075 | |||
| AMD / Advanced Micro Devices, Inc. | 0,00 | 20,76 | 0,53 | 66,67 | 0,1954 | 0,0571 | |||
| IBM / International Business Machines Corporation | 0,00 | 18,17 | 0,53 | 40,32 | 0,1948 | 0,0307 | |||
| PM / Philip Morris International Inc. | 0,00 | 18,61 | 0,50 | 36,24 | 0,1842 | 0,0245 | |||
| WFC / Wells Fargo & Company | 0,01 | 12,50 | 0,50 | 25,57 | 0,1826 | 0,0109 | |||
| SIVR / abrdn Silver ETF Trust - abrdn Physical Silver Shares ETF | 0,01 | 0,00 | 0,49 | 5,83 | 0,1804 | -0,0208 | |||
| INTU / Intuit Inc. | 0,00 | 11,45 | 0,48 | 43,03 | 0,1777 | 0,0310 | |||
| CRM / Salesforce, Inc. | 0,00 | 3,47 | 0,48 | 5,27 | 0,1764 | -0,0216 | |||
| ABT / Abbott Laboratories | 0,00 | 14,50 | 0,48 | 17,20 | 0,1759 | -0,0009 | |||
| TJX / The TJX Companies, Inc. | 0,00 | -4,47 | 0,47 | -3,08 | 0,1739 | -0,0380 | |||
| T / AT&T Inc. | 0,02 | 13,06 | 0,47 | 15,72 | 0,1736 | -0,0035 | |||
| BAC / Bank of America Corporation | 0,01 | 5,72 | 0,47 | 19,90 | 0,1732 | 0,0027 | |||
| NOW / ServiceNow, Inc. | 0,00 | 33,73 | 0,46 | 72,73 | 0,1680 | 0,0532 | |||
| LIN / Linde plc | 0,00 | 13,78 | 0,42 | 14,67 | 0,1555 | -0,0046 | |||
| UBER / Uber Technologies, Inc. | 0,00 | 25,89 | 0,39 | 61,67 | 0,1430 | 0,0383 | |||
| ADBE / Adobe Inc. | 0,00 | -1,63 | 0,37 | -0,80 | 0,1376 | -0,0261 | |||
| WMB / The Williams Companies, Inc. | 0,01 | 1,07 | 0,37 | 6,27 | 0,1373 | -0,0152 | |||
| VZ / Verizon Communications Inc. | 0,01 | 10,38 | 0,36 | 5,26 | 0,1328 | -0,0160 | |||
| MCD / McDonald's Corporation | 0,00 | 13,17 | 0,36 | 5,95 | 0,1312 | -0,0151 | |||
| NEE / NextEra Energy, Inc. | 0,01 | 26,93 | 0,35 | 24,37 | 0,1279 | 0,0065 | |||
| QCOM / QUALCOMM Incorporated | 0,00 | 9,32 | 0,35 | 13,49 | 0,1272 | -0,0052 | |||
| MS / Morgan Stanley | 0,00 | 9,72 | 0,34 | 32,17 | 0,1259 | 0,0137 | |||
| ETN / Eaton Corporation plc | 0,00 | 24,57 | 0,34 | 63,90 | 0,1239 | 0,0345 | |||
| BSX / Boston Scientific Corporation | 0,00 | 8,41 | 0,33 | 15,17 | 0,1233 | -0,0028 | |||
| ISRG / Intuitive Surgical, Inc. | 0,00 | 6,40 | 0,33 | 16,78 | 0,1230 | -0,0013 | |||
| GEV / GE Vernova Inc. | 0,00 | 0,32 | 0,1196 | 0,1196 | |||||
| MU / Micron Technology, Inc. | 0,00 | 12,22 | 0,32 | 58,82 | 0,1196 | 0,0309 | |||
| MRK / Merck & Co., Inc. | 0,00 | 30,55 | 0,32 | 15,36 | 0,1190 | -0,0030 | |||
| CAT / Caterpillar Inc. | 0,00 | 0,32 | 0,1188 | 0,1188 | |||||
| AXP / American Express Company | 0,00 | 12,00 | 0,30 | 32,89 | 0,1118 | 0,0124 | |||
| UNP / Union Pacific Corporation | 0,00 | 4,58 | 0,30 | 2,05 | 0,1102 | -0,0175 | |||
| PGR / The Progressive Corporation | 0,00 | 19,40 | 0,30 | 12,50 | 0,1094 | -0,0053 | |||
| PANW / Palo Alto Networks, Inc. | 0,00 | 8,28 | 0,30 | 30,26 | 0,1094 | 0,0100 | |||
| TXN / Texas Instruments Incorporated | 0,00 | -2,99 | 0,30 | 12,12 | 0,1090 | -0,0058 | |||
| DIS / The Walt Disney Company | 0,00 | 13,42 | 0,30 | 42,51 | 0,1088 | 0,0187 | |||
| XPRO / Expro Group Holdings N.V. | 0,00 | -1,42 | 0,29 | -23,26 | 0,1060 | -0,0565 | |||
| AMGN / Amgen Inc. | 0,00 | 18,90 | 0,28 | 6,42 | 0,1041 | -0,0112 | |||
| ACN / Accenture plc | 0,00 | -0,42 | 0,28 | -4,75 | 0,1037 | -0,0246 | |||
| ADP / Automatic Data Processing, Inc. | 0,00 | 3,78 | 0,28 | 4,49 | 0,1030 | -0,0130 | |||
| AMAT / Applied Materials, Inc. | 0,00 | 0,28 | 0,1022 | 0,1022 | |||||
| ANET / Arista Networks Inc | 0,00 | 0,27 | 0,1009 | 0,1009 | |||||
| BLK / BlackRock, Inc. | 0,00 | 0,27 | 0,1008 | 0,1008 | |||||
| SYK / Stryker Corporation | 0,00 | 21,89 | 0,27 | 29,67 | 0,0998 | 0,0089 | |||
| HON / Honeywell International Inc. | 0,00 | 11,94 | 0,27 | 22,94 | 0,0989 | 0,0041 | |||
| SO / The Southern Company | 0,00 | 18,15 | 0,27 | 18,14 | 0,0986 | -0,0000 | |||
| CRWD / CrowdStrike Holdings, Inc. | 0,00 | 0,27 | 0,0977 | 0,0977 | |||||
| ZTS / Zoetis Inc. | 0,00 | -6,66 | 0,26 | -11,71 | 0,0974 | -0,0326 | |||
| ELV / Elevance Health, Inc. | 0,00 | 0,26 | 0,0971 | 0,0971 | |||||
| LRCX / Lam Research Corporation | 0,00 | 0,26 | 0,0965 | 0,0965 | |||||
| PH / Parker-Hannifin Corporation | 0,00 | 10,81 | 0,26 | 27,23 | 0,0949 | 0,0069 | |||
| O / Realty Income Corporation | 0,00 | 0,88 | 0,25 | 0,40 | 0,0925 | -0,0165 | |||
| COF / Capital One Financial Corporation | 0,00 | 0,25 | 0,0918 | 0,0918 | |||||
| BR / Broadridge Financial Solutions, Inc. | 0,00 | -0,39 | 0,25 | -0,40 | 0,0908 | -0,0165 | |||
| GSCE / GS Connect S&P GSCI Enhanced Commodity Total Return ETN | 0,00 | 0,23 | 0,0842 | 0,0842 | |||||
| CMCSA / Comcast Corporation | 0,01 | 13,53 | 0,22 | 9,80 | 0,0827 | -0,0062 | |||
| CB / Chubb Limited | 0,00 | 5,31 | 0,22 | 0,90 | 0,0824 | -0,0139 | |||
| GILD / Gilead Sciences, Inc. | 0,00 | 0,22 | 0,0824 | 0,0824 | |||||
| ADSK / Autodesk, Inc. | 0,00 | 0,22 | 0,0806 | 0,0806 | |||||
| TT / Trane Technologies plc | 0,00 | 0,21 | 0,0791 | 0,0791 | |||||
| BA / The Boeing Company | 0,00 | 0,21 | 0,0789 | 0,0789 | |||||
| SWX / Southwest Gas Holdings, Inc. | 0,00 | 0,21 | 0,0789 | 0,0789 | |||||
| UNH / UnitedHealth Group Incorporated | 0,00 | -52,64 | 0,21 | -71,88 | 0,0783 | -0,2494 | |||
| FTXP / Foothills Exploration, Inc. | 0,00 | 0,21 | 0,0775 | 0,0775 | |||||
| TMUS / T-Mobile US, Inc. | 0,00 | 2,68 | 0,21 | -8,30 | 0,0774 | -0,0222 | |||
| SCHW / The Charles Schwab Corporation | 0,00 | 0,21 | 0,0771 | 0,0771 | |||||
| CME / CME Group Inc. | 0,00 | 0,21 | 0,0769 | 0,0769 | |||||
| LOW / Lowe's Companies, Inc. | 0,00 | 0,22 | 0,21 | -4,65 | 0,0758 | -0,0180 | |||
| BMY / Bristol-Myers Squibb Company | 0,00 | 0,20 | 0,0748 | 0,0748 | |||||
| MO / Altria Group, Inc. | 0,00 | 0,20 | 0,0741 | 0,0741 | |||||
| MDT / Medtronic plc | 0,00 | 0,20 | 0,0737 | 0,0737 | |||||
| PACS / PACS Group, Inc. | 0,01 | 0,19 | 0,0699 | 0,0699 | |||||
| MMC / Marsh & McLennan Companies, Inc. | 0,00 | -100,00 | 0,00 | 0,0000 | |||||
| PFE / Pfizer Inc. | 0,00 | -100,00 | 0,00 | 0,0000 | |||||
| NEM / Newmont Corporation | 0,00 | -100,00 | 0,00 | 0,0000 | |||||
| PEP / PepsiCo, Inc. | 0,00 | -100,00 | 0,00 | 0,0000 | |||||
| COP / ConocoPhillips | 0,00 | -100,00 | 0,00 | 0,0000 | |||||
| CVX / Chevron Corporation | 0,00 | -100,00 | 0,00 | 0,0000 |