Statistiques de base
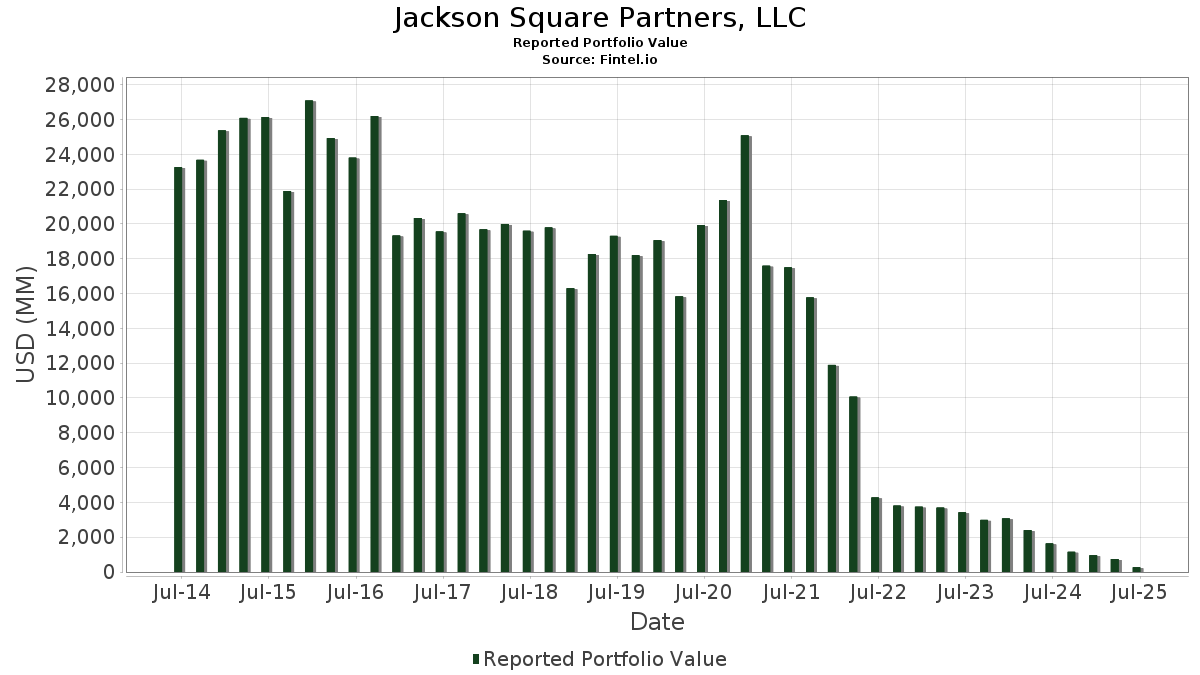
| Valeur du portefeuille | $ 270 383 225 |
| Positions actuelles | 54 |
Dernières positions, performances, ASG (à partir des dépôts 13F, 13D)
Jackson Square Partners, LLC a déclaré un total de 54 positions dans ses derniers dépôts auprès de la SEC. La valeur la plus récente du portefeuille est calculée à 270 383 225 USD. Les actifs sous gestion réels (ASG) sont cette valeur plus les liquidités (qui ne sont pas divulguées). Les principales positions de Jackson Square Partners, LLC sont Microsoft Corporation (US:MSFT) , NVIDIA Corporation (US:NVDA) , Amazon.com, Inc. (US:AMZN) , Vertiv Holdings Co (US:VRT) , and Alphabet Inc. (US:GOOGL) . Les nouvelles positions de Jackson Square Partners, LLC incluent Neogen Corporation (US:NEOG) , . Les principales industries de Jackson Square Partners, LLC sont "Apparel And Accessory Stores" (sic 56) , "Electric, Gas, And Sanitary Services " (sic 49) , and "Personal Services" (sic 72) .
Meilleures augmentations ce trimestre
Nous utilisons la variation de l'allocation du portefeuille car il s'agit de l'indicateur le plus significatif. Les changements peuvent être dus à des transactions ou à des variations de prix des actions.
| Titre | Actions (en millions) |
Valeur ($ en millions) |
% du portefeuille | ΔPortefeuille % |
|---|---|---|---|---|
| 0,13 | 20,91 | 7,7325 | 5,5165 | |
| 0,04 | 21,68 | 8,0174 | 5,2961 | |
| 0,07 | 14,68 | 5,4301 | 3,4628 | |
| 0,06 | 10,51 | 3,8869 | 2,4620 | |
| 0,08 | 10,90 | 4,0330 | 1,8760 | |
| 0,03 | 6,56 | 2,4273 | 1,6019 | |
| 0,01 | 7,77 | 2,8753 | 1,4463 | |
| 0,01 | 5,72 | 2,1145 | 1,4305 | |
| 0,02 | 6,97 | 2,5761 | 1,4014 | |
| 0,01 | 5,80 | 2,1450 | 1,2815 |
Principales baisses ce trimestre
Nous utilisons la variation de l'allocation du portefeuille car il s'agit de l'indicateur le plus significatif. Les changements peuvent être dus à des transactions ou à des variations de prix des actions.
| Titre | Actions (en millions) |
Valeur ($ en millions) |
% du portefeuille | ΔPortefeuille % |
|---|---|---|---|---|
| 0,01 | 2,77 | 1,0258 | -2,4612 | |
| 0,06 | 4,47 | 1,6521 | -2,3677 | |
| 0,04 | 2,45 | 0,9074 | -1,8689 | |
| 0,01 | 2,91 | 1,0773 | -1,8616 | |
| 0,04 | 3,63 | 1,3440 | -1,7443 | |
| 0,01 | 2,93 | 1,0826 | -1,6449 | |
| 0,02 | 2,95 | 1,0901 | -1,6404 | |
| 0,06 | 2,95 | 1,0898 | -1,6218 | |
| 0,02 | 5,05 | 1,8669 | -1,6085 | |
| 0,05 | 3,33 | 1,2334 | -1,5858 |
Déclarations 13D/G
Il s'agit d'une liste des déclarations 13D et 13G déposées au cours de la dernière année (le cas échéant). Cliquez sur l'icône du lien pour voir l'historique complet des transactions. Les lignes vertes indiquent de nouvelles positions. Les lignes rouges indiquent des positions fermées.
| Date de dépôt | Formulaire | Titre | Actions précédentes |
Actions actuelles |
ΔActions % | % de participation |
% ΔParticipation | |
|---|---|---|---|---|---|---|---|---|
| 2025-02-04 | LC / LendingClub Corporation | 9 723 943 | 2 840 376 | -70,79 | 2,53 | -71,48 |
Déclarations 13F et dépôts de fonds
Ce formulaire a été déposé le 2025-08-07 pour la période de déclaration 2025-06-30. Cliquez sur l'icône du lien pour voir l'historique complet des transactions.
Mettre à niveau pour débloquer les données premium et exporter vers Excel ![]() .
.
| Titre | Type | Prix moyen de l'action | Actions (en millions) |
ΔActions (%) |
ΔActions (%) |
Valeur ($ en millions) |
Portefeuille (%) |
ΔPortefeuille (%) |
|
|---|---|---|---|---|---|---|---|---|---|
| MSFT / Microsoft Corporation | 0,04 | -19,15 | 21,68 | 7,14 | 8,0174 | 5,2961 | |||
| NVDA / NVIDIA Corporation | 0,13 | -12,96 | 20,91 | 26,89 | 7,7325 | 5,5165 | |||
| AMZN / Amazon.com, Inc. | 0,07 | -12,96 | 14,68 | 0,38 | 5,4301 | 3,4628 | |||
| VRT / Vertiv Holdings Co | 0,08 | -61,77 | 10,90 | -32,01 | 4,0330 | 1,8760 | |||
| GOOGL / Alphabet Inc. | 0,06 | -12,96 | 10,51 | -0,80 | 3,8869 | 2,4620 | |||
| SBAC / SBA Communications Corporation | 0,04 | -70,68 | 9,48 | -68,71 | 3,5048 | -0,5681 | |||
| MA / Mastercard Incorporated | 0,01 | -28,63 | 7,77 | -26,83 | 2,8753 | 1,4463 | |||
| V / Visa Inc. | 0,02 | -21,29 | 6,97 | -20,25 | 2,5761 | 1,4014 | |||
| BA / The Boeing Company | 0,03 | -12,96 | 6,56 | 6,94 | 2,4273 | 1,6019 | |||
| SPGI / S&P Global Inc. | 0,01 | -12,96 | 5,80 | -9,67 | 2,1450 | 1,2815 | |||
| CME / CME Group Inc. | 0,02 | -35,23 | 5,78 | -32,71 | 2,1384 | 0,9829 | |||
| NOW / ServiceNow, Inc. | 0,01 | -12,95 | 5,72 | 12,43 | 2,1145 | 1,4305 | |||
| CP / Canadian Pacific Kansas City Limited | 0,07 | -18,60 | 5,25 | -8,10 | 1,9431 | 1,1743 | |||
| CLH / Clean Harbors, Inc. | 0,02 | -83,35 | 5,05 | -80,47 | 1,8669 | -1,6085 | |||
| ASML / ASML Holding N.V. - Depositary Receipt (Common Stock) | 0,01 | -12,95 | 4,94 | 5,26 | 1,8284 | 1,1969 | |||
| STVN / Stevanato Group S.p.A. | 0,19 | -83,36 | 4,71 | -80,10 | 1,7408 | -1,4392 | |||
| WM / Waste Management, Inc. | 0,02 | -35,49 | 4,70 | -36,25 | 1,7386 | 0,7471 | |||
| ENTG / Entegris, Inc. | 0,06 | -69,83 | 4,69 | -72,19 | 1,7342 | -0,5334 | |||
| WH / Wyndham Hotels & Resorts, Inc. | 0,06 | -83,34 | 4,47 | -85,06 | 1,6521 | -2,3677 | |||
| ALGN / Align Technology, Inc. | 0,02 | -83,15 | 4,32 | -79,92 | 1,5990 | -1,2960 | |||
| HXL / Hexcel Corporation | 0,08 | -75,15 | 4,24 | -74,36 | 1,5689 | -0,6563 | |||
| WDAY / Workday, Inc. | 0,02 | -12,96 | 3,99 | -10,53 | 1,4765 | 0,8763 | |||
| ISRG / Intuitive Surgical, Inc. | 0,01 | -12,95 | 3,94 | -4,51 | 1,4575 | 0,9026 | |||
| SNPS / Synopsys, Inc. | 0,01 | 27,52 | 3,90 | 52,46 | 1,4426 | 1,0985 | |||
| LC / LendingClub Corporation | 0,32 | -83,35 | 3,88 | -80,59 | 1,4340 | -1,2520 | |||
| AMD / Advanced Micro Devices, Inc. | 0,03 | -12,96 | 3,69 | 20,21 | 1,3664 | 0,9531 | |||
| MKTX / MarketAxess Holdings Inc. | 0,02 | -83,35 | 3,63 | -82,81 | 1,3443 | -1,4990 | |||
| OKTA / Okta, Inc. | 0,04 | -83,34 | 3,63 | -84,18 | 1,3440 | -1,7443 | |||
| LIN / Linde plc | 0,01 | -12,95 | 3,57 | -12,28 | 1,3212 | 0,7734 | |||
| BILL / BILL Holdings, Inc. | 0,08 | -71,17 | 3,57 | -70,95 | 1,3187 | -0,3316 | |||
| KKR / KKR & Co. Inc. | 0,03 | -12,95 | 3,56 | 0,17 | 1,3172 | 0,8390 | |||
| SITE / SiteOne Landscape Supply, Inc. | 0,03 | -83,34 | 3,56 | -83,41 | 1,3172 | -1,5697 | |||
| WSC / WillScot Holdings Corporation | 0,13 | -74,82 | 3,55 | -75,18 | 1,3128 | -0,6106 | |||
| ESTC / Elastic N.V. | 0,04 | -81,49 | 3,46 | -82,49 | 1,2811 | -1,3786 | |||
| UBER / Uber Technologies, Inc. | 0,04 | -35,34 | 3,40 | -17,23 | 1,2586 | 0,7058 | |||
| AAON / AAON, Inc. | 0,05 | -83,15 | 3,33 | -84,10 | 1,2334 | -1,5858 | |||
| NYT / The New York Times Company | 0,06 | -83,34 | 3,23 | -81,19 | 1,1947 | -1,1153 | |||
| SBUX / Starbucks Corporation | 0,03 | -12,96 | 3,05 | -18,69 | 1,1281 | 0,6236 | |||
| HWM / Howmet Aerospace Inc. | 0,02 | -89,88 | 2,95 | -85,48 | 1,0901 | -1,6404 | |||
| TECH / Bio-Techne Corporation | 0,06 | -83,35 | 2,95 | -85,39 | 1,0898 | -1,6218 | |||
| LLY / Eli Lilly and Company | 0,00 | -12,94 | 2,94 | -17,83 | 1,0860 | 0,6054 | |||
| MEDP / Medpace Holdings, Inc. | 0,01 | -85,99 | 2,93 | -85,57 | 1,0826 | -1,6449 | |||
| MOH / Molina Healthcare, Inc. | 0,01 | -85,26 | 2,91 | -86,67 | 1,0773 | -1,8616 | |||
| DHR / Danaher Corporation | 0,01 | -12,96 | 2,81 | -16,12 | 1,0391 | 0,5886 | |||
| BLD / TopBuild Corp. | 0,01 | -83,34 | 2,81 | -82,31 | 1,0385 | -1,0962 | |||
| KNSL / Kinsale Capital Group, Inc. | 0,01 | -89,24 | 2,77 | -89,30 | 1,0258 | -2,4612 | |||
| IQV / IQVIA Holdings Inc. | 0,02 | 14,58 | 2,59 | 2,45 | 0,9594 | 0,6188 | |||
| SSD / Simpson Manufacturing Co., Inc. | 0,02 | -83,34 | 2,51 | -83,53 | 0,9290 | -1,1216 | |||
| UNH / UnitedHealth Group Incorporated | 0,01 | 2,49 | 0,9197 | 0,9197 | |||||
| RYAN / Ryan Specialty Holdings, Inc. | 0,04 | -87,09 | 2,45 | -88,12 | 0,9074 | -1,8689 | |||
| ACLS / Axcelis Technologies, Inc. | 0,04 | -83,34 | 2,44 | -76,62 | 0,9034 | -0,5018 | |||
| WMG / Warner Music Group Corp. | 0,09 | -83,34 | 2,40 | -85,53 | 0,8861 | -1,3404 | |||
| NEOG / Neogen Corporation | 0,35 | 1,65 | 0,6105 | 0,6105 | |||||
| PACB / Pacific Biosciences of California, Inc. | 0,55 | -83,34 | 0,69 | -82,52 | 0,2537 | -0,2733 | |||
| WAB / Westinghouse Air Brake Technologies Corporation | 0,00 | -100,00 | 0,00 | 0,0000 | |||||
| CPRT / Copart, Inc. | 0,00 | -100,00 | 0,00 | 0,0000 | |||||
| GO / Grocery Outlet Holding Corp. | 0,00 | -100,00 | 0,00 | 0,0000 |