Statistiques de base
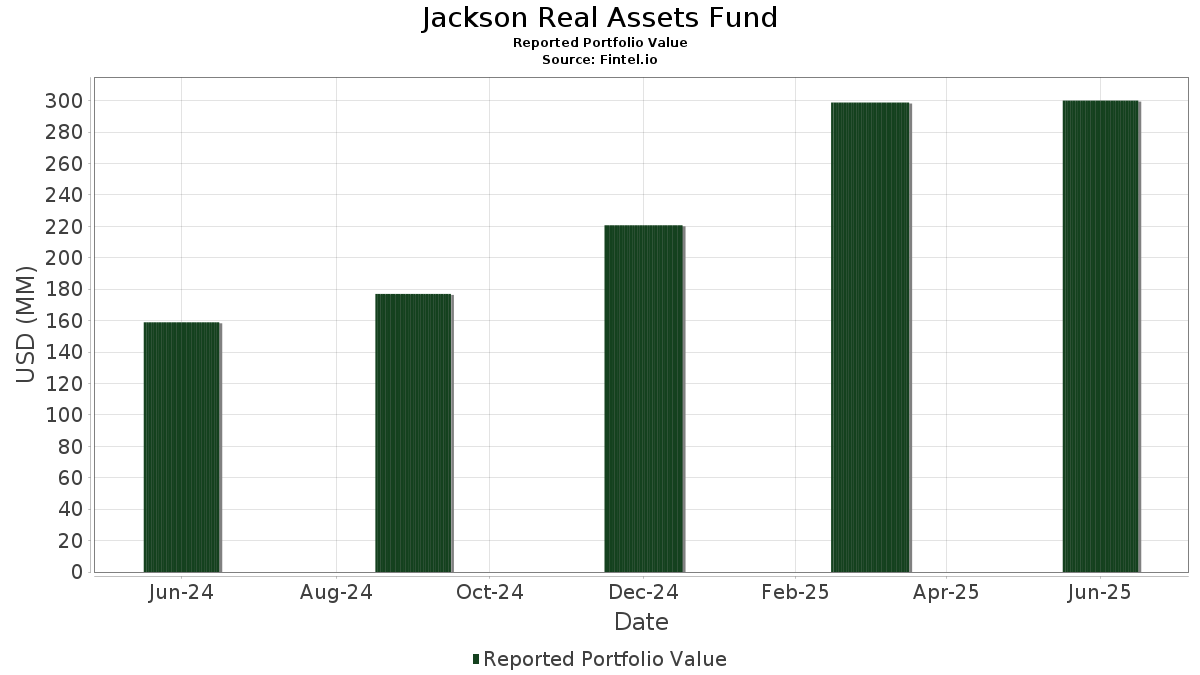
| Valeur du portefeuille | $ 300 036 118 |
| Positions actuelles | 91 |
Dernières positions, performances, ASG (à partir des dépôts 13F, 13D)
Jackson Real Assets Fund a déclaré un total de 91 positions dans ses derniers dépôts auprès de la SEC. La valeur la plus récente du portefeuille est calculée à 300 036 118 USD. Les actifs sous gestion réels (ASG) sont cette valeur plus les liquidités (qui ne sont pas divulguées). Les principales positions de Jackson Real Assets Fund sont JNL Government Money Market Fund (US:46628D437) , Welltower Inc. (US:WELL) , American Tower Corporation (US:AMT) , Crown Castle Inc. (US:CCI) , and Digital Realty Trust, Inc. (US:DLR) . Les nouvelles positions de Jackson Real Assets Fund incluent Sempra (US:SRE) , Motiva Infraestrutura de Mobilidade S.A. (BR:MOTV3) , Kite Realty Group Trust (US:KRG) , Boston Properties, Inc. (US:BXP) , and CareTrust REIT, Inc. (US:CTRE) .
Meilleures augmentations ce trimestre
Nous utilisons la variation de l'allocation du portefeuille car il s'agit de l'indicateur le plus significatif. Les changements peuvent être dus à des transactions ou à des variations de prix des actions.
| Titre | Actions (en millions) |
Valeur ($ en millions) |
% du portefeuille | ΔPortefeuille % |
|---|---|---|---|---|
| 0,01 | 20,69 | 6,4933 | 6,4933 | |
| 13,93 | 18,88 | 5,9261 | 5,9261 | |
| 18,50 | 18,78 | 5,8955 | 5,8955 | |
| 0,01 | 17,90 | 5,6184 | 5,6184 | |
| 13,60 | 15,30 | 4,8018 | 4,8018 | |
| 10,25 | 10,43 | 3,2729 | 3,2729 | |
| 0,01 | 10,26 | 3,2186 | 3,2186 | |
| 4,54 | 6,93 | 2,1743 | 2,1743 | |
| 0,00 | 6,75 | 2,1182 | 2,1182 | |
| 0,00 | 4,99 | 1,5648 | 1,5648 |
Principales baisses ce trimestre
Nous utilisons la variation de l'allocation du portefeuille car il s'agit de l'indicateur le plus significatif. Les changements peuvent être dus à des transactions ou à des variations de prix des actions.
| Titre | Actions (en millions) |
Valeur ($ en millions) |
% du portefeuille | ΔPortefeuille % |
|---|---|---|---|---|
| 0,02 | 5,17 | 1,6230 | -0,7335 | |
| 35,96 | 35,96 | 11,2871 | -0,6284 | |
| 0,01 | 0,38 | 0,1201 | -0,3401 | |
| 0,03 | 0,67 | 0,2093 | -0,1808 | |
| 0,02 | 0,81 | 0,2533 | -0,1532 | |
| 0,02 | 1,30 | 0,4067 | -0,1343 | |
| 0,01 | 2,02 | 0,6348 | -0,1335 | |
| 0,09 | 0,72 | 0,2250 | -0,1253 | |
| 0,06 | 0,88 | 0,2756 | -0,1158 | |
| 0,00 | 2,02 | 0,6326 | -0,1045 |
Déclarations 13F et dépôts de fonds
Ce formulaire a été déposé le 2025-08-27 pour la période de déclaration 2025-06-30. Cliquez sur l'icône du lien pour voir l'historique complet des transactions.
Mettre à niveau pour débloquer les données premium et exporter vers Excel ![]() .
.
| Titre | Type | Prix moyen de l'action | Actions (en millions) |
ΔActions (%) |
ΔActions (%) |
Valeur ($ en millions) |
Portefeuille (%) |
ΔPortefeuille (%) |
|
|---|---|---|---|---|---|---|---|---|---|
| 46628D437 / JNL Government Money Market Fund | 35,96 | 0,91 | 35,96 | 0,91 | 11,2871 | -0,6284 | |||
| Harrison Street Infrastructure Fund A, L.P. / EC (N/A) | 0,01 | 20,69 | 6,4933 | 6,4933 | |||||
| CBRE U.S. Logistics Partners, L.P. / EC (N/A) | 13,93 | 18,88 | 5,9261 | 5,9261 | |||||
| Kayne Anderson Core Intermediate Fund, L.P. / EC (N/A) | 18,50 | 18,78 | 5,8955 | 5,8955 | |||||
| Harrison Street Core Property Fund, L.P. / EC (N/A) | 0,01 | 17,90 | 5,6184 | 5,6184 | |||||
| GDIF US Hedged Feeder Fund LP / EC (N/A) | 13,60 | 15,30 | 4,8018 | 4,8018 | |||||
| Kayne Commercial Real Estate Debt, L.P. / EC (N/A) | 10,25 | 10,43 | 3,2729 | 3,2729 | |||||
| Virtus Real Estate Enhanced Core, LP / EC (N/A) | 0,01 | 10,26 | 3,2186 | 3,2186 | |||||
| CBRE U.S. Core Partners, L.P. / EC (N/A) | 4,54 | 6,93 | 2,1743 | 2,1743 | |||||
| PGIM Real Estate U.S. Debt Fund, L.P. / EC (N/A) | 0,00 | 6,75 | 2,1182 | 2,1182 | |||||
| WELL / Welltower Inc. | 0,04 | 7,68 | 6,26 | 8,06 | 1,9658 | 0,0276 | |||
| AMT / American Tower Corporation | 0,02 | -27,77 | 5,17 | -26,63 | 1,6230 | -0,7335 | |||
| CCI / Crown Castle Inc. | 0,05 | 11,65 | 5,05 | 10,05 | 1,5852 | 0,0507 | |||
| Nuveen Global Timberland Fund, L.P. / EC (N/A) | 0,00 | 4,99 | 1,5648 | 1,5648 | |||||
| PRISA III Fund LP / EC (N/A) | 4,94 | 4,94 | 1,5502 | 1,5502 | |||||
| PRISA III Fund LP / EC (N/A) | 4,94 | 4,94 | 1,5502 | 1,5502 | |||||
| DLR / Digital Realty Trust, Inc. | 0,03 | 16,95 | 4,71 | 42,32 | 1,4777 | 0,3714 | |||
| Nuveen Global Farmland Fund Lux SCSp / EC (N/A) | 3,90 | 3,90 | 1,2242 | 1,2242 | |||||
| PLD / Prologis, Inc. | 0,03 | 14,19 | 3,63 | 7,39 | 1,1407 | 0,0090 | |||
| SBAC / SBA Communications Corporation | 0,01 | 69,50 | 2,97 | 80,91 | 0,9315 | 0,3830 | |||
| TCL / Transurban Group - Debt/Equity Composite Units | 0,29 | -2,07 | 2,68 | 7,08 | 0,8402 | 0,0045 | |||
| CrossHarbor Strategic Debt Fund, LP / EC (N/A) | 2,67 | 2,67 | 0,8394 | 0,8394 | |||||
| CrossHarbor Strategic Debt Fund, LP / EC (N/A) | 2,67 | 2,67 | 0,8394 | 0,8394 | |||||
| DUK / Duke Energy Corporation | 0,02 | 22,98 | 2,65 | 18,99 | 0,8322 | 0,0870 | |||
| AEP / American Electric Power Company, Inc. | 0,03 | 0,00 | 2,60 | -5,04 | 0,8167 | -0,0995 | |||
| NG. / National Grid plc | 0,17 | -3,14 | 2,52 | 8,61 | 0,7922 | 0,0152 | |||
| NSC / Norfolk Southern Corporation | 0,01 | 12,23 | 2,34 | 21,26 | 0,7360 | 0,0896 | |||
| SUI / Sun Communities, Inc. | 0,02 | 1,06 | 2,32 | -0,60 | 0,7276 | -0,0524 | |||
| EXR / Extra Space Storage Inc. | 0,02 | -1,45 | 2,25 | -2,13 | 0,7060 | -0,0626 | |||
| INVH / Invitation Homes Inc. | 0,07 | 8,16 | 2,24 | 1,82 | 0,7021 | -0,0327 | |||
| OKE / ONEOK, Inc. | 0,03 | 45,62 | 2,24 | 19,76 | 0,7020 | 0,0778 | |||
| XEL / Xcel Energy Inc. | 0,03 | 7,85 | 2,23 | 3,77 | 0,7006 | -0,0187 | |||
| LNG / Cheniere Energy, Inc. | 0,01 | 12,10 | 2,16 | 17,94 | 0,6769 | 0,0657 | |||
| SRE / Sempra | 0,03 | 2,04 | 0,6401 | 0,6401 | |||||
| SPG / Simon Property Group, Inc. | 0,01 | -9,07 | 2,02 | -11,97 | 0,6348 | -0,1335 | |||
| EQIX / Equinix, Inc. | 0,00 | -6,29 | 2,02 | -8,58 | 0,6326 | -0,1045 | |||
| GET / Compagnie Chargeurs Invest | 0,10 | -1,35 | 2,01 | 9,96 | 0,6311 | 0,0199 | |||
| WY / Weyerhaeuser Company | 0,07 | 7,73 | 1,92 | -5,48 | 0,6014 | -0,0764 | |||
| CSX / CSX Corporation | 0,06 | -5,63 | 1,91 | 4,60 | 0,5993 | -0,0109 | |||
| ESS / Essex Property Trust, Inc. | 0,01 | 18,10 | 1,80 | 9,20 | 0,5663 | 0,0137 | |||
| EVRG / Evergy, Inc. | 0,03 | 38,32 | 1,75 | 38,34 | 0,5493 | 0,1261 | |||
| FHZN / Flughafen Zürich AG | 0,01 | 0,00 | 1,74 | 20,24 | 0,5445 | 0,0619 | |||
| GAPB / Grupo Aeroportuario del Pacifico SAB de CV | 0,07 | 0,00 | 1,70 | 23,93 | 0,5351 | 0,0751 | |||
| CP / Canadian Pacific Kansas City Limited | 0,02 | 10,94 | 1,69 | 25,61 | 0,5311 | 0,0806 | |||
| IRM / Iron Mountain Incorporated | 0,02 | 16,01 | 1,63 | 38,34 | 0,5120 | 0,1176 | |||
| D / Dominion Energy, Inc. | 0,03 | 0,00 | 1,61 | 0,81 | 0,5067 | -0,0288 | |||
| PSA / Public Storage | 0,01 | -10,23 | 1,52 | -11,99 | 0,4769 | -0,1003 | |||
| ES / Eversource Energy | 0,02 | 0,00 | 1,45 | 2,40 | 0,4563 | -0,0183 | |||
| PEG / Public Service Enterprise Group Incorporated | 0,02 | -2,63 | 1,42 | -0,42 | 0,4442 | -0,0309 | |||
| SVT1 / Severn Trent PLC | 0,04 | 29,78 | 1,35 | 48,73 | 0,4244 | 0,1202 | |||
| NEE / NextEra Energy, Inc. | 0,02 | -18,21 | 1,30 | -19,96 | 0,4067 | -0,1343 | |||
| UDR / UDR, Inc. | 0,03 | 5,59 | 1,27 | -4,59 | 0,3985 | -0,0463 | |||
| HST / Host Hotels & Resorts, Inc. | 0,08 | 51,05 | 1,25 | 63,39 | 0,3908 | 0,1358 | |||
| ALX / Atlas Arteria Limited - Debt/Equity Composite Units | 0,36 | 0,00 | 1,19 | 9,96 | 0,3743 | 0,0116 | |||
| RWE / RWE Aktiengesellschaft | 0,03 | 7,56 | 1,14 | 25,36 | 0,3571 | 0,0538 | |||
| MOTV3 / Motiva Infraestrutura de Mobilidade S.A. | 0,44 | 1,13 | 0,3541 | 0,3541 | |||||
| KIM / Kimco Realty Corporation | 0,05 | 36,16 | 1,13 | 34,73 | 0,3533 | 0,0740 | |||
| HR / Healthcare Realty Trust Incorporated | 0,07 | 29,85 | 1,05 | 21,81 | 0,3297 | 0,0415 | |||
| O / Realty Income Corporation | 0,02 | 31,62 | 1,03 | 30,67 | 0,3238 | 0,0599 | |||
| DG / Vinci SA | 0,01 | -18,25 | 1,03 | -4,38 | 0,3225 | -0,0367 | |||
| PINFRA / Promotora y Operadora de Infraestructura, S. A. B. de C. V. | 0,09 | 0,00 | 1,01 | 11,84 | 0,3176 | 0,0152 | |||
| ADP / Automatic Data Processing, Inc. | 0,01 | 625,19 | 0,96 | 794,39 | 0,3005 | 0,2647 | |||
| ADC / Agree Realty Corporation | 0,01 | 83,91 | 0,90 | 74,18 | 0,2839 | 0,1101 | |||
| HIW / Highwoods Properties, Inc. | 0,03 | 5,86 | 0,89 | 11,03 | 0,2784 | 0,0113 | |||
| TRGP / Targa Resources Corp. | 0,01 | -7,81 | 0,88 | -19,98 | 0,2767 | -0,0915 | |||
| PCG / PG&E Corporation | 0,06 | -7,56 | 0,88 | -24,96 | 0,2756 | -0,1158 | |||
| HER / Hera S.p.A. | 0,18 | 11,86 | 0,88 | 24,75 | 0,2754 | 0,0401 | |||
| 0JA / Japan Airport Terminal Co., Ltd. | 0,03 | 30,00 | 0,87 | 50,52 | 0,2733 | 0,0797 | |||
| AMH / American Homes 4 Rent | 0,02 | 9,87 | 0,83 | 4,80 | 0,2606 | -0,0043 | |||
| VICI / VICI Properties Inc. | 0,02 | -33,59 | 0,81 | -33,63 | 0,2533 | -0,1532 | |||
| 788 / China Tower Corp Ltd | 0,51 | 10,46 | 0,73 | 17,12 | 0,2301 | 0,0210 | |||
| 2688 / ENN Energy Holdings Limited | 0,09 | -29,70 | 0,72 | -31,61 | 0,2250 | -0,1253 | |||
| 9021 N / West Japan Railway Company | 0,03 | -51,17 | 0,67 | -42,88 | 0,2093 | -0,1808 | |||
| INW / Infrastrutture Wireless Italiane S.p.A. | 0,05 | 0,00 | 0,64 | 15,47 | 0,2016 | 0,0156 | |||
| CZR / Caesars Entertainment, Inc. | 0,02 | 9,43 | 0,63 | 24,26 | 0,1980 | 0,0283 | |||
| UGI / UGI Corporation | 0,02 | -33,16 | 0,63 | -26,43 | 0,1977 | -0,0884 | |||
| BYD / Boyd Gaming Corporation | 0,01 | -3,53 | 0,60 | 14,64 | 0,1870 | 0,0132 | |||
| 694 / Beijing Capital International Airport Company Limited | 1,57 | 12,27 | 0,60 | 17,36 | 0,1868 | 0,0172 | |||
| KRG / Kite Realty Group Trust | 0,02 | 0,56 | 0,1768 | 0,1768 | |||||
| BXP / Boston Properties, Inc. | 0,01 | 0,53 | 0,1653 | 0,1653 | |||||
| DTM / DT Midstream, Inc. | 0,00 | 0,00 | 0,53 | 13,85 | 0,1652 | 0,0107 | |||
| COLD / Americold Realty Trust, Inc. | 0,03 | 20,01 | 0,51 | -6,95 | 0,1598 | -0,0232 | |||
| KRC / Kilroy Realty Corporation | 0,01 | 89,27 | 0,51 | 98,82 | 0,1592 | 0,0736 | |||
| LAMR / Lamar Advertising Company | 0,00 | -39,31 | 0,41 | -35,30 | 0,1273 | -0,0822 | |||
| OHI / Omega Healthcare Investors, Inc. | 0,01 | -71,11 | 0,38 | -72,24 | 0,1201 | -0,3401 | |||
| CTRE / CareTrust REIT, Inc. | 0,01 | 0,37 | 0,1170 | 0,1170 | |||||
| Hudson Pacific Properties, Inc. / EC (N/A) | 0,10 | 0,27 | 0,0856 | 0,0856 | |||||
| AES / The AES Corporation | 0,02 | 11,28 | 0,25 | -5,70 | 0,0780 | -0,0102 | |||
| LINE / Lineage, Inc. | 0,00 | 37,82 | 0,21 | 2,49 | 0,0647 | -0,0027 | |||
| HPP / Hudson Pacific Properties, Inc. | 0,06 | 0,16 | 0,0489 | 0,0489 | |||||
| PACS / PACS Group, Inc. | 0,01 | 31,91 | 0,13 | 51,72 | 0,0414 | 0,0123 |