Statistiques de base
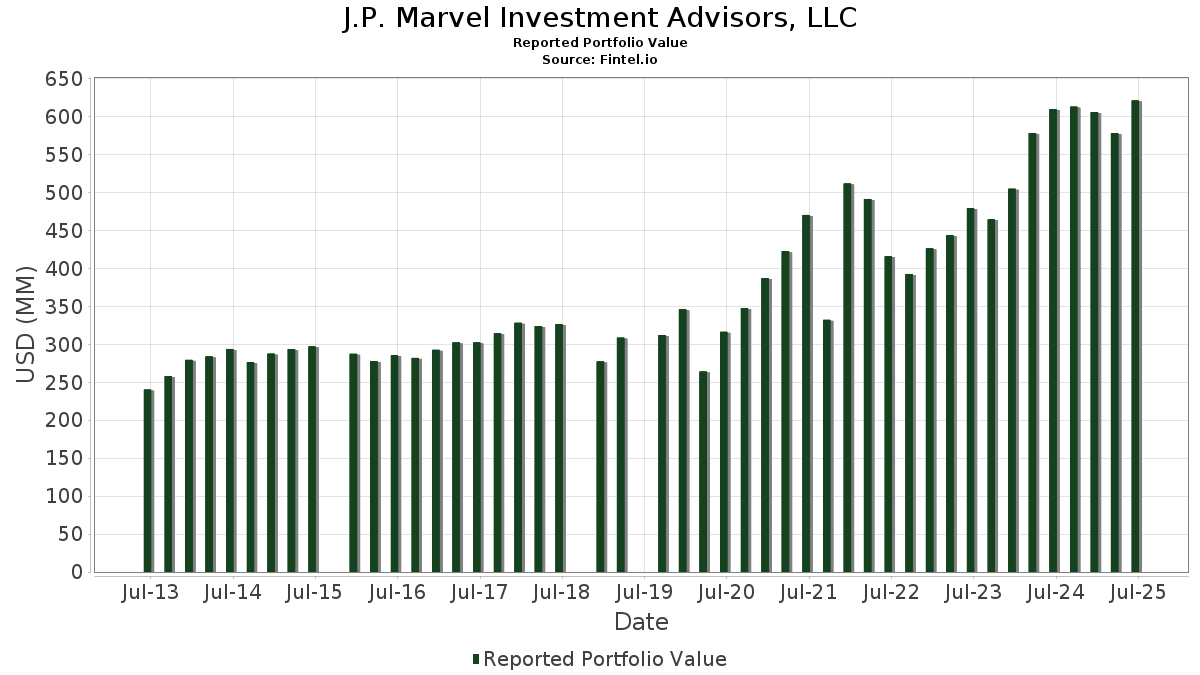
| Valeur du portefeuille | $ 621 024 252 |
| Positions actuelles | 64 |
Dernières positions, performances, ASG (à partir des dépôts 13F, 13D)
J.P. Marvel Investment Advisors, LLC a déclaré un total de 64 positions dans ses derniers dépôts auprès de la SEC. La valeur la plus récente du portefeuille est calculée à 621 024 252 USD. Les actifs sous gestion réels (ASG) sont cette valeur plus les liquidités (qui ne sont pas divulguées). Les principales positions de J.P. Marvel Investment Advisors, LLC sont NVIDIA Corporation (US:NVDA) , Eli Lilly and Company (US:LLY) , Apple Inc. (US:AAPL) , JPMorgan Chase & Co. (US:JPM) , and Alphabet Inc. (US:GOOGL) . Les nouvelles positions de J.P. Marvel Investment Advisors, LLC incluent QUALCOMM Incorporated (US:QCOM) , .
Meilleures augmentations ce trimestre
Nous utilisons la variation de l'allocation du portefeuille car il s'agit de l'indicateur le plus significatif. Les changements peuvent être dus à des transactions ou à des variations de prix des actions.
| Titre | Actions (en millions) |
Valeur ($ en millions) |
% du portefeuille | ΔPortefeuille % |
|---|---|---|---|---|
| 0,58 | 91,71 | 14,7674 | 3,8618 | |
| 0,04 | 21,65 | 3,4866 | 0,6584 | |
| 0,16 | 16,01 | 2,5787 | 0,5088 | |
| 0,11 | 32,04 | 5,1599 | 0,4912 | |
| 0,20 | 27,83 | 4,4814 | 0,4783 | |
| 0,01 | 9,09 | 1,4632 | 0,4705 | |
| 0,14 | 29,73 | 4,7867 | 0,3214 | |
| 0,18 | 31,24 | 5,0307 | 0,2738 | |
| 0,01 | 3,90 | 0,6278 | 0,2412 | |
| 0,03 | 8,06 | 1,2983 | 0,2135 |
Principales baisses ce trimestre
Nous utilisons la variation de l'allocation du portefeuille car il s'agit de l'indicateur le plus significatif. Les changements peuvent être dus à des transactions ou à des variations de prix des actions.
| Titre | Actions (en millions) |
Valeur ($ en millions) |
% du portefeuille | ΔPortefeuille % |
|---|---|---|---|---|
| 0,06 | 43,44 | 6,9948 | -1,0223 | |
| 0,19 | 38,06 | 6,1288 | -1,0079 | |
| 0,04 | 15,48 | 2,4928 | -0,8051 | |
| 0,08 | 15,77 | 2,5388 | -0,5421 | |
| 0,16 | 7,60 | 1,2241 | -0,5264 | |
| 0,07 | 10,24 | 1,6488 | -0,2745 | |
| 0,06 | 22,36 | 3,6002 | -0,2194 | |
| 0,07 | 8,46 | 1,3628 | -0,2092 | |
| 0,04 | 6,55 | 1,0551 | -0,1575 | |
| 0,05 | 6,28 | 1,0112 | -0,1432 |
Déclarations 13F et dépôts de fonds
Ce formulaire a été déposé le 2025-08-14 pour la période de déclaration 2025-06-30. Cliquez sur l'icône du lien pour voir l'historique complet des transactions.
Mettre à niveau pour débloquer les données premium et exporter vers Excel ![]() .
.
| Titre | Type | Prix moyen de l'action | Actions (en millions) |
ΔActions (%) |
ΔActions (%) |
Valeur ($ en millions) |
Portefeuille (%) |
ΔPortefeuille (%) |
|
|---|---|---|---|---|---|---|---|---|---|
| NVDA / NVIDIA Corporation | 0,58 | -0,20 | 91,71 | 45,49 | 14,7674 | 3,8618 | |||
| LLY / Eli Lilly and Company | 0,06 | -0,68 | 43,44 | -6,26 | 6,9948 | -1,0223 | |||
| AAPL / Apple Inc. | 0,19 | -0,11 | 38,06 | -7,73 | 6,1288 | -1,0079 | |||
| JPM / JPMorgan Chase & Co. | 0,11 | 0,47 | 32,04 | 18,75 | 5,1599 | 0,4912 | |||
| GOOGL / Alphabet Inc. | 0,18 | -0,29 | 31,24 | 13,63 | 5,0307 | 0,2738 | |||
| AMZN / Amazon.com, Inc. | 0,14 | -0,12 | 29,73 | 15,18 | 4,7867 | 0,3214 | |||
| MS / Morgan Stanley | 0,20 | -0,38 | 27,83 | 20,28 | 4,4814 | 0,4783 | |||
| V / Visa Inc. | 0,06 | -0,04 | 22,36 | 1,27 | 3,6002 | -0,2194 | |||
| MSFT / Microsoft Corporation | 0,04 | -0,04 | 21,65 | 32,45 | 3,4866 | 0,6584 | |||
| LRCX / Lam Research Corporation | 0,16 | -0,03 | 16,01 | 33,85 | 2,5787 | 0,5088 | |||
| ABBV / AbbVie Inc. | 0,08 | -0,06 | 15,77 | -11,46 | 2,5388 | -0,5421 | |||
| TMO / Thermo Fisher Scientific Inc. | 0,04 | -0,33 | 15,48 | -18,79 | 2,4928 | -0,8051 | |||
| DE / Deere & Company | 0,03 | 0,11 | 14,09 | 8,46 | 2,2689 | 0,0213 | |||
| GLW / Corning Incorporated | 0,26 | 1,42 | 13,90 | 16,50 | 2,2385 | 0,1741 | |||
| BAC / Bank of America Corporation | 0,29 | 0,00 | 13,83 | 13,40 | 2,2263 | 0,1169 | |||
| CSCO / Cisco Systems, Inc. | 0,19 | 2,48 | 13,25 | 15,21 | 2,1330 | 0,1439 | |||
| MMM / 3M Company | 0,07 | -0,23 | 10,64 | 3,42 | 1,7131 | -0,0665 | |||
| JNJ / Johnson & Johnson | 0,07 | 0,00 | 10,24 | -7,90 | 1,6488 | -0,2745 | |||
| ABT / Abbott Laboratories | 0,07 | 0,32 | 9,55 | 2,87 | 1,5372 | -0,0685 | |||
| SHW / The Sherwin-Williams Company | 0,03 | -0,15 | 9,30 | -1,82 | 1,4980 | -0,1412 | |||
| AXON / Axon Enterprise, Inc. | 0,01 | 0,61 | 9,09 | 58,38 | 1,4632 | 0,4705 | |||
| EOG / EOG Resources, Inc. | 0,07 | -0,13 | 8,46 | -6,86 | 1,3628 | -0,2092 | |||
| GE / General Electric Company | 0,03 | -0,01 | 8,06 | 28,60 | 1,2983 | 0,2135 | |||
| BMY / Bristol-Myers Squibb Company | 0,16 | -1,01 | 7,60 | -24,88 | 1,2241 | -0,5264 | |||
| IBM / International Business Machines Corporation | 0,02 | 1,70 | 6,81 | 20,57 | 1,0966 | 0,1194 | |||
| PG / The Procter & Gamble Company | 0,04 | 0,00 | 6,55 | -6,51 | 1,0551 | -0,1575 | |||
| AWK / American Water Works Company, Inc. | 0,05 | -0,20 | 6,28 | -5,89 | 1,0112 | -0,1432 | |||
| CRL / Charles River Laboratories International, Inc. | 0,04 | -0,99 | 5,62 | -0,20 | 0,9056 | -0,0693 | |||
| CLH / Clean Harbors, Inc. | 0,02 | -0,40 | 5,58 | 16,82 | 0,8992 | 0,0722 | |||
| DHR / Danaher Corporation | 0,03 | -0,18 | 5,57 | -3,82 | 0,8972 | -0,1049 | |||
| CARR / Carrier Global Corporation | 0,07 | -0,56 | 4,96 | 14,80 | 0,7984 | 0,0512 | |||
| MDT / Medtronic plc | 0,06 | -0,76 | 4,94 | -3,74 | 0,7948 | -0,0923 | |||
| KO / The Coca-Cola Company | 0,07 | 0,00 | 4,65 | -1,21 | 0,7485 | -0,0656 | |||
| CAT / Caterpillar Inc. | 0,01 | -0,65 | 4,53 | 16,96 | 0,7288 | 0,0592 | |||
| PYPL / PayPal Holdings, Inc. | 0,06 | -1,99 | 4,47 | 11,66 | 0,7203 | 0,0270 | |||
| XOM / Exxon Mobil Corporation | 0,04 | -0,24 | 4,45 | -9,57 | 0,7164 | -0,1348 | |||
| GEV / GE Vernova Inc. | 0,01 | 0,66 | 3,90 | 74,49 | 0,6278 | 0,2412 | |||
| VRTX / Vertex Pharmaceuticals Incorporated | 0,01 | -1,71 | 3,50 | -9,73 | 0,5631 | -0,1072 | |||
| MRK / Merck & Co., Inc. | 0,04 | 0,00 | 3,06 | -11,81 | 0,4929 | -0,1076 | |||
| HES / Hess Corporation | 0,02 | 0,00 | 2,86 | -13,24 | 0,4599 | -0,1098 | |||
| OTIS / Otis Worldwide Corporation | 0,03 | -6,17 | 2,50 | -9,96 | 0,4031 | -0,0780 | |||
| PFE / Pfizer Inc. | 0,09 | -2,61 | 2,30 | -6,86 | 0,3698 | -0,0567 | |||
| DELL / Dell Technologies Inc. | 0,02 | 69,03 | 2,24 | 127,51 | 0,3609 | 0,1904 | |||
| ALNY / Alnylam Pharmaceuticals, Inc. | 0,01 | 70,60 | 2,23 | 106,02 | 0,3583 | 0,1715 | |||
| SPY / SPDR S&P 500 ETF | 0,00 | 0,00 | 2,21 | 10,48 | 0,3564 | 0,0097 | |||
| TXN / Texas Instruments Incorporated | 0,01 | 0,00 | 2,11 | 15,56 | 0,3397 | 0,0238 | |||
| AVGO / Broadcom Inc. | 0,01 | 0,00 | 1,80 | 64,71 | 0,2894 | 0,1006 | |||
| CMCSA / Comcast Corporation | 0,05 | -1,46 | 1,73 | -4,68 | 0,2787 | -0,0355 | |||
| AEM / Agnico Eagle Mines Limited | 0,01 | 0,00 | 1,59 | 9,73 | 0,2560 | 0,0053 | |||
| MRNA / Moderna, Inc. | 0,05 | 6,53 | 1,35 | 3,69 | 0,2174 | -0,0079 | |||
| HSY / The Hershey Company | 0,01 | 0,00 | 1,33 | -3,00 | 0,2138 | -0,0229 | |||
| T / AT&T Inc. | 0,04 | 62,87 | 1,29 | 66,67 | 0,2078 | 0,0739 | |||
| GOOG / Alphabet Inc. | 0,01 | 0,00 | 1,16 | 13,57 | 0,1874 | 0,0101 | |||
| VLTO / Veralto Corporation | 0,01 | 0,00 | 0,95 | 3,60 | 0,1530 | -0,0057 | |||
| QCOM / QUALCOMM Incorporated | 0,01 | 0,91 | 0,1473 | 0,1473 | |||||
| GD / General Dynamics Corporation | 0,00 | 0,00 | 0,87 | 6,98 | 0,1409 | -0,0006 | |||
| SYY / Sysco Corporation | 0,01 | 0,00 | 0,72 | 0,99 | 0,1153 | -0,0074 | |||
| EPD / Enterprise Products Partners L.P. - Limited Partnership | 0,02 | 0,00 | 0,63 | -9,26 | 0,1011 | -0,0185 | |||
| VRT / Vertiv Holdings Co | 0,00 | 0,00 | 0,59 | 77,71 | 0,0951 | 0,0377 | |||
| IJH / iShares Trust - iShares Core S&P Mid-Cap ETF | 0,01 | 0,00 | 0,39 | 6,27 | 0,0629 | -0,0007 | |||
| MET / MetLife, Inc. | 0,00 | 0,00 | 0,32 | 0,00 | 0,0517 | -0,0038 | |||
| EFA / iShares Trust - iShares MSCI EAFE ETF | 0,00 | 0,00 | 0,27 | 9,60 | 0,0442 | 0,0008 | |||
| PEP / PepsiCo, Inc. | 0,00 | 0,00 | 0,25 | -12,15 | 0,0408 | -0,0090 | |||
| DUK / Duke Energy Corporation | 0,00 | 0,00 | 0,21 | -3,18 | 0,0344 | -0,0038 | |||
| INTC / Intel Corporation | 0,00 | -100,00 | 0,00 | -100,00 | -0,0708 | ||||
| CNC / Centene Corporation | 0,00 | -100,00 | 0,00 | 0,0000 | |||||
| SOLV / Solventum Corporation | 0,00 | -100,00 | 0,00 | 0,0000 | |||||
| AKAM / Akamai Technologies, Inc. | 0,00 | -100,00 | 0,00 | 0,0000 | |||||
| ITCI / Intra-Cellular Therapies, Inc. | 0,00 | -100,00 | 0,00 | 0,0000 | |||||
| DIS / The Walt Disney Company | 0,00 | -100,00 | 0,00 | 0,0000 |