Statistiques de base
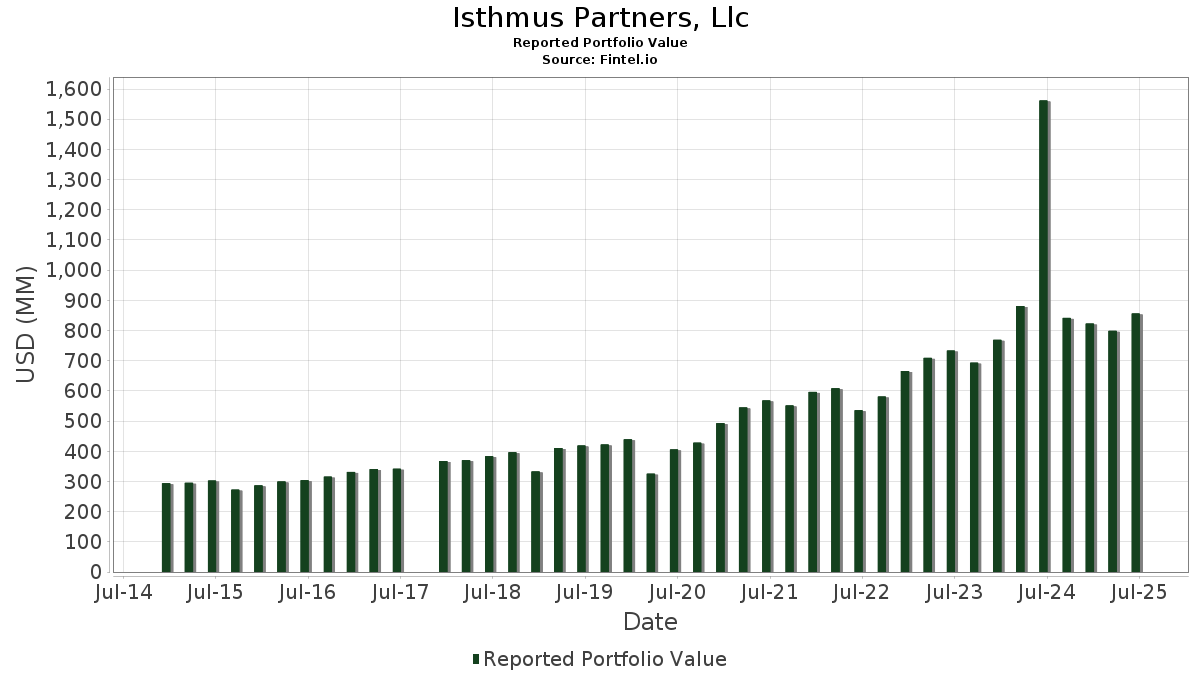
| Valeur du portefeuille | $ 856 083 601 |
| Positions actuelles | 217 |
Dernières positions, performances, ASG (à partir des dépôts 13F, 13D)
Isthmus Partners, Llc a déclaré un total de 217 positions dans ses derniers dépôts auprès de la SEC. La valeur la plus récente du portefeuille est calculée à 856 083 601 USD. Les actifs sous gestion réels (ASG) sont cette valeur plus les liquidités (qui ne sont pas divulguées). Les principales positions de Isthmus Partners, Llc sont Microsoft Corporation (US:MSFT) , Trane Technologies plc (US:TT) , Cencora, Inc. (US:COR) , Apple Inc. (US:AAPL) , and Amcor plc (US:AMCR) . Les nouvelles positions de Isthmus Partners, Llc incluent DexCom, Inc. (US:DXCM) , Apogee Enterprises, Inc. (US:APOG) , Capital One Financial Corporation (US:COF) , General Electric Company (US:GE) , and AirJoule Technologies Corporation (US:AIRJ) .
Meilleures augmentations ce trimestre
Nous utilisons la variation de l'allocation du portefeuille car il s'agit de l'indicateur le plus significatif. Les changements peuvent être dus à des transactions ou à des variations de prix des actions.
| Titre | Actions (en millions) |
Valeur ($ en millions) |
% du portefeuille | ΔPortefeuille % |
|---|---|---|---|---|
| 0,09 | 16,19 | 1,8913 | 1,8404 | |
| 0,17 | 14,61 | 1,7068 | 1,7068 | |
| 0,06 | 11,91 | 1,3908 | 1,3456 | |
| 0,06 | 17,53 | 2,0482 | 0,7094 | |
| 0,05 | 23,51 | 2,7457 | 0,6418 | |
| 0,07 | 13,54 | 1,5814 | 0,4636 | |
| 0,04 | 19,20 | 2,2431 | 0,3072 | |
| 0,25 | 5,55 | 0,6480 | 0,2962 | |
| 0,04 | 14,08 | 1,6444 | 0,2556 | |
| 0,03 | 14,03 | 1,6384 | 0,2540 |
Principales baisses ce trimestre
Nous utilisons la variation de l'allocation du portefeuille car il s'agit de l'indicateur le plus significatif. Les changements peuvent être dus à des transactions ou à des variations de prix des actions.
| Titre | Actions (en millions) |
Valeur ($ en millions) |
% du portefeuille | ΔPortefeuille % |
|---|---|---|---|---|
| 0,02 | 0,32 | 0,0378 | -1,2934 | |
| 0,04 | 12,15 | 1,4192 | -0,6444 | |
| 0,09 | 18,75 | 2,1898 | -0,3039 | |
| 0,27 | 9,12 | 1,0656 | -0,2935 | |
| 0,10 | 15,22 | 1,7776 | -0,2903 | |
| 2,00 | 18,41 | 2,1506 | -0,2821 | |
| 0,00 | 17,17 | 2,0060 | -0,2679 | |
| 0,30 | 11,14 | 1,3013 | -0,2654 | |
| 0,41 | 10,33 | 1,2061 | -0,2601 | |
| 0,14 | 13,58 | 1,5865 | -0,2314 |
Déclarations 13F et dépôts de fonds
Ce formulaire a été déposé le 2025-08-13 pour la période de déclaration 2025-06-30. Cliquez sur l'icône du lien pour voir l'historique complet des transactions.
Mettre à niveau pour débloquer les données premium et exporter vers Excel ![]() .
.
| Titre | Type | Prix moyen de l'action | Actions (en millions) |
ΔActions (%) |
ΔActions (%) |
Valeur ($ en millions) |
Portefeuille (%) |
ΔPortefeuille (%) |
|
|---|---|---|---|---|---|---|---|---|---|
| MSFT / Microsoft Corporation | 0,05 | 5,55 | 23,51 | 39,86 | 2,7457 | 0,6418 | |||
| TT / Trane Technologies plc | 0,04 | -4,35 | 19,20 | 24,18 | 2,2431 | 0,3072 | |||
| COR / Cencora, Inc. | 0,06 | -4,51 | 18,80 | 2,97 | 2,1959 | -0,0897 | |||
| AAPL / Apple Inc. | 0,09 | 1,89 | 18,75 | -5,89 | 2,1898 | -0,3039 | |||
| AMCR / Amcor plc | 2,00 | 0,00 | 18,41 | -5,26 | 2,1506 | -0,2821 | |||
| AVGO / Broadcom Inc. | 0,06 | -0,41 | 17,53 | 63,96 | 2,0482 | 0,7094 | |||
| AZO / AutoZone, Inc. | 0,00 | -2,90 | 17,17 | -5,46 | 2,0060 | -0,2679 | |||
| EBAY / eBay Inc. | 0,23 | -3,89 | 16,77 | 5,66 | 1,9589 | -0,0280 | |||
| GOOGL / Alphabet Inc. | 0,09 | 3 399,92 | 16,19 | 3 897,53 | 1,8913 | 1,8404 | |||
| WRB / W. R. Berkley Corporation | 0,21 | -4,72 | 15,71 | -1,63 | 1,8349 | -0,1641 | |||
| BK / The Bank of New York Mellon Corporation | 0,17 | -1,28 | 15,61 | 7,24 | 1,8229 | 0,0012 | |||
| JNJ / Johnson & Johnson | 0,10 | 0,02 | 15,22 | -7,88 | 1,7776 | -0,2903 | |||
| GWW / W.W. Grainger, Inc. | 0,01 | -0,03 | 15,04 | 5,27 | 1,7574 | -0,0317 | |||
| EMR / Emerson Electric Co. | 0,11 | -0,49 | 15,04 | 21,02 | 1,7564 | 0,2010 | |||
| PYPL / PayPal Holdings, Inc. | 0,20 | -3,32 | 14,87 | 10,13 | 1,7365 | 0,0466 | |||
| CBOE / Cboe Global Markets, Inc. | 0,06 | -0,43 | 14,74 | 2,62 | 1,7216 | -0,0763 | |||
| DXCM / DexCom, Inc. | 0,17 | 14,61 | 1,7068 | 1,7068 | |||||
| ALSN / Allison Transmission Holdings, Inc. | 0,15 | 0,55 | 14,58 | -0,17 | 1,7035 | -0,1252 | |||
| HCA / HCA Healthcare, Inc. | 0,04 | 0,64 | 14,15 | 11,58 | 1,6529 | 0,0653 | |||
| PNC / The PNC Financial Services Group, Inc. | 0,08 | 0,26 | 14,14 | 6,33 | 1,6516 | -0,0129 | |||
| ROK / Rockwell Automation, Inc. | 0,04 | -1,30 | 14,08 | 26,89 | 1,6444 | 0,2556 | |||
| ULTA / Ulta Beauty, Inc. | 0,03 | -0,63 | 14,03 | 26,83 | 1,6384 | 0,2540 | |||
| CHRW / C.H. Robinson Worldwide, Inc. | 0,14 | -0,19 | 13,58 | -6,47 | 1,5865 | -0,2314 | |||
| AMAT / Applied Materials, Inc. | 0,07 | 20,18 | 13,54 | 51,62 | 1,5814 | 0,4636 | |||
| FITB / Fifth Third Bancorp | 0,32 | -0,17 | 13,00 | 4,75 | 1,5183 | -0,0351 | |||
| ZBRA / Zebra Technologies Corporation | 0,04 | 2,78 | 13,00 | 12,16 | 1,5180 | 0,0676 | |||
| IT / Gartner, Inc. | 0,03 | 0,90 | 12,73 | -2,84 | 1,4873 | -0,1531 | |||
| UPS / United Parcel Service, Inc. | 0,13 | 24,24 | 12,62 | 14,01 | 1,4742 | 0,0885 | |||
| CL / Colgate-Palmolive Company | 0,14 | 0,22 | 12,49 | -2,77 | 1,4591 | -0,1491 | |||
| PSA / Public Storage | 0,04 | -0,04 | 12,31 | -2,00 | 1,4376 | -0,1344 | |||
| SYY / Sysco Corporation | 0,16 | 0,85 | 12,20 | 1,79 | 1,4254 | -0,0753 | |||
| MCD / McDonald's Corporation | 0,04 | -21,20 | 12,15 | -26,30 | 1,4192 | -0,6444 | |||
| HSY / The Hershey Company | 0,07 | 0,88 | 12,09 | -2,12 | 1,4120 | -0,1340 | |||
| ABBV / AbbVie Inc. | 0,06 | 3 618,55 | 11,91 | 3 198,06 | 1,3908 | 1,3456 | |||
| FLS / Flowserve Corporation | 0,23 | -0,09 | 11,84 | 7,09 | 1,3832 | -0,0010 | |||
| LMT / Lockheed Martin Corporation | 0,02 | 1,33 | 11,50 | 5,06 | 1,3430 | -0,0269 | |||
| LKQ / LKQ Corporation | 0,30 | 2,32 | 11,14 | -10,99 | 1,3013 | -0,2654 | |||
| ZTS / Zoetis Inc. | 0,07 | 0,48 | 10,98 | -4,83 | 1,2825 | -0,1616 | |||
| LOW / Lowe's Companies, Inc. | 0,05 | 0,61 | 10,79 | -4,29 | 1,2600 | -0,1509 | |||
| ACN / Accenture plc | 0,03 | 1,06 | 10,34 | -3,20 | 1,2079 | -0,1294 | |||
| CTRA / Coterra Energy Inc. | 0,41 | 0,38 | 10,33 | -11,84 | 1,2061 | -0,2601 | |||
| BAH / Booz Allen Hamilton Holding Corporation | 0,09 | 1,44 | 9,86 | 1,00 | 1,1514 | -0,0703 | |||
| SLB / Schlumberger Limited | 0,27 | 3,91 | 9,12 | -15,97 | 1,0656 | -0,2935 | |||
| SPTM / SPDR Series Trust - SPDR Portfolio S&P 1500 Composite Stock Market ETF | 0,08 | 4,36 | 6,21 | 14,93 | 0,7259 | 0,0490 | |||
| PCAR / PACCAR Inc | 0,06 | 0,06 | 6,06 | -2,31 | 0,7078 | -0,0687 | |||
| INTC / Intel Corporation | 0,25 | 100,11 | 5,55 | 97,40 | 0,6480 | 0,2962 | |||
| CRK / Comstock Resources, Inc. | 0,19 | -18,05 | 5,23 | 11,50 | 0,6104 | 0,0237 | |||
| FTDR / Frontdoor, Inc. | 0,08 | -5,92 | 4,99 | 44,32 | 0,5832 | 0,1501 | |||
| CNM / Core & Main, Inc. | 0,08 | -0,53 | 4,96 | 24,26 | 0,5792 | 0,0797 | |||
| LMB / Limbach Holdings, Inc. | 0,03 | -22,83 | 4,81 | 45,21 | 0,5617 | 0,1470 | |||
| BELFB / Bel Fuse Inc. | 0,05 | -0,01 | 4,63 | 30,49 | 0,5404 | 0,0966 | |||
| LGND / Ligand Pharmaceuticals Incorporated | 0,04 | -1,07 | 4,24 | 6,97 | 0,4950 | -0,0009 | |||
| MLI / Mueller Industries, Inc. | 0,05 | -4,15 | 4,19 | 0,05 | 0,4900 | -0,0349 | |||
| AEIS / Advanced Energy Industries, Inc. | 0,03 | 0,17 | 3,92 | 39,26 | 0,4584 | 0,1056 | |||
| TILE / Interface, Inc. | 0,19 | -1,14 | 3,88 | 4,28 | 0,4529 | -0,0125 | |||
| GMS / GMS Inc. | 0,04 | -0,54 | 3,86 | 47,82 | 0,4514 | 0,1241 | |||
| TTEK / Tetra Tech, Inc. | 0,11 | 0,05 | 3,85 | 23,03 | 0,4494 | 0,0579 | |||
| CRAI / CRA International, Inc. | 0,02 | -0,67 | 3,84 | 7,44 | 0,4489 | 0,0012 | |||
| PLXS / Plexus Corp. | 0,03 | 0,62 | 3,73 | 6,26 | 0,4361 | -0,0037 | |||
| PZZA / Papa John's International, Inc. | 0,07 | 0,36 | 3,65 | 19,59 | 0,4264 | 0,0442 | |||
| KFY / Korn Ferry | 0,05 | 0,10 | 3,63 | 8,22 | 0,4244 | 0,0041 | |||
| SFM / Sprouts Farmers Market, Inc. | 0,02 | 0,10 | 3,63 | 7,97 | 0,4240 | 0,0032 | |||
| IIIN / Insteel Industries, Inc. | 0,09 | -0,07 | 3,53 | 41,40 | 0,4119 | 0,0997 | |||
| NSSC / Napco Security Technologies, Inc. | 0,12 | 14,31 | 3,47 | 47,45 | 0,4059 | 0,1109 | |||
| SRCE / 1st Source Corporation | 0,06 | 0,83 | 3,45 | 4,64 | 0,4027 | -0,0097 | |||
| HCKT / The Hackett Group, Inc. | 0,14 | 0,28 | 3,44 | -12,75 | 0,4020 | -0,0918 | |||
| IRMD / IRADIMED CORPORATION | 0,06 | -0,79 | 3,43 | 13,02 | 0,4005 | 0,0208 | |||
| AMAL / Amalgamated Financial Corp. | 0,11 | 0,18 | 3,42 | 8,70 | 0,3999 | 0,0057 | |||
| DFIN / Donnelley Financial Solutions, Inc. | 0,05 | 65,19 | 3,39 | 133,08 | 0,3960 | 0,2138 | |||
| RLI / RLI Corp. | 0,05 | 0,47 | 3,38 | -9,68 | 0,3948 | -0,0736 | |||
| HAE / Haemonetics Corporation | 0,05 | 6,43 | 3,37 | 24,98 | 0,3939 | 0,0561 | |||
| CCBG / Capital City Bank Group, Inc. | 0,09 | -0,75 | 3,35 | 8,63 | 0,3913 | 0,0052 | |||
| NVEC / NVE Corporation | 0,04 | 0,56 | 3,23 | 16,17 | 0,3767 | 0,0291 | |||
| APAM / Artisan Partners Asset Management Inc. | 0,07 | 0,66 | 3,10 | 14,13 | 0,3624 | 0,0221 | |||
| EIG / Employers Holdings, Inc. | 0,06 | 0,26 | 3,03 | -6,59 | 0,3543 | -0,0522 | |||
| GSL / Global Ship Lease, Inc. | 0,11 | 0,31 | 3,00 | 15,49 | 0,3503 | 0,0253 | |||
| NGVT / Ingevity Corporation | 0,07 | 1,46 | 2,98 | 10,45 | 0,3481 | 0,0103 | |||
| CXT / Crane NXT, Co. | 0,05 | 89,29 | 2,94 | 98,58 | 0,3431 | 0,1579 | |||
| ALEX / Alexander & Baldwin, Inc. | 0,16 | 0,32 | 2,94 | 3,82 | 0,3430 | -0,0111 | |||
| AMSF / AMERISAFE, Inc. | 0,07 | 1,68 | 2,87 | -15,39 | 0,3347 | -0,0892 | |||
| BLFS / BioLife Solutions, Inc. | 0,13 | 0,39 | 2,85 | -5,36 | 0,3324 | -0,0439 | |||
| OPCH / Option Care Health, Inc. | 0,09 | 86,78 | 2,82 | 73,66 | 0,3288 | 0,1258 | |||
| APLE / Apple Hospitality REIT, Inc. | 0,23 | 14,26 | 2,68 | 3,28 | 0,3128 | -0,0118 | |||
| ISSC / Innovative Solutions and Support, Inc. | 0,19 | -0,25 | 2,66 | 120,30 | 0,3106 | 0,1594 | |||
| JBI / Janus International Group, Inc. | 0,32 | 24,44 | 2,64 | 40,68 | 0,3079 | 0,0733 | |||
| SHYF / The Shyft Group, Inc. | 0,20 | -0,26 | 2,53 | 54,65 | 0,2952 | 0,0906 | |||
| INDB / Independent Bank Corp. | 0,04 | 0,81 | 2,41 | 1,18 | 0,2813 | -0,0166 | |||
| MDXG / MiMedx Group, Inc. | 0,39 | 26,18 | 2,39 | 1,44 | 0,2794 | -0,0158 | |||
| ACLS / Axcelis Technologies, Inc. | 0,03 | 8,05 | 2,38 | 51,66 | 0,2781 | 0,0815 | |||
| ASO / Academy Sports and Outdoors, Inc. | 0,05 | 1,93 | 2,35 | 0,13 | 0,2749 | -0,0193 | |||
| AVNT / Avient Corporation | 0,07 | 3,77 | 2,21 | -9,77 | 0,2579 | -0,0484 | |||
| REYN / Reynolds Consumer Products Inc. | 0,09 | 2,81 | 1,98 | -7,72 | 0,2318 | -0,0374 | |||
| HY / Hyster-Yale, Inc. | 0,05 | 3,18 | 1,96 | -1,21 | 0,2286 | -0,0193 | |||
| NOG / Northern Oil and Gas, Inc. | 0,07 | 37,45 | 1,93 | 28,94 | 0,2249 | 0,0379 | |||
| UTMD / Utah Medical Products, Inc. | 0,03 | 2,65 | 1,92 | 4,23 | 0,2247 | -0,0063 | |||
| MLR / Miller Industries, Inc. | 0,04 | 0,46 | 1,91 | 5,40 | 0,2236 | -0,0037 | |||
| CAT / Caterpillar Inc. | 0,00 | 212,01 | 1,89 | 267,45 | 0,2203 | 0,1560 | |||
| OII / Oceaneering International, Inc. | 0,09 | 1,52 | 1,86 | -3,53 | 0,2174 | -0,0242 | |||
| GLD / SPDR Gold Trust | 0,01 | 0,00 | 1,83 | 5,79 | 0,2136 | -0,0028 | |||
| ATKR / Atkore Inc. | 0,02 | 5,42 | 1,74 | 24,04 | 0,2031 | 0,0275 | |||
| MTX / Minerals Technologies Inc. | 0,03 | 52,69 | 1,69 | 32,21 | 0,1976 | 0,0375 | |||
| OEC / Orion S.A. | 0,16 | 7,31 | 1,64 | -12,93 | 0,1919 | -0,0443 | |||
| PG / The Procter & Gamble Company | 0,01 | 3,64 | 1,64 | -3,08 | 0,1911 | -0,0203 | |||
| MGPI / MGP Ingredients, Inc. | 0,05 | 8,21 | 1,50 | 10,41 | 0,1747 | 0,0051 | |||
| APOG / Apogee Enterprises, Inc. | 0,04 | 1,47 | 0,1718 | 0,1718 | |||||
| BFLY / Butterfly Network, Inc. | 0,69 | 0,00 | 1,38 | -12,29 | 0,1610 | -0,0357 | |||
| META / Meta Platforms, Inc. | 0,00 | 0,00 | 1,37 | 28,13 | 0,1602 | 0,0261 | |||
| CMCO / Columbus McKinnon Corporation | 0,09 | 14,64 | 1,33 | 3,41 | 0,1558 | -0,0057 | |||
| EMBC / Embecta Corp. | 0,12 | 3,91 | 1,12 | -21,08 | 0,1313 | -0,0469 | |||
| SPY / SPDR S&P 500 ETF | 0,00 | 19,68 | 1,12 | 32,27 | 0,1308 | 0,0248 | |||
| DCGO / DocGo Inc. | 0,68 | 6,86 | 1,07 | -36,44 | 0,1251 | -0,0859 | |||
| CSL / Carlisle Companies Incorporated | 0,00 | 0,00 | 1,04 | 9,63 | 0,1211 | 0,0028 | |||
| MRK / Merck & Co., Inc. | 0,01 | 1,03 | 0,1207 | 0,1207 | |||||
| OABI / OmniAb, Inc. | 0,57 | 21,19 | 0,99 | -12,10 | 0,1155 | -0,0254 | |||
| XOM / Exxon Mobil Corporation | 0,01 | 4,67 | 0,96 | -5,13 | 0,1123 | -0,0146 | |||
| GIC / Global Industrial Company | 0,04 | -59,43 | 0,95 | -51,09 | 0,1106 | -0,1317 | |||
| EVR / Evercore Inc. | 0,00 | -0,72 | 0,94 | 34,15 | 0,1093 | 0,0220 | |||
| NMIH / NMI Holdings, Inc. | 0,02 | 0,00 | 0,93 | 17,02 | 0,1084 | 0,0091 | |||
| HLI / Houlihan Lokey, Inc. | 0,01 | 0,00 | 0,91 | 11,46 | 0,1068 | 0,0041 | |||
| UNP / Union Pacific Corporation | 0,00 | -0,44 | 0,89 | -3,07 | 0,1035 | -0,0109 | |||
| JPM / JPMorgan Chase & Co. | 0,00 | 24,66 | 0,87 | 47,47 | 0,1020 | 0,0278 | |||
| FAST / Fastenal Company | 0,02 | 97,74 | 0,85 | 7,09 | 0,0989 | -0,0001 | |||
| BRK.B / Berkshire Hathaway Inc. | 0,00 | 10,05 | 0,82 | 0,49 | 0,0957 | -0,0065 | |||
| OTCM / OTC Markets Group Inc. | 0,01 | 0,04 | 0,80 | 20,21 | 0,0939 | 0,0102 | |||
| IBM / International Business Machines Corporation | 0,00 | 57,19 | 0,75 | 86,35 | 0,0877 | 0,0373 | |||
| AIT / Applied Industrial Technologies, Inc. | 0,00 | 0,00 | 0,74 | 3,05 | 0,0869 | -0,0034 | |||
| HSIC / Henry Schein, Inc. | 0,01 | 0,46 | 0,73 | 7,15 | 0,0857 | -0,0000 | |||
| BJ / BJ's Wholesale Club Holdings, Inc. | 0,01 | 0,00 | 0,73 | -5,47 | 0,0848 | -0,0114 | |||
| MCK / McKesson Corporation | 0,00 | 0,00 | 0,70 | 8,92 | 0,0813 | 0,0013 | |||
| AMZN / Amazon.com, Inc. | 0,00 | 30,64 | 0,69 | 50,76 | 0,0809 | 0,0233 | |||
| FCFS / FirstCash Holdings, Inc. | 0,01 | 0,00 | 0,68 | 12,34 | 0,0799 | 0,0037 | |||
| EXAS / Exact Sciences Corporation | 0,01 | 0,00 | 0,65 | 22,68 | 0,0759 | 0,0096 | |||
| NVT / nVent Electric plc | 0,01 | 0,00 | 0,64 | 39,82 | 0,0747 | 0,0174 | |||
| IAU / iShares Gold Trust | 0,01 | 0,00 | 0,59 | 5,70 | 0,0693 | -0,0009 | |||
| ETN / Eaton Corporation plc | 0,00 | 0,00 | 0,59 | 31,39 | 0,0686 | 0,0126 | |||
| ADP / Automatic Data Processing, Inc. | 0,00 | 0,00 | 0,59 | 1,04 | 0,0683 | -0,0042 | |||
| USB / U.S. Bancorp | 0,01 | -6,73 | 0,57 | 0,00 | 0,0668 | -0,0048 | |||
| G / Genpact Limited | 0,01 | 0,00 | 0,54 | -12,64 | 0,0630 | -0,0143 | |||
| SANM / Sanmina Corporation | 0,01 | 0,00 | 0,53 | 28,37 | 0,0625 | 0,0103 | |||
| NSIT / Insight Enterprises, Inc. | 0,00 | 0,00 | 0,52 | -7,95 | 0,0610 | -0,0100 | |||
| FHN / First Horizon Corporation | 0,02 | 0,00 | 0,51 | 9,29 | 0,0592 | 0,0011 | |||
| FIS / Fidelity National Information Services, Inc. | 0,01 | 104,86 | 0,50 | 123,66 | 0,0585 | 0,0304 | |||
| SLV / iShares Silver Trust | 0,01 | 0,00 | 0,49 | 5,86 | 0,0571 | -0,0007 | |||
| TMO / Thermo Fisher Scientific Inc. | 0,00 | 0,00 | 0,47 | -18,56 | 0,0554 | -0,0175 | |||
| TNC / Tennant Company | 0,01 | 0,00 | 0,46 | -2,93 | 0,0543 | -0,0056 | |||
| NEE / NextEra Energy, Inc. | 0,01 | -3,00 | 0,45 | -4,87 | 0,0525 | -0,0067 | |||
| LRN / Stride, Inc. | 0,00 | 0,00 | 0,43 | 14,81 | 0,0508 | 0,0034 | |||
| AGCO / AGCO Corporation | 0,00 | 0,00 | 0,43 | 11,49 | 0,0499 | 0,0019 | |||
| PPLT / abrdn Platinum ETF Trust - abrdn Physical Platinum Shares ETF | 0,00 | 0,00 | 0,43 | 34,38 | 0,0499 | 0,0101 | |||
| CBSH / Commerce Bancshares, Inc. | 0,01 | 0,00 | 0,43 | -0,23 | 0,0497 | -0,0036 | |||
| RHI / Robert Half Inc. | 0,01 | 0,66 | 0,42 | -24,23 | 0,0487 | -0,0202 | |||
| DOX / Amdocs Limited | 0,00 | 0,00 | 0,41 | -0,48 | 0,0484 | -0,0036 | |||
| TWST / Twist Bioscience Corporation | 0,01 | 0,00 | 0,41 | -6,18 | 0,0479 | -0,0069 | |||
| WCC / WESCO International, Inc. | 0,00 | 0,00 | 0,41 | 19,12 | 0,0474 | 0,0048 | |||
| CPER / United States Commodity Index Funds Trust - United States Copper Index Fund | 0,01 | 0,00 | 0,40 | 0,00 | 0,0473 | -0,0033 | |||
| AYI / Acuity Inc. | 0,00 | -2,17 | 0,40 | 10,74 | 0,0470 | 0,0016 | |||
| WWD / Woodward, Inc. | 0,00 | 0,00 | 0,40 | 34,58 | 0,0464 | 0,0094 | |||
| HDSN / Hudson Technologies, Inc. | 0,05 | 60,17 | 0,39 | 111,29 | 0,0460 | 0,0226 | |||
| ARW / Arrow Electronics, Inc. | 0,00 | 0,00 | 0,39 | 22,81 | 0,0460 | 0,0058 | |||
| FCN / FTI Consulting, Inc. | 0,00 | 0,83 | 0,39 | -0,76 | 0,0457 | -0,0036 | |||
| SNA / Snap-on Incorporated | 0,00 | 0,00 | 0,38 | -7,71 | 0,0448 | -0,0072 | |||
| AVY / Avery Dennison Corporation | 0,00 | 0,38 | 0,0446 | 0,0446 | |||||
| ECL / Ecolab Inc. | 0,00 | 0,00 | 0,37 | 6,32 | 0,0433 | -0,0004 | |||
| MKL / Markel Group Inc. | 0,00 | -4,66 | 0,37 | 1,94 | 0,0429 | -0,0022 | |||
| MTN / Vail Resorts, Inc. | 0,00 | 0,00 | 0,37 | -1,88 | 0,0428 | -0,0039 | |||
| JAZZ / Jazz Pharmaceuticals plc | 0,00 | 0,00 | 0,36 | -14,62 | 0,0424 | -0,0107 | |||
| VVV / Valvoline Inc. | 0,01 | 0,00 | 0,36 | 8,73 | 0,0422 | 0,0006 | |||
| CMC / Commercial Metals Company | 0,01 | 0,00 | 0,36 | 6,49 | 0,0422 | -0,0003 | |||
| HALO / Halozyme Therapeutics, Inc. | 0,01 | 0,00 | 0,36 | -18,49 | 0,0418 | -0,0131 | |||
| FIVE / Five Below, Inc. | 0,00 | 0,00 | 0,35 | 75,00 | 0,0410 | 0,0159 | |||
| CROX / Crocs, Inc. | 0,00 | 0,00 | 0,35 | -4,43 | 0,0403 | -0,0050 | |||
| CVX / Chevron Corporation | 0,00 | 3,76 | 0,34 | -11,14 | 0,0401 | -0,0083 | |||
| SHELL PLC F SPONSORED ADR 1 ADR REPS 2 ORD SHS / SPONSORED ADR (780LVT011) | 0,00 | 0,33 | 0,0000 | ||||||
| MELI / MercadoLibre, Inc. | 0,00 | 0,00 | 0,33 | 34,01 | 0,0388 | 0,0078 | |||
| WMS / Advanced Drainage Systems, Inc. | 0,00 | 0,00 | 0,33 | 5,77 | 0,0386 | -0,0005 | |||
| ABT / Abbott Laboratories | 0,00 | -33,15 | 0,33 | -31,46 | 0,0384 | -0,0217 | |||
| ITW / Illinois Tool Works Inc. | 0,00 | 0,32 | 0,0378 | 0,0378 | |||||
| DOC / Healthpeak Properties, Inc. | 0,02 | -96,49 | 0,32 | -96,96 | 0,0378 | -1,2934 | |||
| CBT / Cabot Corporation | 0,00 | 0,00 | 0,32 | -9,89 | 0,0373 | -0,0070 | |||
| NDSN / Nordson Corporation | 0,00 | 0,96 | 0,32 | 7,12 | 0,0370 | 0,0000 | |||
| URI / United Rentals, Inc. | 0,00 | 0,00 | 0,32 | 20,15 | 0,0370 | 0,0040 | |||
| TSM / Taiwan Semiconductor Manufacturing Company Limited - Depositary Receipt (Common Stock) | 0,00 | 0,00 | 0,31 | 36,52 | 0,0368 | 0,0079 | |||
| DCI / Donaldson Company, Inc. | 0,00 | 0,00 | 0,31 | 3,34 | 0,0362 | -0,0013 | |||
| SPGI / S&P Global Inc. | 0,00 | 0,00 | 0,31 | 3,73 | 0,0358 | -0,0012 | |||
| WEC / WEC Energy Group, Inc. | 0,00 | 0,00 | 0,31 | -4,39 | 0,0357 | -0,0043 | |||
| IPG / The Interpublic Group of Companies, Inc. | 0,01 | 0,00 | 0,31 | -9,76 | 0,0356 | -0,0067 | |||
| WEX / WEX Inc. | 0,00 | 1,31 | 0,30 | -5,14 | 0,0345 | -0,0045 | |||
| WTM / White Mountains Insurance Group, Ltd. | 0,00 | 0,00 | 0,29 | -6,67 | 0,0344 | -0,0051 | |||
| MDY / SPDR S&P MidCap 400 ETF Trust | 0,00 | 11,40 | 0,29 | 18,15 | 0,0343 | 0,0032 | |||
| BA / The Boeing Company | 0,00 | 0,28 | 0,0332 | 0,0332 | |||||
| ORLY / O'Reilly Automotive, Inc. | 0,00 | 1 400,00 | 0,28 | -5,67 | 0,0332 | -0,0045 | |||
| MATV / Mativ Holdings, Inc. | 0,04 | -0,53 | 0,28 | 9,13 | 0,0321 | 0,0005 | |||
| COF / Capital One Financial Corporation | 0,00 | 0,27 | 0,0319 | 0,0319 | |||||
| FERG / Ferguson Enterprises Inc. | 0,00 | 0,27 | 0,0317 | 0,0317 | |||||
| IWB / iShares Trust - iShares Russell 1000 ETF | 0,00 | 0,00 | 0,27 | 10,70 | 0,0315 | 0,0010 | |||
| REXR / Rexford Industrial Realty, Inc. | 0,01 | 2,00 | 0,27 | -7,27 | 0,0314 | -0,0049 | |||
| COST / Costco Wholesale Corporation | 0,00 | 0,38 | 0,26 | 5,20 | 0,0308 | -0,0006 | |||
| EXPO / Exponent, Inc. | 0,00 | 0,00 | 0,25 | -7,66 | 0,0296 | -0,0048 | |||
| NVDA / NVIDIA Corporation | 0,00 | 0,25 | 0,0294 | 0,0294 | |||||
| COP / ConocoPhillips | 0,00 | 0,25 | 0,0293 | 0,0293 | |||||
| TDG / TransDigm Group Incorporated | 0,00 | 0,00 | 0,25 | 10,18 | 0,0291 | 0,0007 | |||
| VIG / Vanguard Specialized Funds - Vanguard Dividend Appreciation ETF | 0,00 | 0,00 | 0,25 | 5,56 | 0,0290 | -0,0005 | |||
| FI / Fiserv, Inc. | 0,00 | -9,63 | 0,24 | -29,65 | 0,0284 | -0,0147 | |||
| CARR / Carrier Global Corporation | 0,00 | 0,24 | 0,0276 | 0,0276 | |||||
| NOC / Northrop Grumman Corporation | 0,00 | 0,00 | 0,23 | -2,52 | 0,0272 | -0,0026 | |||
| NDAQ / Nasdaq, Inc. | 0,00 | 0,23 | 0,0266 | 0,0266 | |||||
| HYPR / Hyperfine, Inc. | 0,31 | 0,00 | 0,23 | 0,45 | 0,0263 | -0,0018 | |||
| OVV / Ovintiv Inc. | 0,01 | 0,00 | 0,22 | -11,16 | 0,0261 | -0,0054 | |||
| ICE / Intercontinental Exchange, Inc. | 0,00 | 0,00 | 0,22 | 6,28 | 0,0257 | -0,0002 | |||
| MGY / Magnolia Oil & Gas Corporation | 0,01 | 0,00 | 0,21 | -10,88 | 0,0249 | -0,0051 | |||
| GE / General Electric Company | 0,00 | 0,21 | 0,0245 | 0,0245 | |||||
| WMT / Walmart Inc. | 0,00 | 0,20 | 0,0239 | 0,0239 | |||||
| KMB / Kimberly-Clark Corporation | 0,00 | -84,29 | 0,20 | -85,78 | 0,0239 | -0,1558 | |||
| DIS / The Walt Disney Company | 0,00 | 0,20 | 0,0238 | 0,0238 | |||||
| TMC / TMC the metals company Inc. | 0,02 | 0,00 | 0,15 | 282,05 | 0,0175 | 0,0126 | |||
| CLB / Core Laboratories Inc. | 0,01 | 3,70 | 0,14 | -20,47 | 0,0160 | -0,0055 | |||
| AIRJ / AirJoule Technologies Corporation | 0,02 | 0,08 | 0,0092 | 0,0092 | |||||
| MCFT / MasterCraft Boat Holdings, Inc. | 0,00 | -100,00 | 0,00 | 0,0000 | |||||
| VREX / Varex Imaging Corporation | 0,00 | -100,00 | 0,00 | 0,0000 | |||||
| MTW / The Manitowoc Company, Inc. | 0,00 | -100,00 | 0,00 | 0,0000 | |||||
| VOO / Vanguard Index Funds - Vanguard S&P 500 ETF | 0,00 | -100,00 | 0,00 | 0,0000 | |||||
| ORI / Old Republic International Corporation | 0,00 | -100,00 | 0,00 | 0,0000 | |||||
| DGX / Quest Diagnostics Incorporated | 0,00 | -100,00 | 0,00 | 0,0000 | |||||
| MGEE / MGE Energy, Inc. | 0,00 | -100,00 | 0,00 | 0,0000 | |||||
| KVUE / Kenvue Inc. | 0,00 | -100,00 | 0,00 | 0,0000 | |||||
| AMN / AMN Healthcare Services, Inc. | 0,00 | -100,00 | 0,00 | 0,0000 | |||||
| IVV / iShares Trust - iShares Core S&P 500 ETF | 0,00 | -100,00 | 0,00 | 0,0000 | |||||
| SHEL / Shell plc - Depositary Receipt (Common Stock) | 0,00 | -100,00 | 0,00 | 0,0000 |