Statistiques de base
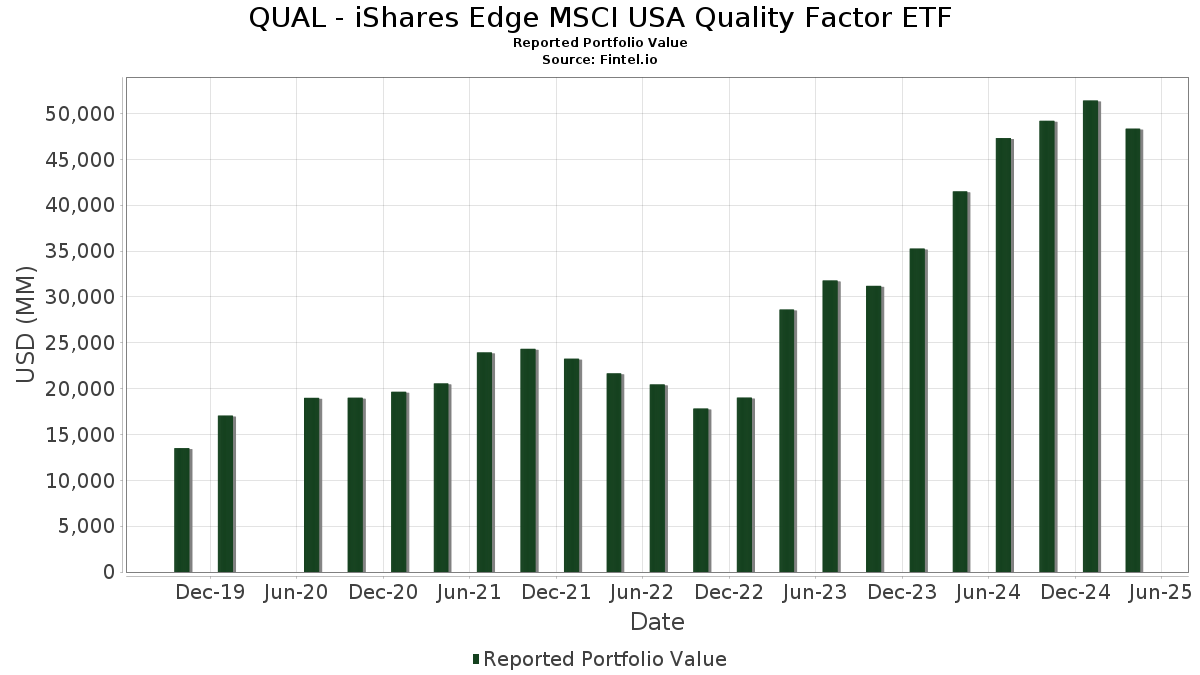
| Valeur du portefeuille | $ 48 337 348 128 |
| Positions actuelles | 127 |
Dernières positions, performances, ASG (à partir des dépôts 13F, 13D)
QUAL - iShares Edge MSCI USA Quality Factor ETF a déclaré un total de 127 positions dans ses derniers dépôts auprès de la SEC. La valeur la plus récente du portefeuille est calculée à 48 337 348 128 USD. Les actifs sous gestion réels (ASG) sont cette valeur plus les liquidités (qui ne sont pas divulguées). Les principales positions de QUAL - iShares Edge MSCI USA Quality Factor ETF sont Apple Inc. (US:AAPL) , Microsoft Corporation (US:MSFT) , Visa Inc. (US:V) , NVIDIA Corporation (US:NVDA) , and Mastercard Incorporated (US:MA) .
Meilleures augmentations ce trimestre
Nous utilisons la variation de l'allocation du portefeuille car il s'agit de l'indicateur le plus significatif. Les changements peuvent être dus à des transactions ou à des variations de prix des actions.
| Titre | Actions (en millions) |
Valeur ($ en millions) |
% du portefeuille | ΔPortefeuille % |
|---|---|---|---|---|
| 2,09 | 1 878,18 | 3,9003 | 0,6550 | |
| 7,68 | 2 652,96 | 5,5093 | 0,5650 | |
| 1,07 | 1 212,52 | 2,5180 | 0,5138 | |
| 210,04 | 210,12 | 0,4363 | 0,3083 | |
| 9,41 | 1 211,36 | 2,5156 | 0,2658 | |
| 8,52 | 618,27 | 1,2839 | 0,2479 | |
| 4,23 | 2 317,13 | 4,8119 | 0,2164 | |
| 7,38 | 2 917,07 | 6,0577 | 0,1913 | |
| 1,00 | 994,25 | 2,0647 | 0,1886 | |
| 5,38 | 840,78 | 1,7460 | 0,1787 |
Principales baisses ce trimestre
Nous utilisons la variation de l'allocation du portefeuille car il s'agit de l'indicateur le plus significatif. Les changements peuvent être dus à des transactions ou à des variations de prix des actions.
| Titre | Actions (en millions) |
Valeur ($ en millions) |
% du portefeuille | ΔPortefeuille % |
|---|---|---|---|---|
| 3,16 | 1 733,70 | 3,6003 | -0,5678 | |
| 2,09 | 859,71 | 1,7853 | -0,3855 | |
| 11,42 | 643,92 | 1,3372 | -0,3442 | |
| 5,49 | 871,55 | 1,8099 | -0,3345 | |
| 2,62 | 782,55 | 1,6251 | -0,3035 | |
| 1,26 | 340,20 | 0,7065 | -0,2902 | |
| 4,71 | 757,56 | 1,5732 | -0,2808 | |
| 4,35 | 357,50 | 0,7424 | -0,2164 | |
| 1,76 | 195,27 | 0,4055 | -0,1927 | |
| 13,94 | 2 962,12 | 6,1513 | -0,1489 |
Déclarations 13F et dépôts de fonds
Ce formulaire a été déposé le 2025-06-23 pour la période de déclaration 2025-04-30. Cliquez sur l'icône du lien pour voir l'historique complet des transactions.
Mettre à niveau pour débloquer les données premium et exporter vers Excel ![]() .
.
| Titre | Type | Prix moyen de l'action | Actions (en millions) |
ΔActions (%) |
ΔActions (%) |
Valeur ($ en millions) |
Portefeuille (%) |
ΔPortefeuille (%) |
|
|---|---|---|---|---|---|---|---|---|---|
| AAPL / Apple Inc. | 13,94 | 1,66 | 2 962,12 | -8,46 | 6,1513 | -0,1489 | |||
| MSFT / Microsoft Corporation | 7,38 | 1,66 | 2 917,07 | -3,19 | 6,0577 | 0,1913 | |||
| V / Visa Inc. | 7,68 | 3,35 | 2 652,96 | 4,47 | 5,5093 | 0,5650 | |||
| NVDA / NVIDIA Corporation | 21,43 | 1,56 | 2 334,47 | -7,87 | 4,8479 | -0,0854 | |||
| MA / Mastercard Incorporated | 4,23 | -0,51 | 2 317,13 | -1,83 | 4,8119 | 0,2164 | |||
| LLY / Eli Lilly and Company | 2,09 | 1,67 | 1 878,18 | 12,68 | 3,9003 | 0,6550 | |||
| META / Meta Platforms, Inc. | 3,16 | 1,66 | 1 733,70 | -19,02 | 3,6003 | -0,5678 | |||
| NFLX / Netflix, Inc. | 1,07 | 1,66 | 1 212,52 | 17,79 | 2,5180 | 0,5138 | |||
| TJX / The TJX Companies, Inc. | 9,41 | 1,66 | 1 211,36 | 4,83 | 2,5156 | 0,2658 | |||
| COST / Costco Wholesale Corporation | 1,00 | 1,67 | 994,25 | 3,18 | 2,0647 | 0,1886 | |||
| GOOGL / Alphabet Inc. | 5,49 | 1,66 | 871,55 | -20,87 | 1,8099 | -0,3345 | |||
| ADP / Automatic Data Processing, Inc. | 2,88 | 1,66 | 866,86 | 0,85 | 1,8002 | 0,1267 | |||
| UNH / UnitedHealth Group Incorporated | 2,09 | 1,67 | 859,71 | -22,89 | 1,7853 | -0,3855 | |||
| JNJ / Johnson & Johnson | 5,38 | 1,66 | 840,78 | 4,44 | 1,7460 | 0,1787 | |||
| ACN / Accenture plc | 2,62 | 1,66 | 782,55 | -21,00 | 1,6251 | -0,3035 | |||
| ADBE / Adobe Inc. | 2,06 | 1,66 | 771,06 | -12,85 | 1,6012 | -0,1215 | |||
| PG / The Procter & Gamble Company | 4,68 | 1,66 | 760,88 | -0,43 | 1,5801 | 0,0923 | |||
| GOOG / Alphabet Inc. | 4,71 | 1,66 | 757,56 | -20,44 | 1,5732 | -0,2808 | |||
| COP / ConocoPhillips | 7,29 | 1,66 | 650,06 | -8,32 | 1,3499 | -0,0306 | |||
| NKE / NIKE, Inc. | 11,42 | 1,66 | 643,92 | -25,44 | 1,3372 | -0,3442 | |||
| CMG / Chipotle Mexican Grill, Inc. | 12,40 | 1,66 | 626,39 | -11,98 | 1,3008 | -0,0847 | |||
| KO / The Coca-Cola Company | 8,52 | 1,66 | 618,27 | 16,19 | 1,2839 | 0,2479 | |||
| MRK / Merck & Co., Inc. | 6,83 | 1,66 | 582,14 | -12,35 | 1,2089 | -0,0842 | |||
| QCOM / QUALCOMM Incorporated | 3,91 | 1,66 | 581,21 | -12,72 | 1,2070 | -0,0896 | |||
| AMAT / Applied Materials, Inc. | 3,71 | 1,66 | 559,22 | -15,04 | 1,1613 | -0,1203 | |||
| KLAC / KLA Corporation | 0,78 | 1,66 | 545,16 | -3,23 | 1,1321 | 0,0352 | |||
| CAT / Caterpillar Inc. | 1,67 | 1,66 | 515,64 | -15,35 | 1,0708 | -0,1152 | |||
| TXN / Texas Instruments Incorporated | 3,21 | 1,66 | 513,86 | -11,86 | 1,0671 | -0,0680 | |||
| LMT / Lockheed Martin Corporation | 1,07 | 1,66 | 511,66 | 4,91 | 1,0625 | 0,1130 | |||
| LIN / Linde plc | 1,04 | 1,66 | 473,24 | 3,28 | 0,9827 | 0,0907 | |||
| BLK / BlackRock, Inc. | 0,47 | 1,78 | 432,02 | -13,48 | 0,8972 | -0,0751 | |||
| LRCX / Lam Research Corporation | 5,83 | 1,66 | 418,16 | -10,10 | 0,8684 | -0,0373 | |||
| ANET / Arista Networks Inc | 4,35 | 1,68 | 357,50 | -27,41 | 0,7424 | -0,2164 | |||
| SLB / Schlumberger Limited | 10,60 | 1,66 | 352,53 | -16,08 | 0,7321 | -0,0858 | |||
| ITW / Illinois Tool Works Inc. | 1,44 | 1,67 | 345,11 | -5,89 | 0,7167 | 0,0027 | |||
| MMC / Marsh & McLennan Companies, Inc. | 1,53 | 1,66 | 344,73 | 5,69 | 0,7159 | 0,0808 | |||
| LULU / lululemon athletica inc. | 1,26 | 1,67 | 340,20 | -33,54 | 0,7065 | -0,2902 | |||
| PEP / PepsiCo, Inc. | 2,42 | 1,66 | 328,61 | -8,53 | 0,6824 | -0,0171 | |||
| DHI / D.R. Horton, Inc. | 2,57 | 1,66 | 325,08 | -9,48 | 0,6751 | -0,0242 | |||
| CME / CME Group Inc. | 1,13 | 1,67 | 313,51 | 19,10 | 0,6510 | 0,1385 | |||
| APH / Amphenol Corporation | 4,06 | 1,67 | 312,79 | 10,53 | 0,6496 | 0,0986 | |||
| MMM / 3M Company | 2,18 | 1,66 | 302,27 | -7,21 | 0,6277 | -0,0066 | |||
| CDNS / Cadence Design Systems, Inc. | 1,01 | 1,67 | 299,68 | 1,71 | 0,6223 | 0,0487 | |||
| SRE / Sempra | 4,02 | 1,66 | 298,20 | -8,95 | 0,6192 | -0,0184 | |||
| CTAS / Cintas Corporation | 1,33 | 1,66 | 282,47 | 7,29 | 0,5866 | 0,0740 | |||
| TPL / Texas Pacific Land Corporation | 0,22 | 1,67 | 277,91 | 1,02 | 0,5771 | 0,0415 | |||
| TT / Trane Technologies plc | 0,71 | 1,67 | 271,70 | 7,43 | 0,5642 | 0,0718 | |||
| GRMN / Garmin Ltd. | 1,45 | 1,66 | 270,84 | -11,99 | 0,5624 | -0,0367 | |||
| PSA / Public Storage | 0,89 | 1,67 | 268,03 | 2,33 | 0,5566 | 0,0466 | |||
| VRTX / Vertex Pharmaceuticals Incorporated | 0,52 | 1,67 | 262,89 | 12,20 | 0,5459 | 0,0897 | |||
| SNPS / Synopsys, Inc. | 0,55 | 1,68 | 250,33 | -11,18 | 0,5199 | -0,0289 | |||
| NVR / NVR, Inc. | 0,03 | 1,67 | 243,76 | -9,62 | 0,5062 | -0,0189 | |||
| SPG / Simon Property Group, Inc. | 1,54 | 1,67 | 242,69 | -7,96 | 0,5040 | -0,0094 | |||
| MCO / Moody's Corporation | 0,53 | 1,68 | 241,59 | -7,75 | 0,5017 | -0,0082 | |||
| ED / Consolidated Edison, Inc. | 2,09 | 1,65 | 235,62 | 22,27 | 0,4893 | 0,1141 | |||
| PAYX / Paychex, Inc. | 1,55 | 1,67 | 228,22 | 1,29 | 0,4739 | 0,0352 | |||
| TSCO / Tractor Supply Company | 4,47 | 1,67 | 226,48 | -5,33 | 0,4703 | 0,0045 | |||
| APP / AppLovin Corporation | 0,82 | 1,68 | 220,10 | -25,91 | 0,4571 | -0,1213 | |||
| WSM / Williams-Sonoma, Inc. | 1,39 | 1,70 | 214,99 | -25,68 | 0,4464 | -0,1167 | |||
| GWW / W.W. Grainger, Inc. | 0,21 | 1,79 | 213,80 | -1,88 | 0,4440 | 0,0197 | |||
| AMP / Ameriprise Financial, Inc. | 0,45 | 1,69 | 213,64 | -11,85 | 0,4436 | -0,0282 | |||
| US0669225197 / BlackRock Cash Funds: Institutional, SL Agency Shares | 210,04 | 219,52 | 210,12 | 219,49 | 0,4363 | 0,3083 | |||
| PEG / Public Service Enterprise Group Incorporated | 2,63 | 1,68 | 210,12 | -2,71 | 0,4363 | 0,0158 | |||
| PHM / PulteGroup, Inc. | 2,00 | 1,69 | 205,42 | -8,32 | 0,4266 | -0,0096 | |||
| SHW / The Sherwin-Williams Company | 0,57 | 1,68 | 201,55 | 0,19 | 0,4186 | 0,0269 | |||
| DECK / Deckers Outdoor Corporation | 1,76 | 1,71 | 195,27 | -36,44 | 0,4055 | -0,1927 | |||
| AFL / Aflac Incorporated | 1,74 | 1,67 | 189,60 | 2,90 | 0,3937 | 0,0350 | |||
| ATO / Atmos Energy Corporation | 1,15 | 1,67 | 184,47 | 14,60 | 0,3831 | 0,0697 | |||
| EXE / Expand Energy Corporation | 1,77 | 1,67 | 184,19 | 3,97 | 0,3825 | 0,0376 | |||
| FAST / Fastenal Company | 2,27 | 1,67 | 183,59 | 12,40 | 0,3812 | 0,0632 | |||
| CBRE / CBRE Group, Inc. | 1,47 | 1,68 | 180,14 | -14,17 | 0,3741 | -0,0345 | |||
| ULTA / Ulta Beauty, Inc. | 0,45 | 1,69 | 179,04 | -2,38 | 0,3718 | 0,0147 | |||
| ZTS / Zoetis Inc. | 1,14 | 1,68 | 178,07 | -6,95 | 0,3698 | -0,0028 | |||
| AWK / American Water Works Company, Inc. | 1,17 | 1,82 | 171,76 | 20,10 | 0,3567 | 0,0782 | |||
| CSGP / CoStar Group, Inc. | 1,99 | 1,85 | 147,30 | -1,38 | 0,3059 | 0,0151 | |||
| BBY / Best Buy Co., Inc. | 2,00 | 1,70 | 133,26 | -21,01 | 0,2767 | -0,0517 | |||
| AVB / AvalonBay Communities, Inc. | 0,61 | 1,85 | 128,01 | -3,45 | 0,2658 | 0,0077 | |||
| ECL / Ecolab Inc. | 0,47 | 1,67 | 118,61 | 2,17 | 0,2463 | 0,0203 | |||
| APD / Air Products and Chemicals, Inc. | 0,44 | 1,85 | 118,44 | -17,65 | 0,2460 | -0,0341 | |||
| ODFL / Old Dominion Freight Line, Inc. | 0,73 | 1,84 | 112,39 | -15,90 | 0,2334 | -0,0268 | |||
| ACGL / Arch Capital Group Ltd. | 1,24 | 1,47 | 112,34 | -1,13 | 0,2333 | 0,0121 | |||
| IDXX / IDEXX Laboratories, Inc. | 0,25 | 1,66 | 109,44 | 4,22 | 0,2273 | 0,0228 | |||
| EQR / Equity Residential | 1,46 | 1,71 | 102,57 | 1,17 | 0,2130 | 0,0156 | |||
| NTAP / NetApp, Inc. | 1,13 | 1,85 | 101,13 | -25,14 | 0,2100 | -0,0530 | |||
| MNST / Monster Beverage Corporation | 1,67 | 1,74 | 100,48 | 25,57 | 0,2087 | 0,0529 | |||
| MPWR / Monolithic Power Systems, Inc. | 0,17 | 1,74 | 98,67 | -5,33 | 0,2049 | 0,0020 | |||
| EW / Edwards Lifesciences Corporation | 1,29 | 1,72 | 97,16 | 5,99 | 0,2018 | 0,0233 | |||
| POOL / Pool Corporation | 0,33 | 1,82 | 96,74 | -13,29 | 0,2009 | -0,0163 | |||
| MANH / Manhattan Associates, Inc. | 0,49 | 1,84 | 86,12 | -13,40 | 0,1788 | -0,0148 | |||
| EA / Electronic Arts Inc. | 0,56 | 1,80 | 80,79 | 20,18 | 0,1678 | 0,0369 | |||
| DOCU / DocuSign, Inc. | 0,99 | 1,81 | 80,71 | -13,95 | 0,1676 | -0,0150 | |||
| CBOE / Cboe Global Markets, Inc. | 0,35 | 2,02 | 78,37 | 10,74 | 0,1627 | 0,0250 | |||
| RMD / ResMed Inc. | 0,31 | 1,83 | 74,17 | 2,01 | 0,1540 | 0,0125 | |||
| VLTO / Veralto Corporation | 0,74 | 1,83 | 70,88 | -5,55 | 0,1472 | 0,0011 | |||
| LPLA / LPL Financial Holdings Inc. | 0,22 | 1,79 | 69,79 | -11,28 | 0,1449 | -0,0082 | |||
| VEEV / Veeva Systems Inc. | 0,30 | 1,85 | 69,63 | 2,04 | 0,1446 | 0,0117 | |||
| TROW / T. Rowe Price Group, Inc. | 0,77 | 1,47 | 68,37 | -23,15 | 0,1420 | -0,0312 | |||
| EME / EMCOR Group, Inc. | 0,17 | 1,85 | 67,52 | -8,92 | 0,1402 | -0,0041 | |||
| US0669224778 / BlackRock Cash Funds: Treasury, SL Agency Shares | 66,41 | 17,86 | 66,41 | 17,86 | 0,1379 | 0,0282 | |||
| A / Agilent Technologies, Inc. | 0,61 | 1,78 | 65,48 | -27,72 | 0,1360 | -0,0404 | |||
| WTRG / Essential Utilities, Inc. | 1,53 | 1,87 | 62,92 | 18,10 | 0,1307 | 0,0269 | |||
| ROL / Rollins, Inc. | 1,06 | 1,90 | 60,66 | 17,60 | 0,1260 | 0,0255 | |||
| FDS / FactSet Research Systems Inc. | 0,13 | 1,89 | 56,89 | -7,17 | 0,1181 | -0,0012 | |||
| HSY / The Hershey Company | 0,33 | 1,93 | 54,50 | 14,18 | 0,1132 | 0,0202 | |||
| PPG / PPG Industries, Inc. | 0,48 | 1,96 | 52,52 | -3,80 | 0,1091 | 0,0028 | |||
| EXPD / Expeditors International of Washington, Inc. | 0,45 | 1,98 | 49,96 | -1,32 | 0,1038 | 0,0052 | |||
| JKHY / Jack Henry & Associates, Inc. | 0,27 | 1,98 | 46,51 | 1,59 | 0,0966 | 0,0075 | |||
| PAYC / Paycom Software, Inc. | 0,20 | 1,48 | 45,89 | 10,69 | 0,0953 | 0,0146 | |||
| GGG / Graco Inc. | 0,54 | 2,05 | 44,42 | -1,05 | 0,0922 | 0,0048 | |||
| WAT / Waters Corporation | 0,11 | 1,46 | 37,75 | -15,09 | 0,0784 | -0,0082 | |||
| MOH / Molina Healthcare, Inc. | 0,11 | 2,09 | 37,50 | 7,55 | 0,0779 | 0,0100 | |||
| ERIE / Erie Indemnity Company | 0,10 | 2,04 | 37,10 | -9,18 | 0,0771 | -0,0025 | |||
| SEIC / SEI Investments Company | 0,41 | 1,47 | 32,32 | -8,25 | 0,0671 | -0,0015 | |||
| OMC / Omnicom Group Inc. | 0,42 | 1,46 | 31,64 | -10,96 | 0,0657 | -0,0035 | |||
| WST / West Pharmaceutical Services, Inc. | 0,15 | 1,47 | 31,03 | -37,23 | 0,0644 | -0,0318 | |||
| PKG / Packaging Corporation of America | 0,16 | 1,46 | 29,58 | -11,44 | 0,0614 | -0,0036 | |||
| AVY / Avery Dennison Corporation | 0,17 | 1,49 | 28,73 | -6,50 | 0,0597 | -0,0002 | |||
| AFG / American Financial Group, Inc. | 0,22 | 1,45 | 28,31 | -5,90 | 0,0588 | 0,0002 | |||
| SOLV / Solventum Corporation | 0,42 | 1,47 | 27,74 | -9,41 | 0,0576 | -0,0020 | |||
| RPM / RPM International Inc. | 0,25 | 1,47 | 26,63 | -14,44 | 0,0553 | -0,0053 | |||
| UTHR / United Therapeutics Corporation | 0,09 | 1,42 | 26,62 | -12,46 | 0,0553 | -0,0039 | |||
| RS / Reliance, Inc. | 0,09 | 1,49 | 25,76 | 1,04 | 0,0535 | 0,0039 | |||
| AOS / A. O. Smith Corporation | 0,37 | 1,46 | 25,13 | 2,30 | 0,0522 | 0,0044 | |||
| IPG / The Interpublic Group of Companies, Inc. | 0,79 | 1,47 | 19,94 | -11,10 | 0,0414 | -0,0023 | |||
| BFB / Brown-Forman Corp. - Class B | 0,27 | 1,46 | 9,32 | 7,08 | 0,0193 | 0,0024 | |||
| S P500 EMINI FUT JUN25 / DE (N/A) | -0,52 | -0,0011 | -0,0011 | ||||||
| S P500 EMINI FUT JUN25 / DE (N/A) | -0,52 | -0,0011 | -0,0011 |