Statistiques de base
| Valeur du portefeuille | $ 216 095 060 |
| Positions actuelles | 169 |
Dernières positions, performances, ASG (à partir des dépôts 13F, 13D)
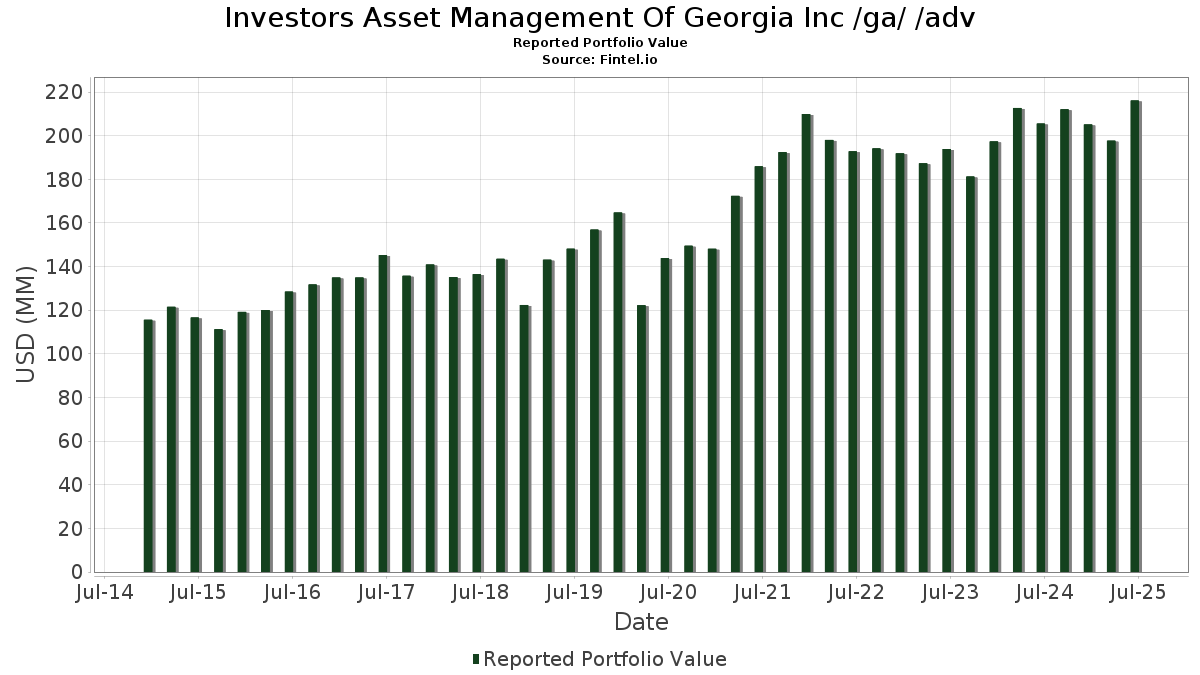
Investors Asset Management Of Georgia Inc /ga/ /adv a déclaré un total de 169 positions dans ses derniers dépôts auprès de la SEC. La valeur la plus récente du portefeuille est calculée à 216 095 060 USD. Les actifs sous gestion réels (ASG) sont cette valeur plus les liquidités (qui ne sont pas divulguées). Les principales positions de Investors Asset Management Of Georgia Inc /ga/ /adv sont Equifax Inc. (US:EFX) , CoreCard Corporation (US:CCRD) , JPMorgan Chase & Co. (US:JPM) , Microsoft Corporation (US:MSFT) , and Fidelity National Information Services, Inc. (US:FIS) . Les nouvelles positions de Investors Asset Management Of Georgia Inc /ga/ /adv incluent Becton, Dickinson and Company (US:BDX) , Plug Power Inc. (US:PLUG) , .
Meilleures augmentations ce trimestre
Nous utilisons la variation de l'allocation du portefeuille car il s'agit de l'indicateur le plus significatif. Les changements peuvent être dus à des transactions ou à des variations de prix des actions.
| Titre | Actions (en millions) |
Valeur ($ en millions) |
% du portefeuille | ΔPortefeuille % |
|---|---|---|---|---|
| 0,30 | 8,61 | 3,9856 | 1,1497 | |
| 0,03 | 2,34 | 1,0832 | 1,0688 | |
| 0,01 | 7,32 | 3,3886 | 0,6102 | |
| 0,03 | 3,85 | 1,7837 | 0,3952 | |
| 0,01 | 3,01 | 1,3933 | 0,2315 | |
| 0,03 | 7,77 | 3,5949 | 0,2288 | |
| 0,01 | 1,45 | 0,6722 | 0,2259 | |
| 0,00 | 1,28 | 0,5918 | 0,2186 | |
| 0,01 | 0,42 | 0,1944 | 0,1944 | |
| 0,00 | 0,38 | 0,1762 | 0,1762 |
Principales baisses ce trimestre
Nous utilisons la variation de l'allocation du portefeuille car il s'agit de l'indicateur le plus significatif. Les changements peuvent être dus à des transactions ou à des variations de prix des actions.
| Titre | Actions (en millions) |
Valeur ($ en millions) |
% du portefeuille | ΔPortefeuille % |
|---|---|---|---|---|
| 0,03 | 2,46 | 1,1395 | -0,8183 | |
| 0,02 | 5,18 | 2,3957 | -0,5833 | |
| 0,03 | 4,20 | 1,9443 | -0,5146 | |
| 0,01 | 5,37 | 2,4839 | -0,4367 | |
| 0,09 | 22,64 | 10,4781 | -0,4007 | |
| 0,03 | 2,24 | 1,0365 | -0,2865 | |
| 0,02 | 3,41 | 1,5764 | -0,2583 | |
| 0,01 | 5,14 | 2,3793 | -0,2023 | |
| 0,02 | 3,46 | 1,5995 | -0,1887 | |
| 0,02 | 1,41 | 0,6517 | -0,1791 |
Déclarations 13F et dépôts de fonds
Ce formulaire a été déposé le 2025-07-22 pour la période de déclaration 2025-06-30. Cliquez sur l'icône du lien pour voir l'historique complet des transactions.
Mettre à niveau pour débloquer les données premium et exporter vers Excel ![]() .
.
| Titre | Type | Prix moyen de l'action | Actions (en millions) |
ΔActions (%) |
ΔActions (%) |
Valeur ($ en millions) |
Portefeuille (%) |
ΔPortefeuille (%) |
|
|---|---|---|---|---|---|---|---|---|---|
| EFX / Equifax Inc. | 0,09 | -1,13 | 22,64 | 5,29 | 10,4781 | -0,4007 | |||
| CCRD / CoreCard Corporation | 0,30 | -0,78 | 8,61 | 53,62 | 3,9856 | 1,1497 | |||
| JPM / JPMorgan Chase & Co. | 0,03 | -1,22 | 7,77 | 16,74 | 3,5949 | 0,2288 | |||
| MSFT / Microsoft Corporation | 0,01 | 0,62 | 7,32 | 33,32 | 3,3886 | 0,6102 | |||
| FIS / Fidelity National Information Services, Inc. | 0,07 | -1,48 | 5,40 | 7,39 | 2,5004 | -0,0446 | |||
| LLY / Eli Lilly and Company | 0,01 | -1,50 | 5,37 | -7,03 | 2,4839 | -0,4367 | |||
| IWM / iShares Trust - iShares Russell 2000 ETF | 0,02 | -18,73 | 5,18 | -12,09 | 2,3957 | -0,5833 | |||
| HD / The Home Depot, Inc. | 0,01 | 0,70 | 5,14 | 0,74 | 2,3793 | -0,2023 | |||
| CVX / Chevron Corporation | 0,03 | 0,98 | 4,20 | -13,56 | 1,9443 | -0,5146 | |||
| AMD / Advanced Micro Devices, Inc. | 0,03 | 1,67 | 3,85 | 40,40 | 1,7837 | 0,3952 | |||
| ABBV / AbbVie Inc. | 0,02 | 10,37 | 3,46 | -2,23 | 1,5995 | -0,1887 | |||
| AAPL / Apple Inc. | 0,02 | 1,68 | 3,41 | -6,09 | 1,5764 | -0,2583 | |||
| GE / General Electric Company | 0,01 | 2,04 | 3,01 | 31,10 | 1,3933 | 0,2315 | |||
| CAT / Caterpillar Inc. | 0,01 | 0,08 | 2,94 | 17,81 | 1,3592 | 0,0980 | |||
| PM / Philip Morris International Inc. | 0,02 | 0,00 | 2,88 | 14,75 | 1,3324 | 0,0630 | |||
| AXP / American Express Company | 0,01 | 4,28 | 2,72 | 23,64 | 1,2591 | 0,1458 | |||
| KO / The Coca-Cola Company | 0,04 | 1,31 | 2,57 | 0,08 | 1,1878 | -0,1096 | |||
| BELFB / Bel Fuse Inc. | 0,03 | -51,24 | 2,46 | -36,38 | 1,1395 | -0,8183 | |||
| IBM / International Business Machines Corporation | 0,01 | -0,33 | 2,41 | 18,12 | 1,1132 | 0,0833 | |||
| QQQ / Invesco QQQ Trust, Series 1 | 0,00 | 0,31 | 2,35 | 18,01 | 1,0885 | 0,0802 | |||
| COST / Costco Wholesale Corporation | 0,00 | 0,00 | 2,35 | 4,69 | 1,0857 | -0,0482 | |||
| BELFA / Bel Fuse Inc. | 0,03 | 2 505,10 | 2,34 | 8 257,14 | 1,0832 | 1,0688 | |||
| PFE / Pfizer Inc. | 0,10 | 0,70 | 2,31 | -3,67 | 1,0687 | -0,1440 | |||
| OKE / ONEOK, Inc. | 0,03 | 4,10 | 2,24 | -14,38 | 1,0365 | -0,2865 | |||
| VTI / Vanguard Index Funds - Vanguard Total Stock Market ETF | 0,01 | 1,82 | 2,21 | 12,61 | 1,0211 | 0,0298 | |||
| VYM / Vanguard Whitehall Funds - Vanguard High Dividend Yield ETF | 0,02 | 4,48 | 2,14 | 7,97 | 0,9907 | -0,0120 | |||
| MO / Altria Group, Inc. | 0,04 | 0,00 | 2,12 | -2,31 | 0,9793 | -0,1166 | |||
| BAC / Bank of America Corporation | 0,04 | 0,05 | 2,09 | 13,42 | 0,9666 | 0,0352 | |||
| CSCO / Cisco Systems, Inc. | 0,03 | -0,43 | 2,06 | 11,98 | 0,9515 | 0,0223 | |||
| GILD / Gilead Sciences, Inc. | 0,02 | 0,02 | 2,01 | -1,03 | 0,9299 | -0,0972 | |||
| MCD / McDonald's Corporation | 0,01 | -0,97 | 1,96 | -7,41 | 0,9087 | -0,1637 | |||
| SPY / SPDR S&P 500 ETF | 0,00 | 17,24 | 1,89 | 29,54 | 0,8750 | 0,1366 | |||
| TT / Trane Technologies plc | 0,00 | -0,37 | 1,88 | 29,38 | 0,8682 | 0,1344 | |||
| BA / The Boeing Company | 0,01 | 1,09 | 1,87 | 24,20 | 0,8647 | 0,1036 | |||
| MCK / McKesson Corporation | 0,00 | -2,58 | 1,82 | 5,99 | 0,8435 | -0,0261 | |||
| BX / Blackstone Inc. | 0,01 | 7,08 | 1,75 | 14,61 | 0,8096 | 0,0372 | |||
| LMT / Lockheed Martin Corporation | 0,00 | -0,25 | 1,68 | 3,39 | 0,7768 | -0,0444 | |||
| RTX / RTX Corporation | 0,01 | 3,58 | 1,66 | 14,19 | 0,7675 | 0,0327 | |||
| DIS / The Walt Disney Company | 0,01 | -4,01 | 1,63 | 20,56 | 0,7546 | 0,0706 | |||
| T / AT&T Inc. | 0,05 | 3,56 | 1,58 | 5,99 | 0,7293 | -0,0229 | |||
| ITW / Illinois Tool Works Inc. | 0,01 | 0,00 | 1,51 | -0,26 | 0,6979 | -0,0673 | |||
| WFC / Wells Fargo & Company | 0,02 | 0,12 | 1,51 | 11,72 | 0,6972 | 0,0152 | |||
| XOM / Exxon Mobil Corporation | 0,01 | 0,32 | 1,46 | -9,07 | 0,6778 | -0,1370 | |||
| AVGO / Broadcom Inc. | 0,01 | 0,00 | 1,45 | 64,63 | 0,6722 | 0,2259 | |||
| VOO / Vanguard Index Funds - Vanguard S&P 500 ETF | 0,00 | 0,20 | 1,45 | 10,76 | 0,6721 | 0,0087 | |||
| MRK / Merck & Co., Inc. | 0,02 | -2,77 | 1,41 | -14,25 | 0,6517 | -0,1791 | |||
| JNJ / Johnson & Johnson | 0,01 | 1,29 | 1,39 | -6,76 | 0,6451 | -0,1108 | |||
| BP / BP p.l.c. - Depositary Receipt (Common Stock) | 0,05 | 26,93 | 1,37 | 12,42 | 0,6327 | 0,0175 | |||
| NFLX / Netflix, Inc. | 0,00 | 0,00 | 1,36 | 43,66 | 0,6290 | 0,1502 | |||
| GEV / GE Vernova Inc. | 0,00 | 0,00 | 1,28 | 73,41 | 0,5918 | 0,2186 | |||
| SNV / Synovus Financial Corp. | 0,02 | 2,99 | 1,23 | 14,06 | 0,5706 | 0,0236 | |||
| MDLZ / Mondelez International, Inc. | 0,02 | -0,41 | 1,23 | -1,05 | 0,5672 | -0,0592 | |||
| AVDL / Avadel Pharmaceuticals plc | 0,13 | -4,93 | 1,18 | 7,39 | 0,5450 | -0,0094 | |||
| RF / Regions Financial Corporation | 0,05 | -0,33 | 1,17 | 7,81 | 0,5432 | -0,0072 | |||
| TRV / The Travelers Companies, Inc. | 0,00 | 0,00 | 1,17 | 1,13 | 0,5399 | -0,0435 | |||
| XLF / The Select Sector SPDR Trust - The Financial Select Sector SPDR Fund | 0,02 | 0,16 | 1,16 | 5,36 | 0,5365 | -0,0204 | |||
| UPS / United Parcel Service, Inc. | 0,01 | 42,05 | 1,16 | 30,44 | 0,5356 | 0,0865 | |||
| COP / ConocoPhillips | 0,01 | -0,17 | 1,15 | -14,73 | 0,5306 | -0,1493 | |||
| GJR / Strats Trust For Procter & Gambel Security - Preferred Security | 0,01 | 0,00 | 1,07 | -6,55 | 0,4956 | -0,0839 | |||
| OXY / Occidental Petroleum Corporation | 0,03 | 0,65 | 1,07 | -14,37 | 0,4940 | -0,1364 | |||
| PRTH / Priority Technology Holdings, Inc. | 0,14 | 44,63 | 1,07 | 65,12 | 0,4931 | 0,1666 | |||
| ORCL / Oracle Corporation | 0,00 | 0,00 | 1,06 | 56,34 | 0,4907 | 0,1477 | |||
| TGT / Target Corporation | 0,01 | -4,29 | 1,03 | -9,56 | 0,4774 | -0,0994 | |||
| AZN / AstraZeneca PLC - Depositary Receipt (Common Stock) | 0,01 | 0,00 | 1,02 | -4,93 | 0,4734 | -0,0709 | |||
| F / Ford Motor Company | 0,09 | -0,05 | 0,99 | 8,04 | 0,4603 | -0,0050 | |||
| VZ / Verizon Communications Inc. | 0,02 | 1,72 | 0,97 | -2,91 | 0,4485 | -0,0568 | |||
| WMT / Walmart Inc. | 0,01 | 0,00 | 0,95 | 11,38 | 0,4393 | 0,0082 | |||
| WSBC / WesBanco, Inc. | 0,03 | 1,37 | 0,94 | 3,53 | 0,4347 | -0,0242 | |||
| KHC / The Kraft Heinz Company | 0,03 | 0,94 | 0,87 | -14,31 | 0,4046 | -0,1118 | |||
| NOK / Nokia Oyj - Depositary Receipt (Common Stock) | 0,16 | 2,26 | 0,82 | 0,49 | 0,3799 | -0,0333 | |||
| MMM / 3M Company | 0,01 | 1,14 | 0,81 | 4,79 | 0,3753 | -0,0160 | |||
| AMZN / Amazon.com, Inc. | 0,00 | 17,63 | 0,78 | 35,70 | 0,3624 | 0,0703 | |||
| AGM / Federal Agricultural Mortgage Corporation | 0,00 | 0,00 | 0,78 | 3,71 | 0,3624 | -0,0199 | |||
| NVDD / Direxion Shares ETF Trust - Direxion Daily NVDA Bear 1X Shares | 0,00 | 23,85 | 0,78 | 80,74 | 0,3607 | 0,1423 | |||
| FCX / Freeport-McMoRan Inc. | 0,02 | 1,14 | 0,77 | 15,52 | 0,3583 | 0,0193 | |||
| LIN / Linde plc | 0,00 | -0,62 | 0,76 | 0,13 | 0,3496 | -0,0320 | |||
| FNF / Fidelity National Financial, Inc. | 0,01 | 0,00 | 0,75 | -13,86 | 0,3454 | -0,0929 | |||
| XLE / The Select Sector SPDR Trust - The Energy Select Sector SPDR Fund | 0,01 | 0,69 | 0,71 | -8,65 | 0,3280 | -0,0644 | |||
| KMI / Kinder Morgan, Inc. | 0,02 | 6,70 | 0,70 | 10,03 | 0,3250 | 0,0019 | |||
| AFL / Aflac Incorporated | 0,01 | -4,32 | 0,70 | -9,23 | 0,3232 | -0,0661 | |||
| ALL / The Allstate Corporation | 0,00 | -2,67 | 0,66 | -5,32 | 0,3051 | -0,0474 | |||
| C / Citigroup Inc. | 0,01 | 0,00 | 0,66 | 19,89 | 0,3043 | 0,0269 | |||
| ABT / Abbott Laboratories | 0,00 | 0,00 | 0,64 | 2,55 | 0,2980 | -0,0197 | |||
| CVS / CVS Health Corporation | 0,01 | -4,09 | 0,64 | -2,43 | 0,2974 | -0,0355 | |||
| ODP / The ODP Corporation | 0,04 | 0,07 | 0,64 | 26,68 | 0,2970 | 0,0406 | |||
| CSX / CSX Corporation | 0,02 | 10,19 | 0,62 | 22,27 | 0,2847 | 0,0300 | |||
| INTC / Intel Corporation | 0,03 | -0,10 | 0,61 | -1,45 | 0,2825 | -0,0309 | |||
| HBAN / Huntington Bancshares Incorporated | 0,03 | 43,75 | 0,58 | 60,56 | 0,2676 | 0,0853 | |||
| HPE / Hewlett Packard Enterprise Company | 0,03 | -1,21 | 0,56 | 30,84 | 0,2595 | 0,0428 | |||
| IP / International Paper Company | 0,01 | -1,29 | 0,54 | -13,34 | 0,2496 | -0,0653 | |||
| FITB / Fifth Third Bancorp | 0,01 | 21,83 | 0,53 | 27,82 | 0,2470 | 0,0358 | |||
| WMB / The Williams Companies, Inc. | 0,01 | -1,16 | 0,53 | 3,90 | 0,2468 | -0,0129 | |||
| CLX / The Clorox Company | 0,00 | -1,28 | 0,53 | -19,54 | 0,2442 | -0,0874 | |||
| MP / MP Materials Corp. | 0,02 | 0,16 | 0,51 | 36,34 | 0,2383 | 0,0475 | |||
| VOT / Vanguard Index Funds - Vanguard Mid-Cap Growth ETF | 0,00 | 16,79 | 0,50 | 35,68 | 0,2325 | 0,0453 | |||
| BRK.A / Berkshire Hathaway Inc. | 0,00 | 0,00 | 0,49 | -8,83 | 0,2248 | -0,0446 | |||
| UNM / Unum Group | 0,01 | 0,07 | 0,48 | -0,83 | 0,2216 | -0,0226 | |||
| KMB / Kimberly-Clark Corporation | 0,00 | 1,12 | 0,46 | -8,48 | 0,2151 | -0,0414 | |||
| GIS / General Mills, Inc. | 0,01 | 0,03 | 0,46 | -13,32 | 0,2140 | -0,0559 | |||
| VO / Vanguard Index Funds - Vanguard Mid-Cap ETF | 0,00 | 54,20 | 0,46 | 67,03 | 0,2115 | 0,0729 | |||
| CAH / Cardinal Health, Inc. | 0,00 | 0,00 | 0,45 | 21,92 | 0,2060 | 0,0213 | |||
| BMY / Bristol-Myers Squibb Company | 0,01 | 14,15 | 0,44 | -13,28 | 0,2056 | -0,0538 | |||
| QCOM / QUALCOMM Incorporated | 0,00 | 59,35 | 0,44 | 65,28 | 0,2028 | 0,0686 | |||
| XLV / The Select Sector SPDR Trust - The Health Care Select Sector SPDR Fund | 0,00 | 0,15 | 0,44 | -7,42 | 0,2024 | -0,0369 | |||
| ZTS / Zoetis Inc. | 0,00 | 15,57 | 0,42 | 9,33 | 0,1956 | 0,0003 | |||
| D / Dominion Energy, Inc. | 0,01 | 0,42 | 0,1944 | 0,1944 | |||||
| GOOG / Alphabet Inc. | 0,00 | 14,57 | 0,39 | 30,00 | 0,1808 | 0,0289 | |||
| KEY / KeyCorp | 0,02 | 2,93 | 0,39 | 12,10 | 0,1801 | 0,0045 | |||
| HON / Honeywell International Inc. | 0,00 | -2,02 | 0,38 | 7,87 | 0,1778 | -0,0025 | |||
| JPC / Nuveen Preferred & Income Opportunities Fund | 0,05 | 3,24 | 0,38 | 3,80 | 0,1772 | -0,0090 | |||
| VRT / Vertiv Holdings Co | 0,00 | 0,38 | 0,1762 | 0,1762 | |||||
| SCHW / The Charles Schwab Corporation | 0,00 | 0,07 | 0,38 | 16,56 | 0,1760 | 0,0110 | |||
| LOW / Lowe's Companies, Inc. | 0,00 | 0,00 | 0,38 | -4,80 | 0,1745 | -0,0260 | |||
| DOW / Dow Inc. | 0,01 | 4,03 | 0,37 | -21,24 | 0,1703 | -0,0657 | |||
| PSLV / Sprott Physical Silver Trust | 0,03 | -1,70 | 0,37 | 3,67 | 0,1699 | -0,0092 | |||
| GSCE / GS Connect S&P GSCI Enhanced Commodity Total Return ETN | 0,00 | -0,19 | 0,36 | 29,64 | 0,1680 | 0,0260 | |||
| VIG / Vanguard Specialized Funds - Vanguard Dividend Appreciation ETF | 0,00 | 0,00 | 0,36 | 5,57 | 0,1669 | -0,0060 | |||
| GD / General Dynamics Corporation | 0,00 | 0,00 | 0,36 | 7,21 | 0,1653 | -0,0036 | |||
| SW / Smurfit Westrock Plc | 0,01 | -0,40 | 0,35 | -4,88 | 0,1629 | -0,0238 | |||
| RGA / Reinsurance Group of America, Incorporated | 0,00 | 0,06 | 0,35 | 0,86 | 0,1621 | -0,0137 | |||
| DUK / Duke Energy Corporation | 0,00 | 2,31 | 0,35 | -1,15 | 0,1599 | -0,0167 | |||
| MOS / The Mosaic Company | 0,01 | -9,74 | 0,34 | 21,22 | 0,1562 | 0,0151 | |||
| DD / DuPont de Nemours, Inc. | 0,00 | -2,39 | 0,34 | -10,43 | 0,1553 | -0,0341 | |||
| DVN / Devon Energy Corporation | 0,01 | -11,94 | 0,32 | -25,29 | 0,1494 | -0,0686 | |||
| TXN / Texas Instruments Incorporated | 0,00 | 0,00 | 0,32 | 15,47 | 0,1489 | 0,0080 | |||
| PSX / Phillips 66 | 0,00 | -1,00 | 0,31 | -4,36 | 0,1422 | -0,0203 | |||
| ETN / Eaton Corporation plc | 0,00 | 0,00 | 0,30 | 31,30 | 0,1401 | 0,0235 | |||
| IR / Ingersoll Rand Inc. | 0,00 | 0,00 | 0,30 | 3,79 | 0,1396 | -0,0072 | |||
| COF / Capital One Financial Corporation | 0,00 | 0,30 | 0,1381 | 0,1381 | |||||
| NWL / Newell Brands Inc. | 0,05 | 8,93 | 0,29 | -5,23 | 0,1344 | -0,0204 | |||
| URI / United Rentals, Inc. | 0,00 | 0,00 | 0,29 | 20,00 | 0,1335 | 0,0121 | |||
| SHOP / Shopify Inc. | 0,00 | 1,44 | 0,28 | 22,51 | 0,1313 | 0,0142 | |||
| DVY / iShares Trust - iShares Select Dividend ETF | 0,00 | 0,00 | 0,28 | -1,06 | 0,1299 | -0,0137 | |||
| STZ / Constellation Brands, Inc. | 0,00 | -14,40 | 0,28 | -24,12 | 0,1298 | -0,0572 | |||
| SO / The Southern Company | 0,00 | 0,00 | 0,28 | -0,36 | 0,1276 | -0,0121 | |||
| WES / Western Midstream Partners, LP - Limited Partnership | 0,01 | 0,00 | 0,27 | -5,30 | 0,1241 | -0,0195 | |||
| HPQ / HP Inc. | 0,01 | 10,68 | 0,27 | -2,21 | 0,1232 | -0,0145 | |||
| SHEL / Shell plc - Depositary Receipt (Common Stock) | 0,00 | 0,00 | 0,27 | -3,99 | 0,1230 | -0,0169 | |||
| XPRO / Expro Group Holdings N.V. | 0,00 | 0,00 | 0,26 | -22,02 | 0,1214 | -0,0486 | |||
| GLW / Corning Incorporated | 0,00 | 0,26 | 0,1207 | 0,1207 | |||||
| BGS / B&G Foods, Inc. | 0,06 | 13,86 | 0,26 | -29,81 | 0,1199 | -0,0670 | |||
| PHYS / Sprott Physical Gold Trust | 0,01 | 0,00 | 0,25 | 5,42 | 0,1173 | -0,0044 | |||
| HAL / Halliburton Company | 0,01 | 9,12 | 0,24 | -12,59 | 0,1129 | -0,0279 | |||
| CEF / Sprott Physical Gold and Silver Trust | 0,01 | -1,82 | 0,24 | 3,86 | 0,1124 | -0,0057 | |||
| LUMN / Lumen Technologies, Inc. | 0,06 | 8,91 | 0,24 | 21,72 | 0,1115 | 0,0113 | |||
| MPC / Marathon Petroleum Corporation | 0,00 | -5,00 | 0,24 | 8,26 | 0,1095 | -0,0010 | |||
| LW / Lamb Weston Holdings, Inc. | 0,00 | -6,22 | 0,23 | -8,95 | 0,1085 | -0,0215 | |||
| XLK / The Select Sector SPDR Trust - The Technology Select Sector SPDR Fund | 0,00 | 0,23 | 0,1066 | 0,1066 | |||||
| EBGEF / Enbridge Inc. - Preferred Stock | 0,01 | -1,60 | 0,23 | 0,88 | 0,1055 | -0,0091 | |||
| UNH / UnitedHealth Group Incorporated | 0,00 | 0,00 | 0,22 | -40,43 | 0,1038 | -0,0867 | |||
| IDV / iShares Trust - iShares International Select Dividend ETF | 0,01 | 0,22 | 0,1011 | 0,1011 | |||||
| NEA / Nuveen AMT-Free Quality Municipal Income Fund | 0,02 | 0,07 | 0,21 | -2,34 | 0,0967 | -0,0116 | |||
| VPU / Vanguard World Fund - Vanguard Utilities ETF | 0,00 | 0,00 | 0,21 | 3,48 | 0,0963 | -0,0056 | |||
| AMGN / Amgen Inc. | 0,00 | -0,54 | 0,21 | -10,82 | 0,0956 | -0,0216 | |||
| MAR / Marriott International, Inc. | 0,00 | 0,20 | 0,0949 | 0,0949 | |||||
| BDX / Becton, Dickinson and Company | 0,00 | 0,20 | 0,0937 | 0,0937 | |||||
| STX / Seagate Technology Holdings plc | 0,00 | 0,20 | 0,0935 | 0,0935 | |||||
| FLO / Flowers Foods, Inc. | 0,01 | 0,00 | 0,18 | -16,19 | 0,0819 | -0,0246 | |||
| WBD / Warner Bros. Discovery, Inc. | 0,01 | 9,71 | 0,16 | 17,16 | 0,0727 | 0,0049 | |||
| GNW / Genworth Financial, Inc. | 0,02 | 0,00 | 0,16 | 9,93 | 0,0720 | 0,0003 | |||
| BTZ / BlackRock Credit Allocation Income Trust | 0,01 | 0,00 | 0,15 | 2,08 | 0,0682 | -0,0050 | |||
| NUV / Nuveen Municipal Value Fund, Inc. | 0,02 | 0,00 | 0,14 | -0,70 | 0,0653 | -0,0067 | |||
| RUN / Sunrun Inc. | 0,01 | -10,37 | 0,12 | 25,00 | 0,0556 | 0,0070 | |||
| PAYS / Paysign, Inc. | 0,01 | 0,00 | 0,07 | 242,86 | 0,0333 | 0,0226 | |||
| RIG / Transocean Ltd. | 0,03 | 12,92 | 0,07 | -8,22 | 0,0314 | -0,0058 | |||
| AAME / Atlantic American Corporation | 0,02 | 0,00 | 0,04 | 26,67 | 0,0177 | 0,0023 | |||
| USIO / Usio, Inc. | 0,02 | 0,00 | 0,03 | 3,45 | 0,0142 | -0,0006 | |||
| PLUG / Plug Power Inc. | 0,01 | 0,01 | 0,0069 | 0,0069 | |||||
| XLO / Xilio Therapeutics, Inc. | 0,01 | 0,00 | 0,01 | -14,29 | 0,0031 | -0,0005 | |||
| FDX / FedEx Corporation | 0,00 | -100,00 | 0,00 | 0,0000 | |||||
| CPB / The Campbell's Company | 0,00 | -100,00 | 0,00 | 0,0000 | |||||
| OXY.WS / Occidental Petroleum Corporation - Equity Warrant | 0,00 | -100,00 | 0,00 | 0,0000 |