Statistiques de base
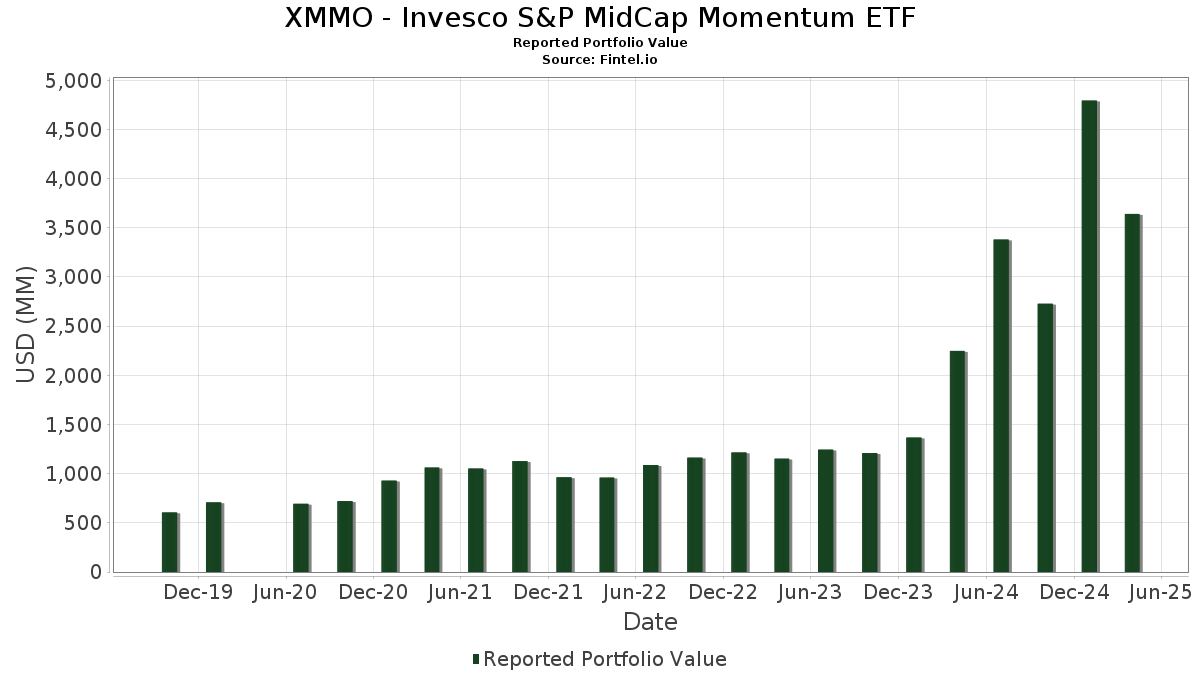
| Valeur du portefeuille | $ 3 640 811 805 |
| Positions actuelles | 80 |
Dernières positions, performances, ASG (à partir des dépôts 13F, 13D)
XMMO - Invesco S&P MidCap Momentum ETF a déclaré un total de 80 positions dans ses derniers dépôts auprès de la SEC. La valeur la plus récente du portefeuille est calculée à 3 640 811 805 USD. Les actifs sous gestion réels (ASG) sont cette valeur plus les liquidités (qui ne sont pas divulguées). Les principales positions de XMMO - Invesco S&P MidCap Momentum ETF sont Interactive Brokers Group, Inc. (US:IBKR) , Sprouts Farmers Market, Inc. (US:SFM) , EMCOR Group, Inc. (US:EME) , Guidewire Software, Inc. (US:GWRE) , and Equitable Holdings, Inc. (US:EQH) . Les nouvelles positions de XMMO - Invesco S&P MidCap Momentum ETF incluent Guidewire Software, Inc. (US:GWRE) , Carpenter Technology Corporation (US:CRS) , RB Global, Inc. (US:RBA) , Duolingo, Inc. (US:DUOL) , and Flex Ltd. (US:FLEX) .
Meilleures augmentations ce trimestre
Nous utilisons la variation de l'allocation du portefeuille car il s'agit de l'indicateur le plus significatif. Les changements peuvent être dus à des transactions ou à des variations de prix des actions.
| Titre | Actions (en millions) |
Valeur ($ en millions) |
% du portefeuille | ΔPortefeuille % |
|---|---|---|---|---|
| 159,96 | 159,96 | 4,6782 | 4,6782 | |
| 0,47 | 95,53 | 2,7938 | 2,7938 | |
| 0,40 | 77,58 | 2,2690 | 2,2690 | |
| 0,59 | 69,60 | 2,0354 | 2,0354 | |
| 0,68 | 68,86 | 2,0137 | 2,0137 | |
| 0,17 | 65,55 | 1,9170 | 1,9170 | |
| 0,86 | 148,55 | 4,3445 | 1,8077 | |
| 60,87 | 60,87 | 1,7802 | 1,7802 | |
| 1,71 | 58,75 | 1,7182 | 1,7182 | |
| 0,60 | 43,31 | 1,2666 | 1,2666 |
Principales baisses ce trimestre
Nous utilisons la variation de l'allocation du portefeuille car il s'agit de l'indicateur le plus significatif. Les changements peuvent être dus à des transactions ou à des variations de prix des actions.
| Titre | Actions (en millions) |
Valeur ($ en millions) |
% du portefeuille | ΔPortefeuille % |
|---|---|---|---|---|
| 0,23 | 43,53 | 1,2731 | -1,7128 | |
| 0,18 | 36,48 | 1,0669 | -1,1371 | |
| 0,00 | 0,00 | -0,9165 | ||
| 0,18 | 61,48 | 1,7981 | -0,6550 | |
| 1,14 | 53,15 | 1,5544 | -0,5677 | |
| 0,28 | 47,18 | 1,3797 | -0,5533 | |
| 0,41 | 58,01 | 1,6966 | -0,5394 | |
| 0,07 | 37,13 | 1,0858 | -0,5139 | |
| 0,11 | 26,56 | 0,7767 | -0,4613 | |
| 0,17 | 27,74 | 0,8111 | -0,4086 |
Déclarations 13F et dépôts de fonds
Ce formulaire a été déposé le 2025-06-27 pour la période de déclaration 2025-04-30. Cliquez sur l'icône du lien pour voir l'historique complet des transactions.
Mettre à niveau pour débloquer les données premium et exporter vers Excel ![]() .
.
| Titre | Type | Prix moyen de l'action | Actions (en millions) |
ΔActions (%) |
ΔActions (%) |
Valeur ($ en millions) |
Portefeuille (%) |
ΔPortefeuille (%) |
|
|---|---|---|---|---|---|---|---|---|---|
| Invesco Private Prime Fund / STIV (N/A) | 159,96 | 159,96 | 4,6782 | 4,6782 | |||||
| IBKR / Interactive Brokers Group, Inc. | 0,86 | 60,23 | 148,55 | 26,64 | 4,3445 | 1,8077 | |||
| SFM / Sprouts Farmers Market, Inc. | 0,79 | -19,22 | 135,75 | -12,76 | 3,9701 | 0,6052 | |||
| EME / EMCOR Group, Inc. | 0,26 | -25,21 | 104,45 | -33,11 | 3,0547 | -0,3224 | |||
| GWRE / Guidewire Software, Inc. | 0,47 | 95,53 | 2,7938 | 2,7938 | |||||
| EQH / Equitable Holdings, Inc. | 1,78 | -17,73 | 87,92 | -25,24 | 2,5714 | 0,0280 | |||
| UNM / Unum Group | 1,08 | 164,47 | 84,26 | 324,89 | 2,4642 | 0,8533 | |||
| USFD / US Foods Holding Corp. | 1,21 | 85,08 | 79,71 | 123,44 | 2,3311 | 1,1725 | |||
| DTM / DT Midstream, Inc. | 0,80 | 5,12 | 78,20 | 1,09 | 2,2868 | 0,6140 | |||
| CRS / Carpenter Technology Corporation | 0,40 | 77,58 | 2,2690 | 2,2690 | |||||
| CASY / Casey's General Stores, Inc. | 0,17 | -21,60 | 76,34 | -14,01 | 2,2326 | 0,3127 | |||
| BJ / BJ's Wholesale Club Holdings, Inc. | 0,59 | 69,60 | 2,0354 | 2,0354 | |||||
| RBA / RB Global, Inc. | 0,68 | 68,86 | 2,0137 | 2,0137 | |||||
| UTHR / United Therapeutics Corporation | 0,22 | 152,67 | 67,56 | 215,51 | 1,9758 | 0,1016 | |||
| DUOL / Duolingo, Inc. | 0,17 | 65,55 | 1,9170 | 1,9170 | |||||
| FIX / Comfort Systems USA, Inc. | 0,16 | -31,23 | 62,61 | -37,40 | 1,8311 | -0,3318 | |||
| CW / Curtiss-Wright Corporation | 0,18 | -45,48 | 61,48 | -45,80 | 1,7981 | -0,6550 | |||
| Invesco Private Government Fund / STIV (N/A) | 60,87 | 60,87 | 1,7802 | 1,7802 | |||||
| FLEX / Flex Ltd. | 1,71 | 58,75 | 1,7182 | 1,7182 | |||||
| THC / Tenet Healthcare Corporation | 0,41 | -44,70 | 58,01 | -43,89 | 1,6966 | -0,5394 | |||
| JEF / Jefferies Financial Group Inc. | 1,14 | -10,88 | 53,15 | -45,84 | 1,5544 | -0,5677 | |||
| EHC / Encompass Health Corporation | 0,45 | -27,89 | 53,04 | -15,02 | 1,5513 | 0,2015 | |||
| OHI / Omega Healthcare Investors, Inc. | 1,26 | 328,78 | 49,09 | 417,15 | 1,4357 | 0,0495 | |||
| MTZ / MasTec, Inc. | 0,38 | 229,94 | 48,08 | 539,72 | 1,4062 | 0,7956 | |||
| TXRH / Texas Roadhouse, Inc. | 0,28 | -42,41 | 47,18 | -47,22 | 1,3797 | -0,5533 | |||
| ORI / Old Republic International Corporation | 1,25 | 5,09 | 47,16 | 8,02 | 1,3793 | 0,4351 | |||
| SF / Stifel Financial Corp. | 0,54 | -9,76 | 46,66 | -33,25 | 1,3647 | -0,1471 | |||
| JLL / Jones Lang LaSalle Incorporated | 0,20 | -8,28 | 46,43 | -26,25 | 1,3577 | -0,0035 | |||
| EWBC / East West Bancorp, Inc. | 0,51 | -24,38 | 44,06 | -37,17 | 1,2884 | -0,2280 | |||
| HLI / Houlihan Lokey, Inc. | 0,27 | -29,86 | 44,02 | -37,44 | 1,2873 | -0,2343 | |||
| RGA / Reinsurance Group of America, Incorporated | 0,23 | -61,65 | 43,53 | -68,47 | 1,2731 | -1,7128 | |||
| GMED / Globus Medical, Inc. | 0,60 | 43,31 | 1,2666 | 1,2666 | |||||
| DKS / DICK'S Sporting Goods, Inc. | 0,22 | 85,93 | 42,14 | 134,15 | 1,2323 | -0,2295 | |||
| EXLS / ExlService Holdings, Inc. | 0,86 | 1 032,56 | 41,66 | 289,55 | 1,2183 | 0,2823 | |||
| FHN / First Horizon Corporation | 2,28 | 41,14 | 1,2032 | 1,2032 | |||||
| EXEL / Exelixis, Inc. | 1,04 | 40,68 | 1,1898 | 1,1898 | |||||
| AR / Antero Resources Corporation | 1,16 | 138,38 | 40,33 | 210,40 | 1,1794 | 0,0422 | |||
| NFG / National Fuel Gas Company | 0,52 | 39,65 | 1,1596 | 1,1596 | |||||
| OGE / OGE Energy Corp. | 0,87 | 39,29 | 1,1489 | 1,1489 | |||||
| CLH / Clean Harbors, Inc. | 0,18 | -33,57 | 37,78 | -39,00 | 1,1050 | -0,2345 | |||
| AIT / Applied Industrial Technologies, Inc. | 0,15 | -36,21 | 37,52 | -40,32 | 1,0972 | -0,2623 | |||
| MUSA / Murphy USA Inc. | 0,07 | -49,37 | 37,13 | -49,81 | 1,0858 | -0,5139 | |||
| MLI / Mueller Industries, Inc. | 0,50 | 37,09 | 1,0848 | 1,0848 | |||||
| EVR / Evercore Inc. | 0,18 | -49,22 | 36,48 | -64,21 | 1,0669 | -1,1371 | |||
| BRBR / BellRing Brands, Inc. | 0,47 | -23,58 | 36,01 | -23,79 | 1,0530 | 0,0313 | |||
| PLNT / Planet Fitness, Inc. | 0,38 | 35,80 | 1,0469 | 1,0469 | |||||
| SEIC / SEI Investments Company | 0,45 | 34,84 | 1,0190 | 1,0190 | |||||
| CART / Maplebear Inc. | 0,87 | 34,68 | 1,0141 | 1,0141 | |||||
| COKE / Coca-Cola Consolidated, Inc. | 0,02 | -41,68 | 33,47 | -42,19 | 0,9790 | -0,2731 | |||
| SNX / TD SYNNEX Corporation | 0,30 | 407,29 | 33,16 | 437,54 | 0,9698 | 0,2379 | |||
| DOCS / Doximity, Inc. | 0,57 | 32,28 | 0,9440 | 0,9440 | |||||
| KD / Kyndryl Holdings, Inc. | 0,99 | -27,02 | 32,26 | -37,67 | 0,9433 | -0,1758 | |||
| RYAN / Ryan Specialty Holdings, Inc. | 0,48 | -12,02 | 31,65 | -13,44 | 0,9256 | 0,1349 | |||
| FLS / Flowserve Corporation | 0,68 | 3,97 | 30,67 | -24,90 | 0,8969 | 0,0138 | |||
| HALO / Halozyme Therapeutics, Inc. | 0,50 | 30,63 | 0,8958 | 0,8958 | |||||
| CBSH / Commerce Bancshares, Inc. | 0,47 | 28,78 | 0,8416 | 0,8416 | |||||
| CHWY / Chewy, Inc. | 0,77 | 28,73 | 0,8402 | 0,8402 | |||||
| CVLT / Commvault Systems, Inc. | 0,17 | -53,14 | 27,74 | -50,83 | 0,8111 | -0,4086 | |||
| LPX / Louisiana-Pacific Corporation | 0,31 | 26,62 | 0,7787 | 0,7787 | |||||
| AYI / Acuity Inc. | 0,11 | -36,70 | 26,56 | -53,61 | 0,7767 | -0,4613 | |||
| JHG / Janus Henderson Group plc | 0,76 | 29,36 | 25,30 | -4,38 | 0,7399 | 0,1677 | |||
| ONB / Old National Bancorp | 1,20 | 24,62 | 0,7199 | 0,7199 | |||||
| ESAB / ESAB Corporation | 0,20 | -30,35 | 24,44 | -32,44 | 0,7147 | -0,0675 | |||
| VNOM / Viper Energy, Inc. | 0,58 | 23,57 | 0,6894 | 0,6894 | |||||
| AM / Antero Midstream Corporation | 1,41 | -12,45 | 23,31 | -9,66 | 0,6817 | 0,1237 | |||
| SNV / Synovus Financial Corp. | 0,53 | 198,70 | 22,87 | 220,45 | 0,6688 | -0,0719 | |||
| AAON / AAON, Inc. | 0,25 | 22,76 | 0,6656 | 0,6656 | |||||
| TXNM / TXNM Energy, Inc. | 0,42 | 385,51 | 22,60 | 511,75 | 0,6611 | 0,1215 | |||
| GTLS / Chart Industries, Inc. | 0,17 | 22,53 | 0,6589 | 0,6589 | |||||
| UMBF / UMB Financial Corporation | 0,24 | 11,88 | 22,51 | -10,26 | 0,6582 | 0,1159 | |||
| VNO / Vornado Realty Trust | 0,61 | 21,66 | 0,6334 | 0,6334 | |||||
| SLM / SLM Corporation | 0,74 | -31,71 | 21,36 | -29,26 | 0,6248 | -0,0283 | |||
| R / Ryder System, Inc. | 0,16 | -24,10 | 21,35 | -34,45 | 0,6242 | -0,0800 | |||
| KNF / Knife River Corporation | 0,22 | -43,91 | 20,81 | -49,43 | 0,6086 | -0,2814 | |||
| CUZ / Cousins Properties Incorporated | 0,62 | 17,02 | 0,4978 | 0,4978 | |||||
| CNO / CNO Financial Group, Inc. | 0,44 | -14,73 | 16,59 | -19,00 | 0,4851 | 0,0422 | |||
| BDC / Belden Inc. | 0,16 | 66,98 | 16,30 | 132,12 | 0,4768 | -0,0938 | |||
| SBRA / Sabra Health Care REIT, Inc. | 0,87 | -25,58 | 15,53 | -20,51 | 0,4542 | 0,0317 | |||
| PPC / Pilgrim's Pride Corporation | 0,22 | -33,96 | 12,19 | -22,55 | 0,3565 | 0,0162 | |||
| US8252528851 / Invesco Government & Agency Portfolio, Institutional Class | 1,49 | 68,81 | 1,49 | 68,94 | 0,0434 | 0,0244 | |||
| EXP / Eagle Materials Inc. | 0,00 | -100,00 | 0,00 | -100,00 | -0,9165 |