Statistiques de base
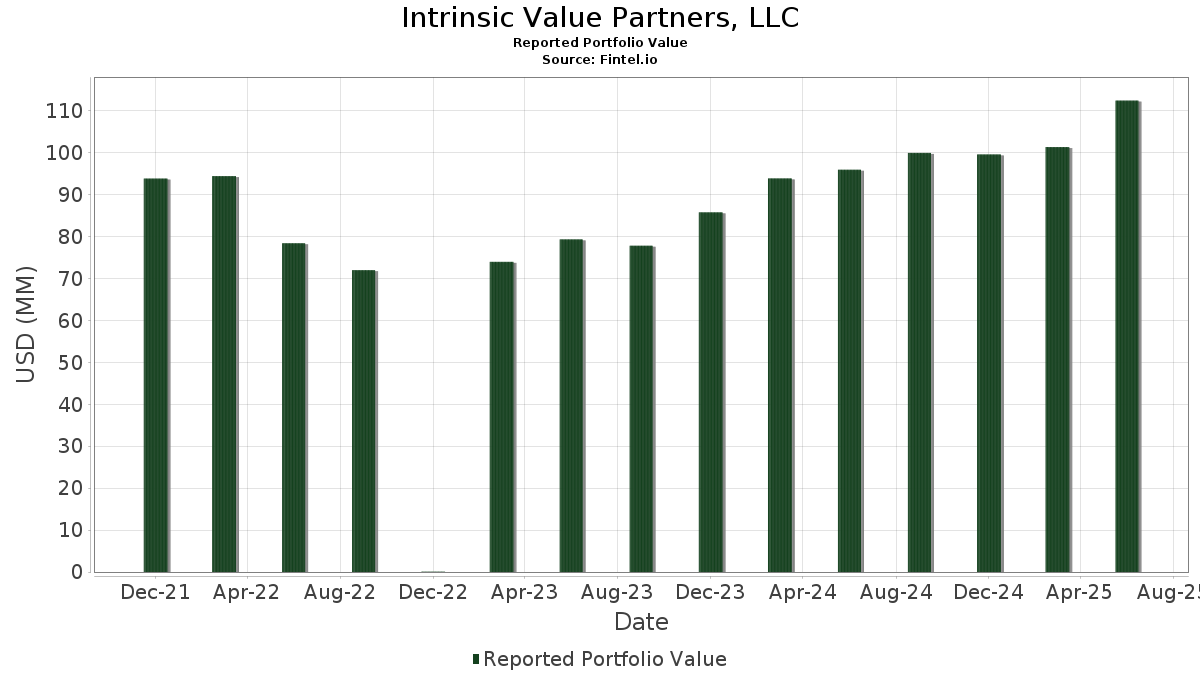
| Valeur du portefeuille | $ 112 394 470 |
| Positions actuelles | 67 |
Dernières positions, performances, ASG (à partir des dépôts 13F, 13D)
Intrinsic Value Partners, LLC a déclaré un total de 67 positions dans ses derniers dépôts auprès de la SEC. La valeur la plus récente du portefeuille est calculée à 112 394 470 USD. Les actifs sous gestion réels (ASG) sont cette valeur plus les liquidités (qui ne sont pas divulguées). Les principales positions de Intrinsic Value Partners, LLC sont Berkshire Hathaway Inc. (US:BRK.B) , Alphabet Inc. (US:GOOG) , Meta Platforms, Inc. (US:META) , The St. Joe Company (US:JOE) , and Taiwan Semiconductor Manufacturing Company Limited - Depositary Receipt (Common Stock) (US:TSM) . Les nouvelles positions de Intrinsic Value Partners, LLC incluent Builders FirstSource, Inc. (US:BLDR) , Applied Materials, Inc. (US:AMAT) , Airbnb, Inc. (US:ABNB) , Capital Group New Geography Equity ETF (US:CGNG) , and International Business Machines Corporation (US:IBM) .
Meilleures augmentations ce trimestre
Nous utilisons la variation de l'allocation du portefeuille car il s'agit de l'indicateur le plus significatif. Les changements peuvent être dus à des transactions ou à des variations de prix des actions.
| Titre | Actions (en millions) |
Valeur ($ en millions) |
% du portefeuille | ΔPortefeuille % |
|---|---|---|---|---|
| 0,01 | 1,74 | 1,5480 | 1,5480 | |
| 0,02 | 5,06 | 4,5004 | 0,7822 | |
| 0,00 | 0,79 | 0,7032 | 0,7032 | |
| 0,02 | 4,17 | 3,7098 | 0,6934 | |
| 0,01 | 6,38 | 5,6771 | 0,6852 | |
| 0,01 | 4,31 | 3,8343 | 0,5319 | |
| 0,02 | 4,28 | 3,8097 | 0,4794 | |
| 0,00 | 0,36 | 0,3222 | 0,3222 | |
| 0,06 | 5,04 | 4,4878 | 0,2971 | |
| 0,01 | 1,53 | 1,3619 | 0,2652 |
Principales baisses ce trimestre
Nous utilisons la variation de l'allocation du portefeuille car il s'agit de l'indicateur le plus significatif. Les changements peuvent être dus à des transactions ou à des variations de prix des actions.
| Titre | Actions (en millions) |
Valeur ($ en millions) |
% du portefeuille | ΔPortefeuille % |
|---|---|---|---|---|
| 0,03 | 15,14 | 13,4669 | -3,3819 | |
| 0,11 | 5,12 | 4,5530 | -0,4752 | |
| 0,03 | 2,96 | 2,6336 | -0,4238 | |
| 0,01 | 0,22 | 0,1968 | -0,4020 | |
| 0,06 | 2,67 | 2,3722 | -0,3719 | |
| 0,02 | 1,21 | 1,0737 | -0,3152 | |
| 0,03 | 0,79 | 0,7067 | -0,3065 | |
| 0,00 | 0,22 | 0,1986 | -0,2488 | |
| 0,01 | 0,73 | 0,6485 | -0,2095 | |
| 0,00 | 0,00 | -0,2076 |
Déclarations 13F et dépôts de fonds
Ce formulaire a été déposé le 2025-07-21 pour la période de déclaration 2025-06-30. Cliquez sur l'icône du lien pour voir l'historique complet des transactions.
Mettre à niveau pour débloquer les données premium et exporter vers Excel ![]() .
.
| Titre | Type | Prix moyen de l'action | Actions (en millions) |
ΔActions (%) |
ΔActions (%) |
Valeur ($ en millions) |
Portefeuille (%) |
ΔPortefeuille (%) |
|
|---|---|---|---|---|---|---|---|---|---|
| BRK.B / Berkshire Hathaway Inc. | 0,03 | -2,79 | 15,14 | -11,33 | 13,4669 | -3,3819 | |||
| GOOG / Alphabet Inc. | 0,05 | -1,56 | 8,76 | 11,76 | 7,7956 | 0,0580 | |||
| META / Meta Platforms, Inc. | 0,01 | -1,48 | 6,38 | 26,16 | 5,6771 | 0,6852 | |||
| JOE / The St. Joe Company | 0,11 | -1,13 | 5,12 | 0,45 | 4,5530 | -0,4752 | |||
| TSM / Taiwan Semiconductor Manufacturing Company Limited - Depositary Receipt (Common Stock) | 0,02 | -1,59 | 5,06 | 34,27 | 4,5004 | 0,7822 | |||
| SCHW / The Charles Schwab Corporation | 0,06 | 1,93 | 5,04 | 18,82 | 4,4878 | 0,2971 | |||
| GOOGL / Alphabet Inc. | 0,03 | 0,95 | 4,57 | 15,03 | 4,0648 | 0,1453 | |||
| MSFT / Microsoft Corporation | 0,01 | -2,79 | 4,31 | 28,82 | 3,8343 | 0,5319 | |||
| GE / General Electric Company | 0,02 | -1,32 | 4,28 | 26,88 | 3,8097 | 0,4794 | |||
| VTV / Vanguard Index Funds - Vanguard Value ETF | 0,02 | 33,35 | 4,17 | 36,42 | 3,7098 | 0,6934 | |||
| AXP / American Express Company | 0,01 | -0,32 | 3,19 | 18,17 | 2,8423 | 0,1742 | |||
| BK / The Bank of New York Mellon Corporation | 0,03 | -12,03 | 2,96 | -4,42 | 2,6336 | -0,4238 | |||
| OXY / Occidental Petroleum Corporation | 0,06 | 12,68 | 2,67 | -4,10 | 2,3722 | -0,3719 | |||
| PAYC / Paycom Software, Inc. | 0,01 | -0,38 | 2,45 | 5,52 | 2,1772 | -0,1119 | |||
| VB / Vanguard Index Funds - Vanguard Small-Cap ETF | 0,01 | 17,85 | 2,26 | 25,95 | 2,0089 | 0,2394 | |||
| J / Jacobs Solutions Inc. | 0,02 | -3,95 | 2,00 | 4,44 | 1,7781 | -0,1106 | |||
| BLDR / Builders FirstSource, Inc. | 0,01 | 1,74 | 1,5480 | 1,5480 | |||||
| JEF / Jefferies Financial Group Inc. | 0,03 | -0,20 | 1,63 | 1,87 | 1,4536 | -0,1292 | |||
| SHOP / Shopify Inc. | 0,01 | -0,60 | 1,58 | 20,08 | 1,4054 | 0,1071 | |||
| IJR / iShares Trust - iShares Core S&P Small-Cap ETF | 0,01 | 31,81 | 1,53 | 37,71 | 1,3619 | 0,2652 | |||
| BKNG / Booking Holdings Inc. | 0,00 | -2,40 | 1,41 | 22,68 | 1,2568 | 0,1200 | |||
| UI / Ubiquiti Inc. | 0,00 | -1,71 | 1,28 | 30,51 | 1,1387 | 0,1704 | |||
| WFC / Wells Fargo & Company | 0,02 | -0,61 | 1,22 | 10,95 | 1,0822 | -0,0001 | |||
| MRK / Merck & Co., Inc. | 0,02 | -2,76 | 1,21 | -14,29 | 1,0737 | -0,3152 | |||
| VXUS / Vanguard STAR Funds - Vanguard Total International Stock ETF | 0,01 | 27,69 | 0,97 | 42,14 | 0,8616 | 0,1888 | |||
| XLE / The Select Sector SPDR Trust - The Energy Select Sector SPDR Fund | 0,01 | 3,17 | 0,88 | -6,47 | 0,7856 | -0,1452 | |||
| ICE / Intercontinental Exchange, Inc. | 0,00 | -1,73 | 0,87 | 4,55 | 0,7768 | -0,0477 | |||
| CRBG / Corebridge Financial, Inc. | 0,02 | 1,04 | 0,86 | 13,68 | 0,7691 | 0,0181 | |||
| NVDD / Direxion Shares ETF Trust - Direxion Daily NVDA Bear 1X Shares | 0,01 | -7,38 | 0,85 | 35,02 | 0,7584 | 0,1352 | |||
| ASML / ASML Holding N.V. - Depositary Receipt (Common Stock) | 0,00 | -0,48 | 0,83 | 20,35 | 0,7422 | 0,0581 | |||
| MKL / Markel Group Inc. | 0,00 | -0,98 | 0,81 | 5,74 | 0,7215 | -0,0351 | |||
| PINS / Pinterest, Inc. | 0,02 | -3,15 | 0,80 | 12,13 | 0,7076 | 0,0069 | |||
| MRNA / Moderna, Inc. | 0,03 | -20,49 | 0,79 | -22,61 | 0,7067 | -0,3065 | |||
| AMAT / Applied Materials, Inc. | 0,00 | 0,79 | 0,7032 | 0,7032 | |||||
| VTI / Vanguard Index Funds - Vanguard Total Stock Market ETF | 0,00 | -5,37 | 0,76 | 4,68 | 0,6763 | -0,0407 | |||
| KMX / CarMax, Inc. | 0,01 | -2,79 | 0,73 | -16,23 | 0,6485 | -0,2095 | |||
| BRK.A / Berkshire Hathaway Inc. | 0,00 | 0,00 | 0,73 | -8,77 | 0,6484 | -0,1397 | |||
| BAC / Bank of America Corporation | 0,01 | -1,44 | 0,65 | 11,92 | 0,5767 | 0,0043 | |||
| BA / The Boeing Company | 0,00 | -0,32 | 0,65 | 22,35 | 0,5753 | 0,0541 | |||
| JPM / JPMorgan Chase & Co. | 0,00 | 0,74 | 0,63 | 18,98 | 0,5636 | 0,0384 | |||
| GEV / GE Vernova Inc. | 0,00 | -40,15 | 0,61 | 3,76 | 0,5405 | -0,0375 | |||
| AMZN / Amazon.com, Inc. | 0,00 | 0,00 | 0,58 | 15,25 | 0,5186 | 0,0197 | |||
| ESAB / ESAB Corporation | 0,00 | -1,09 | 0,58 | 2,30 | 0,5141 | -0,0432 | |||
| C / Citigroup Inc. | 0,01 | -9,14 | 0,53 | 8,98 | 0,4752 | -0,0087 | |||
| GEHC / GE HealthCare Technologies Inc. | 0,01 | 4,96 | 0,47 | -3,72 | 0,4154 | -0,0630 | |||
| ORLY / O'Reilly Automotive, Inc. | 0,00 | 1 219,15 | 0,45 | -16,91 | 0,3977 | -0,1339 | |||
| GWW / W.W. Grainger, Inc. | 0,00 | 0,00 | 0,43 | 5,37 | 0,3850 | -0,0206 | |||
| GSCE / GS Connect S&P GSCI Enhanced Commodity Total Return ETN | 0,00 | -1,95 | 0,43 | 27,08 | 0,3803 | 0,0482 | |||
| RKT / Rocket Companies, Inc. | 0,03 | -1,38 | 0,41 | 15,71 | 0,3612 | 0,0154 | |||
| AAPL / Apple Inc. | 0,00 | -1,85 | 0,40 | -9,23 | 0,3589 | -0,0803 | |||
| AMTM / Amentum Holdings, Inc. | 0,02 | 4,98 | 0,39 | 35,99 | 0,3504 | 0,0650 | |||
| TRGP / Targa Resources Corp. | 0,00 | 0,00 | 0,37 | -13,26 | 0,3324 | -0,0923 | |||
| ABNB / Airbnb, Inc. | 0,00 | 0,36 | 0,3222 | 0,3222 | |||||
| CRWD / CrowdStrike Holdings, Inc. | 0,00 | 0,00 | 0,36 | 44,76 | 0,3195 | 0,0741 | |||
| FIGS / FIGS, Inc. | 0,06 | -1,25 | 0,36 | 21,50 | 0,3168 | 0,0272 | |||
| MA / Mastercard Incorporated | 0,00 | -1,56 | 0,35 | 0,85 | 0,3155 | -0,0313 | |||
| PSX / Phillips 66 | 0,00 | -2,56 | 0,34 | -5,90 | 0,2985 | -0,0533 | |||
| TJX / The TJX Companies, Inc. | 0,00 | -8,76 | 0,27 | -7,56 | 0,2402 | -0,0479 | |||
| XOM / Exxon Mobil Corporation | 0,00 | -13,55 | 0,27 | -21,76 | 0,2375 | -0,0987 | |||
| WMT / Walmart Inc. | 0,00 | 0,67 | 0,26 | 11,86 | 0,2357 | 0,0025 | |||
| CGNG / Capital Group New Geography Equity ETF | 0,01 | 0,26 | 0,2333 | 0,2333 | |||||
| IBM / International Business Machines Corporation | 0,00 | 0,24 | 0,2111 | 0,2111 | |||||
| USB / U.S. Bancorp | 0,01 | -10,83 | 0,24 | -4,45 | 0,2105 | -0,0338 | |||
| BABA / Alibaba Group Holding Limited - Depositary Receipt (Common Stock) | 0,00 | -42,59 | 0,22 | -50,77 | 0,1986 | -0,2488 | |||
| INTC / Intel Corporation | 0,01 | -63,04 | 0,22 | -63,53 | 0,1968 | -0,4020 | |||
| COP / ConocoPhillips | 0,00 | 0,00 | 0,22 | -14,57 | 0,1936 | -0,0577 | |||
| COST / Costco Wholesale Corporation | 0,00 | -2,30 | 0,21 | 1,95 | 0,1867 | -0,0158 | |||
| MHK / Mohawk Industries, Inc. | 0,00 | -100,00 | 0,00 | 0,0000 | |||||
| EPD / Enterprise Products Partners L.P. - Limited Partnership | 0,00 | -100,00 | 0,00 | 0,0000 | |||||
| JNJ / Johnson & Johnson | 0,00 | -100,00 | 0,00 | -100,00 | -0,2001 | ||||
| KVUE / Kenvue Inc. | 0,00 | -100,00 | 0,00 | -100,00 | -0,2076 |