Statistiques de base
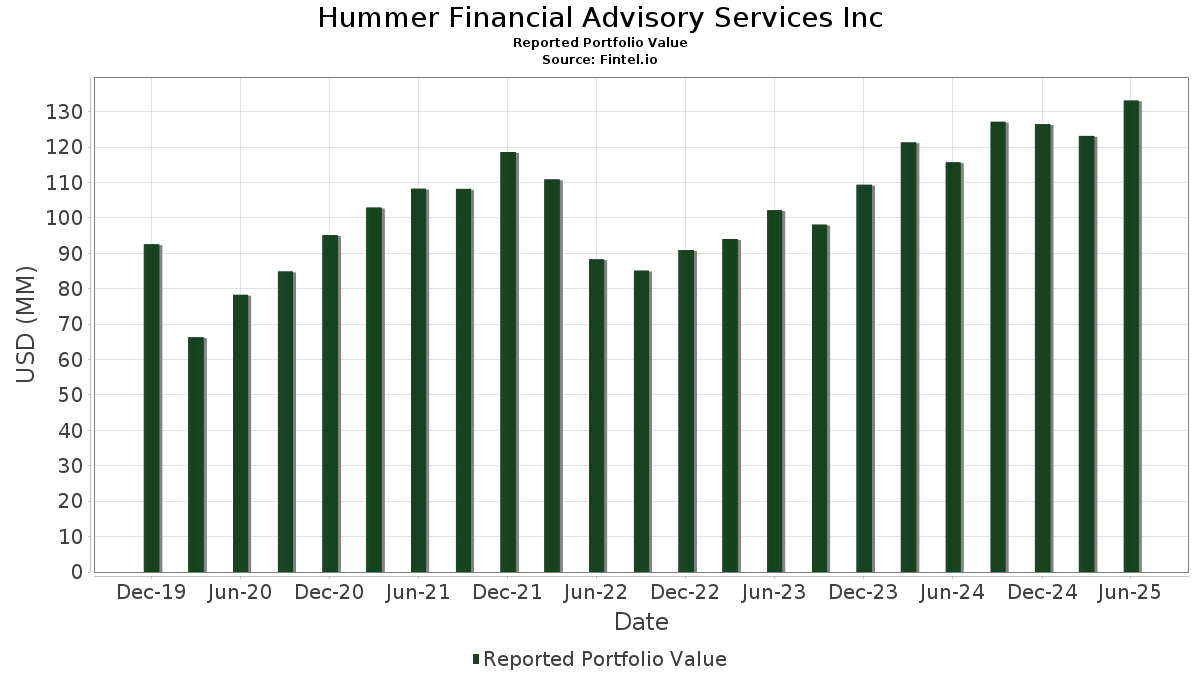
| Valeur du portefeuille | $ 133 134 941 |
| Positions actuelles | 114 |
Dernières positions, performances, ASG (à partir des dépôts 13F, 13D)
Hummer Financial Advisory Services Inc a déclaré un total de 114 positions dans ses derniers dépôts auprès de la SEC. La valeur la plus récente du portefeuille est calculée à 133 134 941 USD. Les actifs sous gestion réels (ASG) sont cette valeur plus les liquidités (qui ne sont pas divulguées). Les principales positions de Hummer Financial Advisory Services Inc sont SPDR S&P 500 ETF (US:SPY) , Accenture plc (US:ACN) , SPDR S&P MidCap 400 ETF Trust (US:MDY) , Amazon.com, Inc. (US:AMZN) , and W.W. Grainger, Inc. (US:GWW) . Les nouvelles positions de Hummer Financial Advisory Services Inc incluent Blackrock ETF Trust - iShares Prime Money Market ETF (US:PMMF) , Blackrock ETF Trust - Ishares Government Money Market ETF (US:GMMF) , Cloudflare, Inc. (US:NET) , Strategy Inc (US:MSTR) , and Palantir Technologies Inc. (US:PLTR) .
Meilleures augmentations ce trimestre
Nous utilisons la variation de l'allocation du portefeuille car il s'agit de l'indicateur le plus significatif. Les changements peuvent être dus à des transactions ou à des variations de prix des actions.
| Titre | Actions (en millions) |
Valeur ($ en millions) |
% du portefeuille | ΔPortefeuille % |
|---|---|---|---|---|
| 0,01 | 1,11 | 0,8302 | 0,8302 | |
| 0,01 | 3,10 | 2,3272 | 0,4316 | |
| 0,03 | 7,50 | 5,6324 | 0,3519 | |
| 0,03 | 20,83 | 15,6421 | 0,3293 | |
| 0,00 | 0,77 | 0,5779 | 0,3166 | |
| 0,00 | 0,40 | 0,3018 | 0,3018 | |
| 0,00 | 1,68 | 1,2611 | 0,2942 | |
| 0,00 | 0,32 | 0,2427 | 0,2427 | |
| 0,00 | 0,26 | 0,1969 | 0,1969 | |
| 0,00 | 0,24 | 0,1822 | 0,1822 |
Principales baisses ce trimestre
Nous utilisons la variation de l'allocation du portefeuille car il s'agit de l'indicateur le plus significatif. Les changements peuvent être dus à des transactions ou à des variations de prix des actions.
| Titre | Actions (en millions) |
Valeur ($ en millions) |
% du portefeuille | ΔPortefeuille % |
|---|---|---|---|---|
| 0,05 | 15,21 | 11,4271 | -1,4697 | |
| 0,02 | 1,82 | 1,3644 | -0,2630 | |
| 0,01 | 1,53 | 1,1461 | -0,2490 | |
| 0,01 | 1,93 | 1,4469 | -0,2263 | |
| 0,01 | 1,74 | 1,3089 | -0,2236 | |
| 0,01 | 1,62 | 1,2153 | -0,2111 | |
| 0,01 | 1,07 | 0,8018 | -0,1789 | |
| 0,01 | 1,61 | 1,2083 | -0,1674 | |
| 0,02 | 9,79 | 7,3537 | -0,1275 | |
| 0,00 | 0,64 | 0,4822 | -0,1268 |
Déclarations 13F et dépôts de fonds
Ce formulaire a été déposé le 2025-07-09 pour la période de déclaration 2025-06-30. Cliquez sur l'icône du lien pour voir l'historique complet des transactions.
Mettre à niveau pour débloquer les données premium et exporter vers Excel ![]() .
.
| Titre | Type | Prix moyen de l'action | Actions (en millions) |
ΔActions (%) |
ΔActions (%) |
Valeur ($ en millions) |
Portefeuille (%) |
ΔPortefeuille (%) |
|
|---|---|---|---|---|---|---|---|---|---|
| SPY / SPDR S&P 500 ETF | 0,03 | 0,00 | 20,83 | 10,43 | 15,6421 | 0,3293 | |||
| ACN / Accenture plc | 0,05 | 0,00 | 15,21 | -4,21 | 11,4271 | -1,4697 | |||
| MDY / SPDR S&P MidCap 400 ETF Trust | 0,02 | 0,00 | 9,79 | 6,26 | 7,3537 | -0,1275 | |||
| AMZN / Amazon.com, Inc. | 0,03 | 0,00 | 7,50 | 15,30 | 5,6324 | 0,3519 | |||
| GWW / W.W. Grainger, Inc. | 0,00 | 0,48 | 3,50 | 5,80 | 2,6300 | -0,0571 | |||
| MSFT / Microsoft Corporation | 0,01 | 0,16 | 3,10 | 32,73 | 2,3272 | 0,4316 | |||
| VB / Vanguard Index Funds - Vanguard Small-Cap ETF | 0,01 | 4,45 | 2,79 | 12,00 | 2,0961 | 0,0728 | |||
| JPM / JPMorgan Chase & Co. | 0,01 | 0,00 | 2,55 | 18,18 | 1,9141 | 0,1633 | |||
| QQQ / Invesco QQQ Trust, Series 1 | 0,00 | 0,00 | 2,41 | 17,61 | 1,8110 | 0,1460 | |||
| PG / The Procter & Gamble Company | 0,01 | 0,00 | 1,93 | -6,50 | 1,4469 | -0,2263 | |||
| ADSK / Autodesk, Inc. | 0,01 | 0,82 | 1,90 | 19,24 | 1,4300 | 0,1333 | |||
| XOM / Exxon Mobil Corporation | 0,02 | -0,01 | 1,82 | -9,38 | 1,3644 | -0,2630 | |||
| SNA / Snap-on Incorporated | 0,01 | 0,00 | 1,74 | -7,68 | 1,3089 | -0,2236 | |||
| IVV / iShares Trust - iShares Core S&P 500 ETF | 0,00 | 27,61 | 1,68 | 41,01 | 1,2611 | 0,2942 | |||
| JNJ / Johnson & Johnson | 0,01 | 0,00 | 1,62 | -7,92 | 1,2153 | -0,2111 | |||
| RPM / RPM International Inc. | 0,01 | 0,00 | 1,61 | -5,08 | 1,2083 | -0,1674 | |||
| ADP / Automatic Data Processing, Inc. | 0,00 | 0,00 | 1,53 | 0,99 | 1,1524 | -0,0819 | |||
| ABBV / AbbVie Inc. | 0,01 | 0,24 | 1,53 | -11,23 | 1,1461 | -0,2490 | |||
| GOOGL / Alphabet Inc. | 0,01 | -0,47 | 1,52 | 13,03 | 1,1405 | 0,0496 | |||
| CTAS / Cintas Corporation | 0,01 | 0,00 | 1,25 | 8,52 | 0,9374 | 0,0029 | |||
| WEC / WEC Energy Group, Inc. | 0,01 | 0,00 | 1,21 | -4,34 | 0,9096 | -0,1188 | |||
| HD / The Home Depot, Inc. | 0,00 | 0,00 | 1,19 | 0,00 | 0,8950 | -0,0722 | |||
| VGSH / Vanguard Scottsdale Funds - Vanguard Short-Term Treasury ETF | 0,02 | 0,00 | 1,18 | 0,17 | 0,8830 | -0,0701 | |||
| PMMF / Blackrock ETF Trust - iShares Prime Money Market ETF | 0,01 | 1,11 | 0,8302 | 0,8302 | |||||
| ABT / Abbott Laboratories | 0,01 | 0,00 | 1,08 | 2,47 | 0,8111 | -0,0441 | |||
| AAPL / Apple Inc. | 0,01 | -4,30 | 1,07 | -11,60 | 0,8018 | -0,1789 | |||
| QCOM / QUALCOMM Incorporated | 0,01 | 0,00 | 1,01 | 3,68 | 0,7620 | -0,0325 | |||
| RTX / RTX Corporation | 0,01 | -0,74 | 0,98 | 9,52 | 0,7346 | 0,0088 | |||
| SCUS / Schwab Strategic Trust - Schwab Ultra-Short Income ETF | 0,04 | -5,97 | 0,95 | -5,93 | 0,7152 | -0,1071 | |||
| PSA / Public Storage | 0,00 | 0,00 | 0,95 | -1,96 | 0,7150 | -0,0734 | |||
| CPT / Camden Property Trust | 0,01 | 0,00 | 0,94 | -7,78 | 0,7039 | -0,1213 | |||
| LLY / Eli Lilly and Company | 0,00 | 0,33 | 0,94 | -5,27 | 0,7026 | -0,0995 | |||
| MMM / 3M Company | 0,01 | 0,00 | 0,88 | 3,65 | 0,6616 | -0,0284 | |||
| EXR / Extra Space Storage Inc. | 0,01 | 0,00 | 0,87 | -0,80 | 0,6556 | -0,0582 | |||
| PH / Parker-Hannifin Corporation | 0,00 | 0,00 | 0,85 | 14,98 | 0,6401 | 0,0379 | |||
| BLK / BlackRock, Inc. | 0,00 | 4,67 | 0,82 | 16,08 | 0,6187 | 0,0423 | |||
| MCD / McDonald's Corporation | 0,00 | -2,83 | 0,80 | -9,16 | 0,6035 | -0,1143 | |||
| MPC / Marathon Petroleum Corporation | 0,00 | 0,00 | 0,79 | 14,08 | 0,5904 | 0,0306 | |||
| AVAV / AeroVironment, Inc. | 0,00 | 0,00 | 0,77 | 139,56 | 0,5779 | 0,3166 | |||
| NVDA / NVIDIA Corporation | 0,00 | 0,44 | 0,72 | 46,42 | 0,5382 | 0,1408 | |||
| CSCO / Cisco Systems, Inc. | 0,01 | -1,00 | 0,68 | 11,24 | 0,5136 | 0,0147 | |||
| EMR / Emerson Electric Co. | 0,00 | 1,02 | 0,66 | 22,72 | 0,4957 | 0,0595 | |||
| VO / Vanguard Index Funds - Vanguard Mid-Cap ETF | 0,00 | 27,79 | 0,65 | 38,71 | 0,4851 | 0,1073 | |||
| GOOGL / Alphabet Inc. | 0,00 | 0,00 | 0,64 | 14,03 | 0,4825 | 0,0248 | |||
| CVX / Chevron Corporation | 0,00 | 0,00 | 0,64 | -14,42 | 0,4822 | -0,1268 | |||
| ITW / Illinois Tool Works Inc. | 0,00 | 10,43 | 0,63 | 10,12 | 0,4746 | 0,0086 | |||
| NFLX / Netflix, Inc. | 0,00 | 0,88 | 0,61 | 44,79 | 0,4597 | 0,1167 | |||
| AON / Aon plc | 0,00 | 0,00 | 0,61 | -10,60 | 0,4564 | -0,0955 | |||
| IBM / International Business Machines Corporation | 0,00 | 0,00 | 0,60 | 18,43 | 0,4543 | 0,0400 | |||
| WMT / Walmart Inc. | 0,01 | 0,00 | 0,59 | 11,26 | 0,4454 | 0,0119 | |||
| DTE / DTE Energy Company | 0,00 | 0,00 | 0,59 | -4,07 | 0,4427 | -0,0567 | |||
| HON / Honeywell International Inc. | 0,00 | 0,00 | 0,53 | 10,00 | 0,3971 | 0,0068 | |||
| DUK / Duke Energy Corporation | 0,00 | 0,00 | 0,53 | -3,30 | 0,3965 | -0,0466 | |||
| IJH / iShares Trust - iShares Core S&P Mid-Cap ETF | 0,01 | 0,00 | 0,52 | 6,29 | 0,3941 | -0,0067 | |||
| MUB / iShares Trust - iShares National Muni Bond ETF | 0,01 | 0,00 | 0,52 | -0,95 | 0,3924 | -0,0357 | |||
| TSLA / Tesla, Inc. | 0,00 | 1,25 | 0,51 | 24,15 | 0,3865 | 0,0498 | |||
| AVY / Avery Dennison Corporation | 0,00 | 0,00 | 0,51 | -1,35 | 0,3835 | -0,0370 | |||
| INTU / Intuit Inc. | 0,00 | 0,00 | 0,50 | 28,57 | 0,3786 | 0,0595 | |||
| BIL / SPDR Series Trust - SPDR Bloomberg 1-3 Month T-Bill ETF | 0,01 | 1,92 | 0,49 | 2,10 | 0,3652 | -0,0222 | |||
| ALL / The Allstate Corporation | 0,00 | 0,00 | 0,48 | -2,82 | 0,3626 | -0,0405 | |||
| UDR / UDR, Inc. | 0,01 | 0,00 | 0,48 | -9,64 | 0,3595 | -0,0704 | |||
| VTEB / Vanguard Municipal Bond Funds - Vanguard Tax-Exempt Bond ETF | 0,01 | 0,00 | 0,47 | -1,26 | 0,3535 | -0,0333 | |||
| SYK / Stryker Corporation | 0,00 | 0,00 | 0,46 | 6,06 | 0,3425 | -0,0059 | |||
| VRT / Vertiv Holdings Co | 0,00 | 0,00 | 0,45 | 78,17 | 0,3376 | 0,1324 | |||
| MCK / McKesson Corporation | 0,00 | 0,00 | 0,44 | 8,91 | 0,3306 | 0,0023 | |||
| IWM / iShares Trust - iShares Russell 2000 ETF | 0,00 | 0,00 | 0,43 | 8,40 | 0,3201 | 0,0002 | |||
| GE / General Electric Company | 0,00 | -0,73 | 0,42 | 27,58 | 0,3165 | 0,0484 | |||
| SO / The Southern Company | 0,00 | 0,00 | 0,42 | -0,24 | 0,3138 | -0,0259 | |||
| MRK / Merck & Co., Inc. | 0,01 | 0,00 | 0,41 | -11,66 | 0,3073 | -0,0689 | |||
| GMMF / Blackrock ETF Trust - Ishares Government Money Market ETF | 0,00 | 0,40 | 0,3018 | 0,3018 | |||||
| ITM / VanEck ETF Trust - VanEck Intermediate Muni ETF | 0,01 | 0,00 | 0,40 | -0,25 | 0,2988 | -0,0245 | |||
| USB / U.S. Bancorp | 0,01 | 0,00 | 0,38 | 7,14 | 0,2822 | -0,0027 | |||
| NEE / NextEra Energy, Inc. | 0,01 | 0,00 | 0,37 | -2,09 | 0,2816 | -0,0293 | |||
| KR / The Kroger Co. | 0,01 | 0,00 | 0,37 | 6,03 | 0,2773 | -0,0056 | |||
| MKC / McCormick & Company, Incorporated | 0,00 | 0,00 | 0,36 | -8,10 | 0,2734 | -0,0475 | |||
| STE / STERIS plc | 0,00 | 0,00 | 0,36 | 6,19 | 0,2707 | -0,0054 | |||
| BAC / Bank of America Corporation | 0,01 | -1,01 | 0,35 | 12,30 | 0,2611 | 0,0096 | |||
| KMB / Kimberly-Clark Corporation | 0,00 | 0,00 | 0,35 | -9,42 | 0,2606 | -0,0499 | |||
| ORI / Old Republic International Corporation | 0,01 | 0,00 | 0,34 | -2,01 | 0,2573 | -0,0265 | |||
| D / Dominion Energy, Inc. | 0,01 | 0,00 | 0,34 | 0,89 | 0,2548 | -0,0185 | |||
| AMD / Advanced Micro Devices, Inc. | 0,00 | 0,00 | 0,33 | 38,17 | 0,2505 | 0,0544 | |||
| DHR / Danaher Corporation | 0,00 | 0,00 | 0,32 | -3,58 | 0,2430 | -0,0296 | |||
| NET / Cloudflare, Inc. | 0,00 | 0,32 | 0,2427 | 0,2427 | |||||
| CAH / Cardinal Health, Inc. | 0,00 | 0,00 | 0,32 | 22,05 | 0,2414 | 0,0274 | |||
| SHOP / Shopify Inc. | 0,00 | 3,80 | 0,30 | 25,63 | 0,2248 | 0,0310 | |||
| UL / Unilever PLC - Depositary Receipt (Common Stock) | 0,00 | 0,00 | 0,30 | 2,77 | 0,2233 | -0,0117 | |||
| VOO / Vanguard Index Funds - Vanguard S&P 500 ETF | 0,00 | -4,65 | 0,29 | 5,80 | 0,2195 | -0,0050 | |||
| LNT / Alliant Energy Corporation | 0,00 | 0,00 | 0,28 | -5,96 | 0,2135 | -0,0321 | |||
| DLR / Digital Realty Trust, Inc. | 0,00 | 0,00 | 0,28 | 21,40 | 0,2095 | 0,0233 | |||
| CI / The Cigna Group | 0,00 | 0,00 | 0,28 | 0,72 | 0,2088 | -0,0158 | |||
| LHX / L3Harris Technologies, Inc. | 0,00 | 0,00 | 0,28 | 19,57 | 0,2073 | 0,0203 | |||
| KLAC / KLA Corporation | 0,00 | 0,00 | 0,27 | 32,02 | 0,2018 | 0,0362 | |||
| COP / ConocoPhillips | 0,00 | 0,00 | 0,26 | -14,84 | 0,1990 | -0,0528 | |||
| NOW / ServiceNow, Inc. | 0,00 | 0,26 | 0,1969 | 0,1969 | |||||
| STT / State Street Corporation | 0,00 | 0,00 | 0,26 | 19,16 | 0,1917 | 0,0172 | |||
| WFC / Wells Fargo & Company | 0,00 | 0,00 | 0,25 | 11,61 | 0,1881 | 0,0059 | |||
| CLX / The Clorox Company | 0,00 | 0,00 | 0,25 | -18,36 | 0,1870 | -0,0609 | |||
| BOXX / EA Series Trust - Alpha Architect 1-3 Month Box ETF | 0,00 | 0,00 | 0,25 | 0,82 | 0,1862 | -0,0130 | |||
| TMO / Thermo Fisher Scientific Inc. | 0,00 | 0,00 | 0,25 | -18,54 | 0,1851 | -0,0604 | |||
| GPC / Genuine Parts Company | 0,00 | 0,00 | 0,24 | 1,67 | 0,1838 | -0,0114 | |||
| DTM / DT Midstream, Inc. | 0,00 | 0,00 | 0,24 | 14,02 | 0,1834 | 0,0092 | |||
| GSLC / Goldman Sachs ETF Trust - Goldman Sachs ActiveBeta U.S. Large Cap Equity ETF | 0,00 | 0,00 | 0,24 | 10,00 | 0,1823 | 0,0036 | |||
| MSTR / Strategy Inc | 0,00 | 0,24 | 0,1822 | 0,1822 | |||||
| NTRS / Northern Trust Corporation | 0,00 | 0,24 | 0,1820 | 0,1820 | |||||
| CARR / Carrier Global Corporation | 0,00 | 0,23 | 0,1691 | 0,1691 | |||||
| PLTR / Palantir Technologies Inc. | 0,00 | 0,22 | 0,1689 | 0,1689 | |||||
| BRX / Brixmor Property Group Inc. | 0,01 | 0,00 | 0,22 | -2,19 | 0,1682 | -0,0172 | |||
| PAYX / Paychex, Inc. | 0,00 | 0,00 | 0,22 | -5,63 | 0,1639 | -0,0240 | |||
| BBH / VanEck ETF Trust - VanEck Biotech ETF | 0,00 | 0,00 | 0,22 | -2,26 | 0,1623 | -0,0178 | |||
| DOV / Dover Corporation | 0,00 | 0,21 | 0,1610 | 0,1610 | |||||
| GEV / GE Vernova Inc. | 0,00 | 0,21 | 0,1606 | 0,1606 | |||||
| TFX / Teleflex Incorporated | 0,00 | 0,00 | 0,21 | -14,29 | 0,1578 | -0,0414 | |||
| VUSB / Vanguard Bond Index Funds - Vanguard Ultra-Short Bond ETF | 0,00 | 0,00 | 0,21 | 0,00 | 0,1573 | -0,0127 | |||
| MDT / Medtronic plc | 0,00 | -2,12 | 0,20 | -5,16 | 0,1523 | -0,0210 | |||
| CAG / Conagra Brands, Inc. | 0,00 | -100,00 | 0,00 | 0,0000 | |||||
| TGT / Target Corporation | 0,00 | -100,00 | 0,00 | 0,0000 | |||||
| BMY / Bristol-Myers Squibb Company | 0,00 | -100,00 | 0,00 | 0,0000 |