Statistiques de base
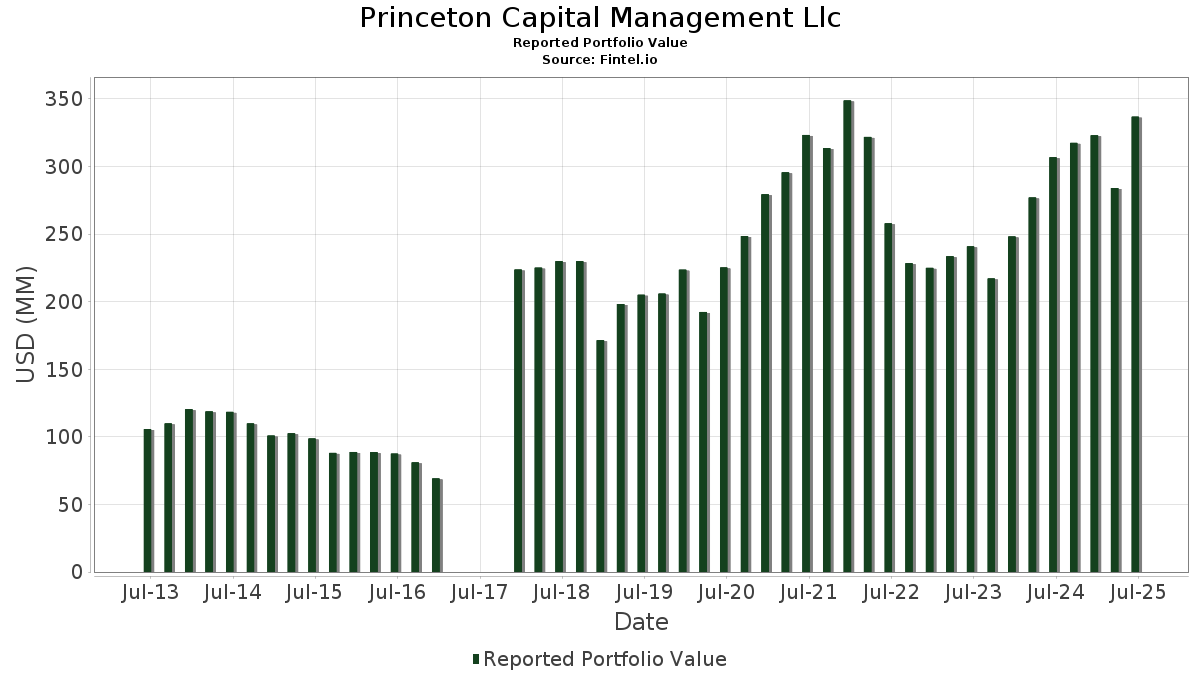
| Valeur du portefeuille | $ 336 818 330 |
| Positions actuelles | 127 |
Dernières positions, performances, ASG (à partir des dépôts 13F, 13D)
Princeton Capital Management Llc a déclaré un total de 127 positions dans ses derniers dépôts auprès de la SEC. La valeur la plus récente du portefeuille est calculée à 336 818 330 USD. Les actifs sous gestion réels (ASG) sont cette valeur plus les liquidités (qui ne sont pas divulguées). Les principales positions de Princeton Capital Management Llc sont NVIDIA Corporation (US:NVDA) , Apple Inc. (US:AAPL) , Microsoft Corporation (US:MSFT) , Amazon.com, Inc. (US:AMZN) , and CrowdStrike Holdings, Inc. (US:CRWD) . Les nouvelles positions de Princeton Capital Management Llc incluent Centrus Energy Corp. (US:LEU) , IonQ, Inc. (US:IONQ) , The Charles Schwab Corporation (US:SCHW) , EQT Corporation (US:EQT) , and Coherent Corp. (US:COHR) .
Meilleures augmentations ce trimestre
Nous utilisons la variation de l'allocation du portefeuille car il s'agit de l'indicateur le plus significatif. Les changements peuvent être dus à des transactions ou à des variations de prix des actions.
| Titre | Actions (en millions) |
Valeur ($ en millions) |
% du portefeuille | ΔPortefeuille % |
|---|---|---|---|---|
| 0,41 | 65,31 | 19,3912 | 3,3190 | |
| 0,03 | 10,63 | 3,1574 | 1,0368 | |
| 0,03 | 8,23 | 2,4433 | 0,8035 | |
| 0,02 | 7,32 | 2,1738 | 0,6003 | |
| 0,03 | 16,87 | 5,0085 | 0,5342 | |
| 0,01 | 1,75 | 0,5210 | 0,5210 | |
| 0,01 | 4,85 | 1,4395 | 0,4079 | |
| 0,00 | 3,10 | 0,9210 | 0,3810 | |
| 0,05 | 25,84 | 7,6727 | 0,3268 | |
| 0,01 | 1,75 | 0,5183 | 0,1433 |
Principales baisses ce trimestre
Nous utilisons la variation de l'allocation du portefeuille car il s'agit de l'indicateur le plus significatif. Les changements peuvent être dus à des transactions ou à des variations de prix des actions.
| Titre | Actions (en millions) |
Valeur ($ en millions) |
% du portefeuille | ΔPortefeuille % |
|---|---|---|---|---|
| 0,13 | 26,74 | 7,9402 | -2,5367 | |
| 0,02 | 11,81 | 3,5059 | -0,9745 | |
| 0,01 | 6,44 | 1,9132 | -0,6528 | |
| 0,12 | 25,29 | 7,5096 | -0,5000 | |
| 0,09 | 15,72 | 4,6659 | -0,4733 | |
| 0,02 | 3,01 | 0,8941 | -0,3291 | |
| 0,01 | 5,74 | 1,7036 | -0,3174 | |
| 0,02 | 1,17 | 0,3482 | -0,2792 | |
| 0,04 | 6,11 | 1,8149 | -0,2727 | |
| 0,01 | 2,85 | 0,8449 | -0,2394 |
Déclarations 13F et dépôts de fonds
Ce formulaire a été déposé le 2025-08-06 pour la période de déclaration 2025-06-30. Cliquez sur l'icône du lien pour voir l'historique complet des transactions.
Mettre à niveau pour débloquer les données premium et exporter vers Excel ![]() .
.
| Titre | Type | Prix moyen de l'action | Actions (en millions) |
ΔActions (%) |
ΔActions (%) |
Valeur ($ en millions) |
Portefeuille (%) |
ΔPortefeuille (%) |
|
|---|---|---|---|---|---|---|---|---|---|
| NVDA / NVIDIA Corporation | 0,41 | -1,87 | 65,31 | 43,05 | 19,3912 | 3,3190 | |||
| AAPL / Apple Inc. | 0,13 | -2,72 | 26,74 | -10,14 | 7,9402 | -2,5367 | |||
| MSFT / Microsoft Corporation | 0,05 | -6,54 | 25,84 | 23,84 | 7,6727 | 0,3268 | |||
| AMZN / Amazon.com, Inc. | 0,12 | -3,60 | 25,29 | 11,16 | 7,5096 | -0,5000 | |||
| CRWD / CrowdStrike Holdings, Inc. | 0,03 | -8,12 | 16,87 | 32,72 | 5,0085 | 0,5342 | |||
| GOOGL / Alphabet Inc. | 0,09 | -5,55 | 15,72 | 7,64 | 4,6659 | -0,4733 | |||
| LLY / Eli Lilly and Company | 0,02 | -1,71 | 11,81 | -7,23 | 3,5059 | -0,9745 | |||
| PWR / Quanta Services, Inc. | 0,03 | 18,68 | 10,63 | 76,53 | 3,1574 | 1,0368 | |||
| AVGO / Broadcom Inc. | 0,03 | 7,30 | 8,23 | 76,66 | 2,4433 | 0,8035 | |||
| ZS / Zscaler, Inc. | 0,02 | 3,52 | 7,32 | 63,78 | 2,1738 | 0,6003 | |||
| VRTX / Vertex Pharmaceuticals Incorporated | 0,01 | -3,73 | 6,44 | -11,59 | 1,9132 | -0,6528 | |||
| OLED / Universal Display Corporation | 0,04 | -6,92 | 6,11 | 3,07 | 1,8149 | -0,2727 | |||
| MA / Mastercard Incorporated | 0,01 | -2,52 | 5,74 | -0,07 | 1,7036 | -0,3174 | |||
| JPM / JPMorgan Chase & Co. | 0,02 | 0,61 | 5,54 | 18,93 | 1,6451 | 0,0048 | |||
| GEV / GE Vernova Inc. | 0,01 | -4,55 | 4,85 | 65,46 | 1,4395 | 0,4079 | |||
| COST / Costco Wholesale Corporation | 0,00 | 3,61 | 3,72 | 8,43 | 1,1039 | -0,1029 | |||
| GE / General Electric Company | 0,01 | -0,30 | 3,38 | 28,24 | 1,0033 | 0,0755 | |||
| META / Meta Platforms, Inc. | 0,00 | 57,89 | 3,10 | 102,22 | 0,9210 | 0,3810 | |||
| QCOM / QUALCOMM Incorporated | 0,02 | -16,41 | 3,01 | -13,33 | 0,8941 | -0,3291 | |||
| RTX / RTX Corporation | 0,02 | 5,92 | 2,92 | 16,77 | 0,8662 | -0,0133 | |||
| AMT / American Tower Corporation | 0,01 | -9,04 | 2,85 | -7,63 | 0,8449 | -0,2394 | |||
| DELL / Dell Technologies Inc. | 0,02 | 2,57 | 2,60 | 37,94 | 0,7709 | 0,1084 | |||
| NXPI / NXP Semiconductors N.V. | 0,01 | -15,64 | 2,57 | -3,02 | 0,7619 | -0,1696 | |||
| GOOG / Alphabet Inc. | 0,01 | -17,73 | 2,41 | -6,56 | 0,7150 | -0,1925 | |||
| DE / Deere & Company | 0,00 | -5,35 | 2,36 | 2,52 | 0,6997 | -0,1093 | |||
| MRVL / Marvell Technology, Inc. | 0,03 | 1,61 | 2,12 | 27,79 | 0,6280 | 0,0451 | |||
| TSLA / Tesla, Inc. | 0,01 | 4,87 | 2,05 | 28,57 | 0,6094 | 0,0473 | |||
| C / Citigroup Inc. | 0,02 | -12,59 | 1,94 | 4,81 | 0,5755 | -0,0755 | |||
| UBER / Uber Technologies, Inc. | 0,02 | 3,21 | 1,92 | 32,16 | 0,5700 | 0,0586 | |||
| DIS / The Walt Disney Company | 0,02 | -15,82 | 1,87 | 5,77 | 0,5555 | -0,0672 | |||
| CAT / Caterpillar Inc. | 0,00 | -3,44 | 1,85 | 13,64 | 0,5495 | -0,0237 | |||
| TFC / Truist Financial Corporation | 0,04 | 20,66 | 1,83 | 26,07 | 0,5428 | 0,0323 | |||
| LEU / Centrus Energy Corp. | 0,01 | 1,75 | 0,5210 | 0,5210 | |||||
| EVR / Evercore Inc. | 0,01 | 21,20 | 1,75 | 63,85 | 0,5183 | 0,1433 | |||
| BAC / Bank of America Corporation | 0,04 | -6,50 | 1,71 | 6,01 | 0,5081 | -0,0601 | |||
| NOW / ServiceNow, Inc. | 0,00 | 14,22 | 1,63 | 47,47 | 0,4853 | 0,0952 | |||
| ACM / AECOM | 0,01 | -1,75 | 1,61 | 19,58 | 0,4787 | 0,0041 | |||
| CRM / Salesforce, Inc. | 0,01 | 4,13 | 1,54 | 5,78 | 0,4568 | -0,0551 | |||
| GLW / Corning Incorporated | 0,03 | -10,87 | 1,51 | 2,38 | 0,4476 | -0,0707 | |||
| ABBV / AbbVie Inc. | 0,01 | -11,53 | 1,33 | -21,63 | 0,3950 | -0,2025 | |||
| AMD / Advanced Micro Devices, Inc. | 0,01 | -20,85 | 1,33 | 9,29 | 0,3947 | -0,0334 | |||
| FCX / Freeport-McMoRan Inc. | 0,03 | 10,53 | 1,24 | 26,55 | 0,3696 | 0,0233 | |||
| AMGN / Amgen Inc. | 0,00 | -4,55 | 1,22 | -14,48 | 0,3614 | -0,1396 | |||
| NVO / Novo Nordisk A/S - Depositary Receipt (Common Stock) | 0,02 | -33,80 | 1,17 | -34,23 | 0,3482 | -0,2792 | |||
| IVV / iShares Trust - iShares Core S&P 500 ETF | 0,00 | 1,35 | 1,16 | 12,04 | 0,3455 | -0,0203 | |||
| BWXT / BWX Technologies, Inc. | 0,01 | 4,61 | 1,16 | 52,84 | 0,3436 | 0,0769 | |||
| CSCO / Cisco Systems, Inc. | 0,02 | -3,75 | 1,14 | 8,15 | 0,3391 | -0,0324 | |||
| MLM / Martin Marietta Materials, Inc. | 0,00 | -19,82 | 0,96 | -7,95 | 0,2855 | -0,0822 | |||
| GTLB / GitLab Inc. | 0,02 | 33,82 | 0,95 | 28,57 | 0,2833 | 0,0218 | |||
| V / Visa Inc. | 0,00 | 0,00 | 0,82 | 1,35 | 0,2447 | -0,0417 | |||
| IRM / Iron Mountain Incorporated | 0,01 | -9,67 | 0,81 | 7,67 | 0,2419 | -0,0244 | |||
| ENTG / Entegris, Inc. | 0,01 | -0,93 | 0,79 | -8,66 | 0,2351 | -0,0701 | |||
| CP / Canadian Pacific Kansas City Limited | 0,01 | -5,91 | 0,67 | 6,14 | 0,2003 | -0,0233 | |||
| MCHP / Microchip Technology Incorporated | 0,01 | -20,73 | 0,65 | 15,22 | 0,1936 | -0,0056 | |||
| PR / Permian Resources Corporation | 0,05 | -1,57 | 0,65 | -3,27 | 0,1935 | -0,0435 | |||
| REGN / Regeneron Pharmaceuticals, Inc. | 0,00 | 1,89 | 0,65 | -15,56 | 0,1933 | -0,0784 | |||
| NU / Nu Holdings Ltd. | 0,05 | 1,17 | 0,62 | 35,73 | 0,1850 | 0,0232 | |||
| LIN / Linde plc | 0,00 | -4,67 | 0,61 | -3,92 | 0,1819 | -0,0426 | |||
| GBTC / Grayscale Bitcoin Trust (BTC) | 0,01 | 20,52 | 0,57 | 56,79 | 0,1682 | 0,0411 | |||
| DUK / Duke Energy Corporation | 0,00 | 0,02 | 0,54 | -3,21 | 0,1611 | -0,0363 | |||
| PFF / iShares Trust - iShares Preferred and Income Securities ETF | 0,02 | 41,07 | 0,52 | 40,76 | 0,1539 | 0,0244 | |||
| MCK / McKesson Corporation | 0,00 | 0,14 | 0,51 | 9,01 | 0,1510 | -0,0132 | |||
| SNPS / Synopsys, Inc. | 0,00 | -16,12 | 0,50 | 0,20 | 0,1489 | -0,0272 | |||
| VOO / Vanguard Index Funds - Vanguard S&P 500 ETF | 0,00 | 8,49 | 0,49 | 19,95 | 0,1466 | 0,0018 | |||
| VCSH / Vanguard Scottsdale Funds - Vanguard Short-Term Corporate Bond ETF | 0,01 | 84,75 | 0,49 | 86,36 | 0,1461 | 0,0530 | |||
| VMC / Vulcan Materials Company | 0,00 | 0,00 | 0,49 | 11,75 | 0,1442 | -0,0087 | |||
| IONQ / IonQ, Inc. | 0,01 | 0,47 | 0,1398 | 0,1398 | |||||
| HUBS / HubSpot, Inc. | 0,00 | -14,23 | 0,47 | -16,55 | 0,1395 | -0,0584 | |||
| MCD / McDonald's Corporation | 0,00 | 0,00 | 0,45 | -6,49 | 0,1330 | -0,0356 | |||
| GJR / Strats Trust For Procter & Gambel Security - Preferred Security | 0,00 | 0,00 | 0,44 | -6,62 | 0,1299 | -0,0348 | |||
| PEGA / Pegasystems Inc. | 0,01 | 100,00 | 0,43 | 55,76 | 0,1286 | 0,0307 | |||
| SCHW / The Charles Schwab Corporation | 0,00 | 0,43 | 0,1272 | 0,1272 | |||||
| BA / The Boeing Company | 0,00 | -13,66 | 0,42 | 6,02 | 0,1258 | -0,0148 | |||
| GS / The Goldman Sachs Group, Inc. | 0,00 | 0,00 | 0,42 | 29,81 | 0,1242 | 0,0105 | |||
| HD / The Home Depot, Inc. | 0,00 | 0,09 | 0,42 | 0,00 | 0,1233 | -0,0228 | |||
| PYPL / PayPal Holdings, Inc. | 0,01 | -17,48 | 0,41 | -5,94 | 0,1224 | -0,0320 | |||
| FBNC / First Bancorp | 0,01 | 20,60 | 0,39 | 32,53 | 0,1150 | 0,0121 | |||
| WTFC / Wintrust Financial Corporation | 0,00 | 19,44 | 0,38 | 31,49 | 0,1131 | 0,0113 | |||
| IJH / iShares Trust - iShares Core S&P Mid-Cap ETF | 0,01 | 0,00 | 0,37 | 6,41 | 0,1085 | -0,0125 | |||
| VUG / Vanguard Index Funds - Vanguard Growth ETF | 0,00 | 43,88 | 0,36 | 69,81 | 0,1071 | 0,0325 | |||
| VZ / Verizon Communications Inc. | 0,01 | -0,28 | 0,36 | -5,05 | 0,1062 | -0,0262 | |||
| HWC / Hancock Whitney Corporation | 0,01 | 19,23 | 0,36 | 30,51 | 0,1057 | 0,0097 | |||
| DY / Dycom Industries, Inc. | 0,00 | -17,00 | 0,35 | 33,21 | 0,1048 | 0,0115 | |||
| BANR / Banner Corporation | 0,01 | 23,36 | 0,34 | 24,26 | 0,1006 | 0,0045 | |||
| MTB / M&T Bank Corporation | 0,00 | 0,33 | 0,0975 | 0,0975 | |||||
| MDB / MongoDB, Inc. | 0,00 | -33,94 | 0,33 | -20,92 | 0,0967 | -0,0483 | |||
| AXP / American Express Company | 0,00 | 0,00 | 0,32 | 18,68 | 0,0962 | -0,0000 | |||
| ISRG / Intuitive Surgical, Inc. | 0,00 | 44,23 | 0,32 | 58,21 | 0,0947 | 0,0237 | |||
| PNC / The PNC Financial Services Group, Inc. | 0,00 | 0,31 | 0,0924 | 0,0924 | |||||
| CCBG / Capital City Bank Group, Inc. | 0,01 | 0,00 | 0,30 | 9,42 | 0,0898 | -0,0075 | |||
| HON / Honeywell International Inc. | 0,00 | 0,00 | 0,30 | 9,89 | 0,0893 | -0,0070 | |||
| PANW / Palo Alto Networks, Inc. | 0,00 | 0,00 | 0,30 | 20,00 | 0,0893 | 0,0010 | |||
| BY / Byline Bancorp, Inc. | 0,01 | 0,00 | 0,30 | 2,40 | 0,0889 | -0,0143 | |||
| TJX / The TJX Companies, Inc. | 0,00 | 0,00 | 0,29 | 1,38 | 0,0870 | -0,0147 | |||
| LMT / Lockheed Martin Corporation | 0,00 | -10,43 | 0,29 | -7,05 | 0,0862 | -0,0239 | |||
| UNTY / Unity Bancorp, Inc. | 0,01 | 0,00 | 0,29 | 15,73 | 0,0854 | -0,0021 | |||
| CVX / Chevron Corporation | 0,00 | -7,30 | 0,29 | -20,61 | 0,0847 | -0,0419 | |||
| CIVB / Civista Bancshares, Inc. | 0,01 | 0,00 | 0,28 | 18,91 | 0,0842 | 0,0001 | |||
| XOM / Exxon Mobil Corporation | 0,00 | 0,00 | 0,28 | -9,29 | 0,0841 | -0,0259 | |||
| EQT / EQT Corporation | 0,00 | 0,28 | 0,0831 | 0,0831 | |||||
| COHR / Coherent Corp. | 0,00 | 0,28 | 0,0829 | 0,0829 | |||||
| KO / The Coca-Cola Company | 0,00 | 1,95 | 0,28 | 0,73 | 0,0824 | -0,0146 | |||
| WFC / Wells Fargo & Company | 0,00 | 0,27 | 0,0804 | 0,0804 | |||||
| UNP / Union Pacific Corporation | 0,00 | 0,00 | 0,26 | -2,60 | 0,0778 | -0,0169 | |||
| T / AT&T Inc. | 0,01 | -1,43 | 0,26 | 0,78 | 0,0770 | -0,0135 | |||
| MGM / MGM Resorts International | 0,01 | 0,00 | 0,26 | 15,77 | 0,0766 | -0,0017 | |||
| CFR / Cullen/Frost Bankers, Inc. | 0,00 | 0,26 | 0,0763 | 0,0763 | |||||
| MC / Moelis & Company | 0,00 | 0,00 | 0,25 | 6,87 | 0,0740 | -0,0082 | |||
| OSBC / Old Second Bancorp, Inc. | 0,01 | 0,00 | 0,24 | 6,55 | 0,0725 | -0,0081 | |||
| CB / Chubb Limited | 0,00 | 10,20 | 0,24 | 5,63 | 0,0725 | -0,0088 | |||
| HTB / HomeTrust Bancshares, Inc. | 0,01 | 0,00 | 0,24 | 9,46 | 0,0722 | -0,0062 | |||
| BLK / BlackRock, Inc. | 0,00 | 6,60 | 0,24 | 18,50 | 0,0704 | -0,0002 | |||
| BX / Blackstone Inc. | 0,00 | 0,00 | 0,23 | 6,88 | 0,0693 | -0,0075 | |||
| RIO / Rio Tinto Group - Depositary Receipt (Common Stock) | 0,00 | -9,77 | 0,23 | -12,17 | 0,0686 | -0,0242 | |||
| VYM / Vanguard Whitehall Funds - Vanguard High Dividend Yield ETF | 0,00 | 0,00 | 0,23 | 3,14 | 0,0685 | -0,0101 | |||
| SF / Stifel Financial Corp. | 0,00 | 0,23 | 0,0678 | 0,0678 | |||||
| CRWV / CoreWeave, Inc. | 0,00 | 0,23 | 0,0677 | 0,0677 | |||||
| LITE / Lumentum Holdings Inc. | 0,00 | 0,22 | 0,0660 | 0,0660 | |||||
| GLD / SPDR Gold Trust | 0,00 | 0,22 | 0,0654 | 0,0654 | |||||
| SBFG / SB Financial Group, Inc. | 0,01 | 0,22 | 0,0647 | 0,0647 | |||||
| PFBC / Preferred Bank | 0,00 | 0,00 | 0,22 | 3,35 | 0,0642 | -0,0094 | |||
| IPGP / IPG Photonics Corporation | 0,00 | -1,04 | 0,22 | 7,50 | 0,0641 | -0,0065 | |||
| PATH / UiPath Inc. | 0,02 | -12,10 | 0,21 | 9,28 | 0,0631 | -0,0054 | |||
| ETN / Eaton Corporation plc | 0,00 | 0,20 | 0,0601 | 0,0601 | |||||
| HTBK / Heritage Commerce Corp | 0,02 | 0,00 | 0,20 | 4,74 | 0,0591 | -0,0081 | |||
| RGTI / Rigetti Computing, Inc. | 0,01 | -0,10 | 0,15 | 50,00 | 0,0438 | 0,0091 | |||
| FLG / Flagstar Financial, Inc. | 0,01 | 18,18 | 0,14 | 7,87 | 0,0409 | -0,0041 | |||
| JNJ / Johnson & Johnson | 0,00 | -100,00 | 0,00 | 0,0000 | |||||
| QLYS / Qualys, Inc. | 0,00 | -100,00 | 0,00 | 0,0000 | |||||
| EQBK / Equity Bancshares, Inc. | 0,00 | -100,00 | 0,00 | 0,0000 | |||||
| KMPR / Kemper Corporation | 0,00 | -100,00 | 0,00 | 0,0000 | |||||
| ZTS / Zoetis Inc. | 0,00 | -100,00 | 0,00 | 0,0000 | |||||
| MRK / Merck & Co., Inc. | 0,00 | -100,00 | 0,00 | 0,0000 | |||||
| HPE / Hewlett Packard Enterprise Company | 0,00 | -100,00 | 0,00 | 0,0000 | |||||
| AXTI / AXT, Inc. | 0,00 | -100,00 | 0,00 | 0,0000 |