Statistiques de base
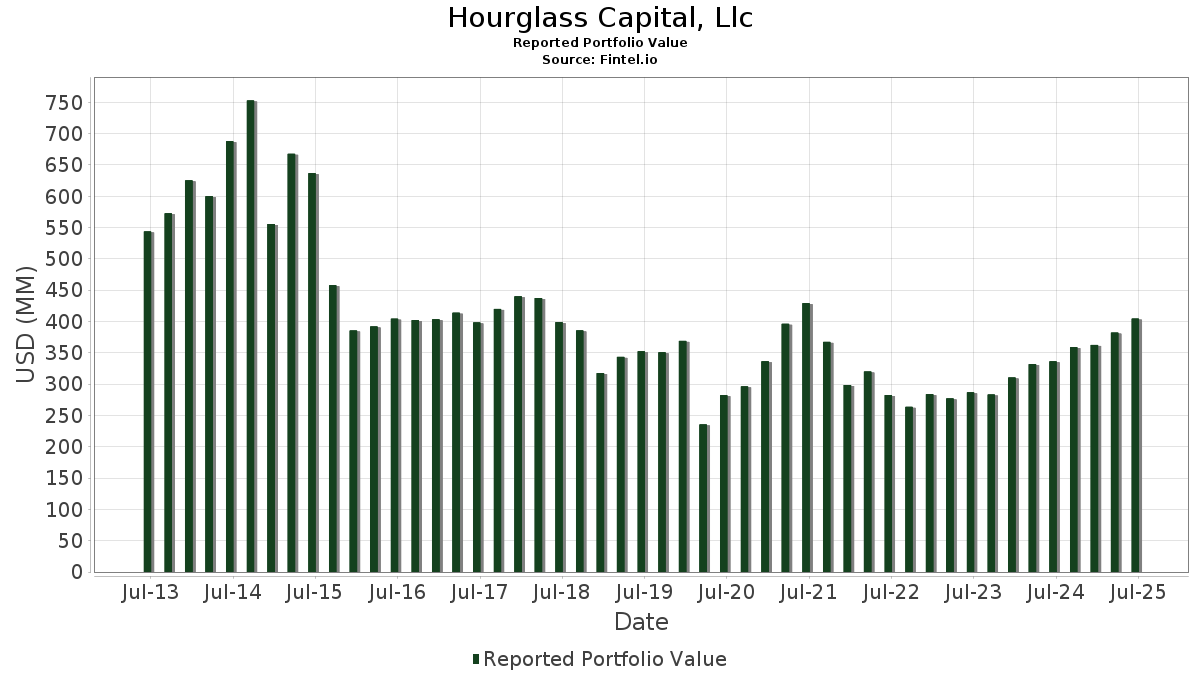
| Valeur du portefeuille | $ 404 537 187 |
| Positions actuelles | 106 |
Dernières positions, performances, ASG (à partir des dépôts 13F, 13D)
Hourglass Capital, Llc a déclaré un total de 106 positions dans ses derniers dépôts auprès de la SEC. La valeur la plus récente du portefeuille est calculée à 404 537 187 USD. Les actifs sous gestion réels (ASG) sont cette valeur plus les liquidités (qui ne sont pas divulguées). Les principales positions de Hourglass Capital, Llc sont The Goldman Sachs Group, Inc. (US:GS) , Cisco Systems, Inc. (US:CSCO) , Oracle Corporation (US:ORCL) , Newmont Corporation (US:NEM) , and LyondellBasell Industries N.V. (US:LYB) . Les nouvelles positions de Hourglass Capital, Llc incluent Biogen Inc. (US:BIIB) , ManpowerGroup Inc. (US:MAN) , .
Meilleures augmentations ce trimestre
Nous utilisons la variation de l'allocation du portefeuille car il s'agit de l'indicateur le plus significatif. Les changements peuvent être dus à des transactions ou à des variations de prix des actions.
| Titre | Actions (en millions) |
Valeur ($ en millions) |
% du portefeuille | ΔPortefeuille % |
|---|---|---|---|---|
| 0,05 | 11,03 | 2,7275 | 0,8458 | |
| 0,18 | 10,68 | 2,6398 | 0,6272 | |
| 0,04 | 6,51 | 1,6083 | 0,5936 | |
| 0,05 | 9,04 | 2,2357 | 0,5832 | |
| 0,05 | 5,77 | 1,4254 | 0,5636 | |
| 0,02 | 2,26 | 0,5579 | 0,5579 | |
| 0,06 | 2,22 | 0,5500 | 0,5500 | |
| 0,02 | 5,80 | 1,4340 | 0,5407 | |
| 0,02 | 12,22 | 3,0213 | 0,5099 | |
| 0,16 | 11,17 | 2,7617 | 0,3447 |
Principales baisses ce trimestre
Nous utilisons la variation de l'allocation du portefeuille car il s'agit de l'indicateur le plus significatif. Les changements peuvent être dus à des transactions ou à des variations de prix des actions.
| Titre | Actions (en millions) |
Valeur ($ en millions) |
% du portefeuille | ΔPortefeuille % |
|---|---|---|---|---|
| 0,04 | 0,94 | 0,2324 | -1,0566 | |
| 0,02 | 1,68 | 0,4141 | -1,0044 | |
| 0,23 | 7,88 | 1,9469 | -0,7389 | |
| 0,03 | 5,78 | 1,4299 | -0,5831 | |
| 0,06 | 5,74 | 1,4189 | -0,5780 | |
| 0,14 | 6,21 | 1,5346 | -0,4781 | |
| 0,03 | 5,57 | 1,3759 | -0,4271 | |
| 0,05 | 9,88 | 2,4427 | -0,3642 | |
| 0,04 | 6,25 | 1,5457 | -0,3536 | |
| 0,15 | 5,77 | 1,4257 | -0,3326 |
Déclarations 13F et dépôts de fonds
Ce formulaire a été déposé le 2025-07-29 pour la période de déclaration 2025-06-30. Cliquez sur l'icône du lien pour voir l'historique complet des transactions.
Mettre à niveau pour débloquer les données premium et exporter vers Excel ![]() .
.
| Titre | Type | Prix moyen de l'action | Actions (en millions) |
ΔActions (%) |
ΔActions (%) |
Valeur ($ en millions) |
Portefeuille (%) |
ΔPortefeuille (%) |
|
|---|---|---|---|---|---|---|---|---|---|
| GS / The Goldman Sachs Group, Inc. | 0,02 | -1,71 | 12,22 | 27,35 | 3,0213 | 0,5099 | |||
| CSCO / Cisco Systems, Inc. | 0,16 | 7,58 | 11,17 | 20,95 | 2,7617 | 0,3447 | |||
| ORCL / Oracle Corporation | 0,05 | -1,89 | 11,03 | 53,43 | 2,7275 | 0,8458 | |||
| NEM / Newmont Corporation | 0,19 | -12,76 | 10,82 | 5,27 | 2,6751 | -0,0146 | |||
| LYB / LyondellBasell Industries N.V. | 0,18 | 68,93 | 10,68 | 38,85 | 2,6398 | 0,6272 | |||
| PFE / Pfizer Inc. | 0,44 | 8,96 | 10,58 | 4,24 | 2,6152 | -0,0406 | |||
| C / Citigroup Inc. | 0,12 | -0,88 | 10,49 | 18,85 | 2,5938 | 0,2836 | |||
| MS / Morgan Stanley | 0,07 | -1,62 | 10,25 | 18,78 | 2,5344 | 0,2758 | |||
| PM / Philip Morris International Inc. | 0,05 | -19,72 | 9,88 | -7,88 | 2,4427 | -0,3642 | |||
| GOOGL / Alphabet Inc. | 0,05 | 25,66 | 9,04 | 43,21 | 2,2357 | 0,5832 | |||
| KMI / Kinder Morgan, Inc. | 0,29 | -2,59 | 8,61 | 0,38 | 2,1291 | -0,1161 | |||
| SLB / Schlumberger Limited | 0,23 | -5,11 | 7,88 | -23,28 | 1,9469 | -0,7389 | |||
| WMB / The Williams Companies, Inc. | 0,12 | 1,26 | 7,75 | 6,42 | 1,9150 | 0,0103 | |||
| HCA / HCA Healthcare, Inc. | 0,02 | -5,69 | 7,66 | 4,57 | 1,8931 | -0,0233 | |||
| WMT / Walmart Inc. | 0,08 | -1,74 | 7,44 | 9,44 | 1,8392 | 0,0603 | |||
| HD / The Home Depot, Inc. | 0,02 | 30,21 | 7,34 | 30,26 | 1,8145 | 0,3401 | |||
| MAIN / Main Street Capital Corporation | 0,12 | 2,53 | 7,31 | 7,14 | 1,8064 | 0,0216 | |||
| IBM / International Business Machines Corporation | 0,02 | 4,45 | 7,30 | 23,82 | 1,8057 | 0,2620 | |||
| FCX / Freeport-McMoRan Inc. | 0,16 | -4,80 | 6,76 | 9,00 | 1,6699 | 0,0484 | |||
| MSFT / Microsoft Corporation | 0,01 | -4,43 | 6,70 | 26,63 | 1,6562 | 0,2718 | |||
| NVDA / NVIDIA Corporation | 0,04 | 15,09 | 6,51 | 67,81 | 1,6083 | 0,5936 | |||
| CNR / Core Natural Resources, Inc. | 0,09 | 4,52 | 6,35 | -5,45 | 1,5692 | -0,1876 | |||
| CVX / Chevron Corporation | 0,04 | 0,65 | 6,25 | -13,86 | 1,5457 | -0,3536 | |||
| NRG / NRG Energy, Inc. | 0,04 | -39,44 | 6,23 | 1,88 | 1,5410 | -0,0601 | |||
| FHI / Federated Hermes, Inc. | 0,14 | -25,76 | 6,21 | -19,29 | 1,5346 | -0,4781 | |||
| XOM / Exxon Mobil Corporation | 0,05 | 1,07 | 5,87 | -8,40 | 1,4512 | -0,2256 | |||
| T / AT&T Inc. | 0,20 | 3,19 | 5,82 | 5,61 | 1,4377 | -0,0034 | |||
| AVGO / Broadcom Inc. | 0,02 | 3,21 | 5,80 | 69,97 | 1,4340 | 0,5407 | |||
| AAPL / Apple Inc. | 0,03 | -18,59 | 5,78 | -24,81 | 1,4299 | -0,5831 | |||
| KEX / Kirby Corporation | 0,05 | 8,06 | 5,78 | 21,33 | 1,4286 | 0,1822 | |||
| BKR / Baker Hughes Company | 0,15 | -1,62 | 5,77 | -14,17 | 1,4257 | -0,3326 | |||
| LAMR / Lamar Advertising Company | 0,05 | 64,15 | 5,77 | 75,10 | 1,4254 | 0,5636 | |||
| ZBH / Zimmer Biomet Holdings, Inc. | 0,06 | -6,67 | 5,74 | -24,79 | 1,4189 | -0,5780 | |||
| VICI / VICI Properties Inc. | 0,18 | -1,14 | 5,74 | -1,19 | 1,4177 | -0,1011 | |||
| DAL / Delta Air Lines, Inc. | 0,12 | 9,71 | 5,72 | 23,75 | 1,4144 | 0,2046 | |||
| ABBV / AbbVie Inc. | 0,03 | -8,82 | 5,57 | -19,22 | 1,3759 | -0,4271 | |||
| SJM / The J. M. Smucker Company | 0,05 | 7,13 | 5,02 | -11,15 | 1,2407 | -0,2375 | |||
| GSK / GSK plc - Depositary Receipt (Common Stock) | 0,13 | 10,51 | 5,01 | 9,55 | 1,2396 | 0,0418 | |||
| WDS / Woodside Energy Group Ltd - Depositary Receipt (Common Stock) | 0,31 | 15,07 | 4,80 | 22,54 | 1,1855 | 0,1614 | |||
| VLO / Valero Energy Corporation | 0,03 | 0,00 | 4,62 | 1,79 | 1,1412 | -0,0457 | |||
| MCK / McKesson Corporation | 0,01 | 0,00 | 4,48 | 8,90 | 1,1073 | 0,0308 | |||
| KHC / The Kraft Heinz Company | 0,17 | 3,25 | 4,32 | -12,41 | 1,0683 | -0,2224 | |||
| RF / Regions Financial Corporation | 0,18 | 12,61 | 4,29 | 21,91 | 1,0593 | 0,1393 | |||
| QCOM / QUALCOMM Incorporated | 0,03 | 2,40 | 4,15 | 6,17 | 1,0259 | 0,0030 | |||
| BHP / BHP Group Limited - Depositary Receipt (Common Stock) | 0,09 | 3,62 | 4,12 | 2,66 | 1,0193 | -0,0317 | |||
| VLY / Valley National Bancorp | 0,46 | 3,65 | 4,11 | 4,13 | 1,0170 | -0,0170 | |||
| GM / General Motors Company | 0,08 | 0,00 | 4,09 | 4,65 | 1,0121 | -0,0118 | |||
| UPS / United Parcel Service, Inc. | 0,04 | 14,37 | 3,92 | 4,98 | 0,9690 | -0,0082 | |||
| HPQ / HP Inc. | 0,15 | 5,32 | 3,77 | -6,98 | 0,9318 | -0,1284 | |||
| IRM / Iron Mountain Incorporated | 0,03 | 1,98 | 3,49 | 21,58 | 0,8636 | 0,1116 | |||
| MMM / 3M Company | 0,02 | 0,00 | 3,48 | 3,67 | 0,8595 | -0,0181 | |||
| BRK.B / Berkshire Hathaway Inc. | 0,01 | -1,65 | 3,47 | -10,30 | 0,8568 | -0,1542 | |||
| CXW / CoreCivic, Inc. | 0,16 | 0,00 | 3,44 | 3,84 | 0,8499 | -0,0164 | |||
| UGI / UGI Corporation | 0,09 | 0,00 | 3,25 | 10,15 | 0,8022 | 0,0312 | |||
| HPE / Hewlett Packard Enterprise Company | 0,15 | 0,00 | 3,00 | 32,51 | 0,7408 | 0,1492 | |||
| LNG / Cheniere Energy, Inc. | 0,01 | 0,00 | 2,88 | 5,27 | 0,7112 | -0,0041 | |||
| OI / O-I Glass, Inc. | 0,18 | 0,00 | 2,64 | 28,49 | 0,6536 | 0,1152 | |||
| BAC / Bank of America Corporation | 0,05 | 0,00 | 2,49 | 13,42 | 0,6163 | 0,0410 | |||
| JEPI / J.P. Morgan Exchange-Traded Fund Trust - JPMorgan Equity Premium Income ETF | 0,04 | 0,00 | 2,40 | -0,50 | 0,5923 | -0,0379 | |||
| CPRI / Capri Holdings Limited | 0,13 | 29,39 | 2,37 | 16,05 | 0,5862 | 0,0516 | |||
| BIIB / Biogen Inc. | 0,02 | 2,26 | 0,5579 | 0,5579 | |||||
| MAN / ManpowerGroup Inc. | 0,06 | 2,22 | 0,5500 | 0,5500 | |||||
| VZ / Verizon Communications Inc. | 0,05 | 3,17 | 2,17 | -1,59 | 0,5369 | -0,0406 | |||
| CMCSA / Comcast Corporation | 0,06 | -0,25 | 2,14 | -3,51 | 0,5301 | -0,0515 | |||
| TNL / Travel + Leisure Co. | 0,04 | 0,00 | 2,08 | 11,49 | 0,5136 | 0,0260 | |||
| FITB / Fifth Third Bancorp | 0,05 | 7,38 | 1,85 | 12,64 | 0,4585 | 0,0277 | |||
| SYY / Sysco Corporation | 0,02 | -69,38 | 1,68 | -69,10 | 0,4141 | -1,0044 | |||
| NVO / Novo Nordisk A/S - Depositary Receipt (Common Stock) | 0,02 | 11,10 | 1,60 | 10,45 | 0,3946 | 0,0163 | |||
| VTI / Vanguard Index Funds - Vanguard Total Stock Market ETF | 0,01 | 18,78 | 1,54 | 31,37 | 0,3801 | 0,0738 | |||
| FSLR / First Solar, Inc. | 0,01 | 20,13 | 1,48 | 57,39 | 0,3662 | 0,1198 | |||
| SDY / SPDR Series Trust - SPDR S&P Dividend ETF | 0,01 | -3,65 | 1,43 | -3,64 | 0,3538 | -0,0348 | |||
| JNJ / Johnson & Johnson | 0,01 | -1,11 | 1,36 | -8,90 | 0,3364 | -0,0545 | |||
| TAP / Molson Coors Beverage Company | 0,03 | 0,00 | 1,33 | -20,99 | 0,3286 | -0,1117 | |||
| XLK / The Select Sector SPDR Trust - The Technology Select Sector SPDR Fund | 0,00 | -7,50 | 1,25 | 13,45 | 0,3086 | 0,0206 | |||
| MOS / The Mosaic Company | 0,03 | -39,93 | 1,21 | -18,88 | 0,2985 | -0,0909 | |||
| JPM / JPMorgan Chase & Co. | 0,00 | 0,00 | 1,02 | 18,14 | 0,2513 | 0,0262 | |||
| DOW / Dow Inc. | 0,04 | -74,84 | 0,94 | -80,92 | 0,2324 | -1,0566 | |||
| LIN / Linde plc | 0,00 | -0,30 | 0,94 | 0,43 | 0,2322 | -0,0125 | |||
| DHI / D.R. Horton, Inc. | 0,01 | 0,00 | 0,91 | 1,45 | 0,2250 | -0,0099 | |||
| ETN / Eaton Corporation plc | 0,00 | 0,00 | 0,86 | 31,29 | 0,2118 | 0,0411 | |||
| CLF / Cleveland-Cliffs Inc. | 0,09 | 24,53 | 0,71 | 15,10 | 0,1755 | 0,0142 | |||
| FLG / Flagstar Financial, Inc. | 0,07 | -5,73 | 0,70 | -14,06 | 0,1725 | -0,0398 | |||
| SPY / SPDR S&P 500 ETF | 0,00 | 0,00 | 0,65 | 10,58 | 0,1602 | 0,0067 | |||
| LMT / Lockheed Martin Corporation | 0,00 | 0,00 | 0,46 | 3,81 | 0,1145 | -0,0024 | |||
| SOFI / SoFi Technologies, Inc. | 0,03 | -7,41 | 0,46 | 44,90 | 0,1125 | 0,0304 | |||
| RTX / RTX Corporation | 0,00 | 0,00 | 0,44 | 10,33 | 0,1083 | 0,0043 | |||
| XLC / The Select Sector SPDR Trust - The Communication Services Select Sector SPDR Fund | 0,00 | 0,00 | 0,43 | 12,73 | 0,1073 | 0,0064 | |||
| AMGN / Amgen Inc. | 0,00 | 0,00 | 0,38 | -10,26 | 0,0930 | -0,0168 | |||
| OEF / iShares Trust - iShares S&P 100 ETF | 0,00 | -44,95 | 0,37 | -38,14 | 0,0903 | -0,0642 | |||
| COST / Costco Wholesale Corporation | 0,00 | 0,00 | 0,36 | 4,62 | 0,0896 | -0,0010 | |||
| CL / Colgate-Palmolive Company | 0,00 | 0,00 | 0,34 | -2,89 | 0,0831 | -0,0076 | |||
| MPC / Marathon Petroleum Corporation | 0,00 | 0,00 | 0,33 | 14,09 | 0,0821 | 0,0059 | |||
| ROST / Ross Stores, Inc. | 0,00 | 0,00 | 0,33 | -0,30 | 0,0820 | -0,0049 | |||
| PG / The Procter & Gamble Company | 0,00 | -3,67 | 0,32 | -10,08 | 0,0796 | -0,0140 | |||
| GOOG / Alphabet Inc. | 0,00 | 0,00 | 0,29 | 13,62 | 0,0724 | 0,0049 | |||
| CAT / Caterpillar Inc. | 0,00 | 0,00 | 0,29 | 17,48 | 0,0717 | 0,0072 | |||
| GD / General Dynamics Corporation | 0,00 | 0,00 | 0,27 | 7,20 | 0,0663 | 0,0007 | |||
| LH / Labcorp Holdings Inc. | 0,00 | 0,00 | 0,26 | 12,93 | 0,0649 | 0,0040 | |||
| TM / Toyota Motor Corporation - Depositary Receipt (Common Stock) | 0,00 | 0,00 | 0,24 | -2,43 | 0,0596 | -0,0051 | |||
| COP / ConocoPhillips | 0,00 | 0,00 | 0,23 | -14,45 | 0,0557 | -0,0133 | |||
| PSX / Phillips 66 | 0,00 | 0,00 | 0,21 | -3,21 | 0,0522 | -0,0050 | |||
| IWD / iShares Trust - iShares Russell 1000 Value ETF | 0,00 | 0,00 | 0,21 | 2,99 | 0,0513 | -0,0013 | |||
| UBER / Uber Technologies, Inc. | 0,00 | -61,36 | 0,21 | -50,60 | 0,0508 | -0,0579 | |||
| BMY / Bristol-Myers Squibb Company | 0,00 | 0,00 | 0,20 | -24,24 | 0,0495 | -0,0196 | |||
| F / Ford Motor Company | 0,01 | -1,48 | 0,11 | 6,93 | 0,0268 | 0,0002 | |||
| UEC / Uranium Energy Corp. | 0,01 | 0,00 | 0,07 | 44,68 | 0,0168 | 0,0043 | |||
| PAAS / Pan American Silver Corp. | 0,00 | -100,00 | 0,00 | 0,0000 | |||||
| ARLP / Alliance Resource Partners, L.P. - Limited Partnership | 0,00 | -100,00 | 0,00 | 0,0000 | |||||
| HON / Honeywell International Inc. | 0,00 | -100,00 | 0,00 | 0,0000 | |||||
| EXP / Eagle Materials Inc. | 0,00 | -100,00 | 0,00 | 0,0000 | |||||
| CTRA / Coterra Energy Inc. | 0,00 | -100,00 | 0,00 | 0,0000 | |||||
| FI / Fiserv, Inc. | 0,00 | -100,00 | 0,00 | 0,0000 |