Statistiques de base
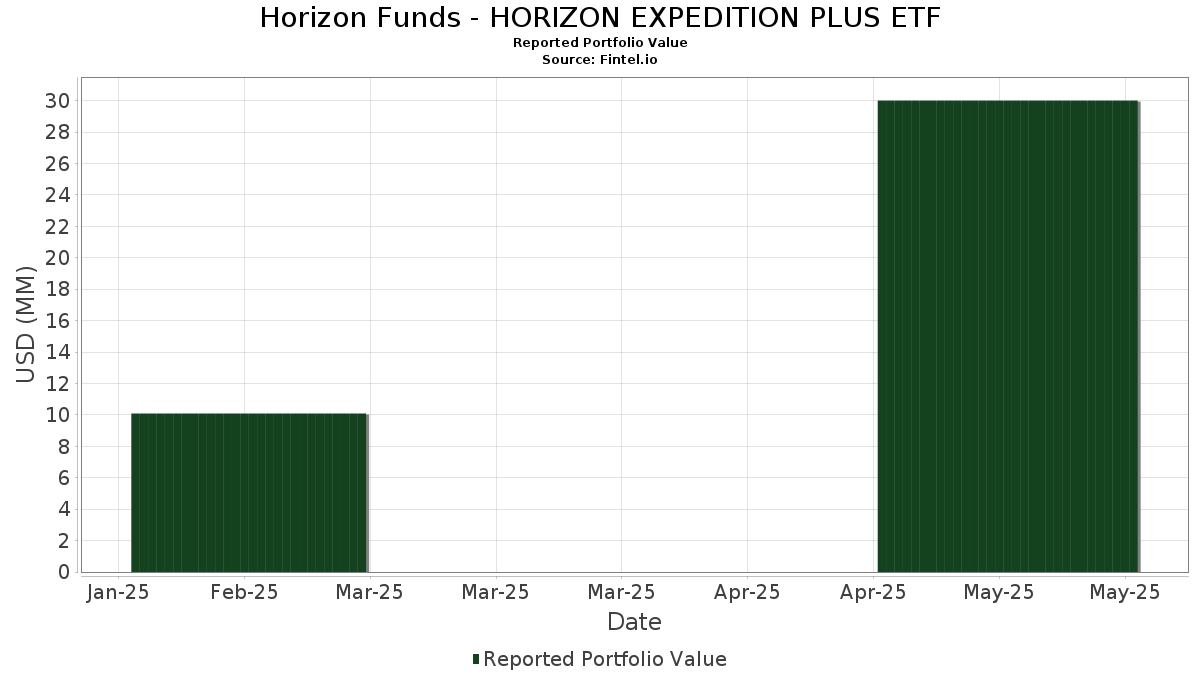
| Valeur du portefeuille | $ 30 003 109 |
| Positions actuelles | 213 |
Dernières positions, performances, ASG (à partir des dépôts 13F, 13D)
Horizon Funds - HORIZON EXPEDITION PLUS ETF a déclaré un total de 213 positions dans ses derniers dépôts auprès de la SEC. La valeur la plus récente du portefeuille est calculée à 30 003 109 USD. Les actifs sous gestion réels (ASG) sont cette valeur plus les liquidités (qui ne sont pas divulguées). Les principales positions de Horizon Funds - HORIZON EXPEDITION PLUS ETF sont NVIDIA Corporation (US:NVDA) , Apple Inc. (US:AAPL) , Microsoft Corporation (US:MSFT) , Amazon.com, Inc. (US:AMZN) , and Alphabet Inc. (US:GOOGL) .
Meilleures augmentations ce trimestre
Nous utilisons la variation de l'allocation du portefeuille car il s'agit de l'indicateur le plus significatif. Les changements peuvent être dus à des transactions ou à des variations de prix des actions.
| Titre | Actions (en millions) |
Valeur ($ en millions) |
% du portefeuille | ΔPortefeuille % |
|---|---|---|---|---|
| 0,01 | 2,33 | 7,6856 | 1,0081 | |
| 0,02 | 2,93 | 9,6386 | 0,6112 | |
| 0,00 | 0,99 | 3,2590 | 0,5672 | |
| 0,00 | 0,97 | 3,1831 | 0,5061 | |
| 0,00 | 0,46 | 1,5271 | 0,3054 | |
| 0,00 | 0,24 | 0,7779 | 0,2842 | |
| 0,07 | 0,2214 | 0,2214 | ||
| 0,07 | 0,2214 | 0,2214 | ||
| 0,03 | 0,1139 | 0,1139 | ||
| 0,03 | 0,1139 | 0,1139 |
Principales baisses ce trimestre
Nous utilisons la variation de l'allocation du portefeuille car il s'agit de l'indicateur le plus significatif. Les changements peuvent être dus à des transactions ou à des variations de prix des actions.
| Titre | Actions (en millions) |
Valeur ($ en millions) |
% du portefeuille | ΔPortefeuille % |
|---|---|---|---|---|
| 0,01 | 2,44 | 8,0421 | -1,7508 | |
| 0,00 | 0,18 | 0,5818 | -0,4599 | |
| -0,12 | -0,3812 | -0,3812 | ||
| -0,12 | -0,3812 | -0,3812 | ||
| 0,00 | 0,41 | 1,3632 | -0,3574 | |
| 0,01 | 1,93 | 6,3623 | -0,2499 | |
| 0,01 | 0,01 | 0,0491 | -0,2298 | |
| -0,07 | -0,2244 | -0,2244 | ||
| -0,07 | -0,2244 | -0,2244 | ||
| -0,06 | -0,2089 | -0,2089 |
Déclarations 13F et dépôts de fonds
Ce formulaire a été déposé le 2025-07-23 pour la période de déclaration 2025-05-31. Cliquez sur l'icône du lien pour voir l'historique complet des transactions.
Mettre à niveau pour débloquer les données premium et exporter vers Excel ![]() .
.
| Titre | Type | Prix moyen de l'action | Actions (en millions) |
ΔActions (%) |
ΔActions (%) |
Valeur ($ en millions) |
Portefeuille (%) |
ΔPortefeuille (%) |
|
|---|---|---|---|---|---|---|---|---|---|
| NVDA / NVIDIA Corporation | 0,02 | 196,29 | 2,93 | 220,72 | 9,6386 | 0,6112 | |||
| AAPL / Apple Inc. | 0,01 | 196,83 | 2,44 | 146,57 | 8,0421 | -1,7508 | |||
| MSFT / Microsoft Corporation | 0,01 | 197,94 | 2,33 | 245,63 | 7,6856 | 1,0081 | |||
| AMZN / Amazon.com, Inc. | 0,01 | 199,08 | 1,93 | 189,07 | 6,3623 | -0,2499 | |||
| GOOGL / Alphabet Inc. | 0,01 | 197,97 | 1,84 | 200,65 | 6,0534 | 0,0068 | |||
| META / Meta Platforms, Inc. | 0,00 | 200,88 | 1,55 | 191,56 | 5,1212 | -0,1516 | |||
| AVGO / Broadcom Inc. | 0,00 | 199,41 | 0,99 | 263,60 | 3,2590 | 0,5672 | |||
| TSLA / Tesla, Inc. | 0,00 | 201,84 | 0,97 | 257,78 | 3,1831 | 0,5061 | |||
| JPM / JPMorgan Chase & Co. | 0,00 | 197,14 | 0,58 | 196,91 | 1,8993 | -0,0242 | |||
| WMT / Walmart Inc. | 0,01 | 198,14 | 0,54 | 198,33 | 1,7714 | -0,0102 | |||
| V / Visa Inc. | 0,00 | 204,76 | 0,54 | 206,86 | 1,7708 | 0,0384 | |||
| NFLX / Netflix, Inc. | 0,00 | 204,76 | 0,46 | 276,42 | 1,5271 | 0,3054 | |||
| LLY / Eli Lilly and Company | 0,00 | 196,83 | 0,41 | 138,73 | 1,3632 | -0,3574 | |||
| COST / Costco Wholesale Corporation | 0,00 | 189,68 | 0,38 | 187,12 | 1,2507 | -0,0558 | |||
| MA / Mastercard Incorporated | 0,00 | 204,76 | 0,37 | 209,09 | 1,2346 | 0,0378 | |||
| ORCL / Oracle Corporation | 0,00 | 198,62 | 0,32 | 197,22 | 1,0600 | -0,0090 | |||
| BAC / Bank of America Corporation | 0,01 | 198,01 | 0,24 | 185,54 | 0,7824 | -0,0409 | |||
| PLTR / Palantir Technologies Inc. | 0,00 | 204,76 | 0,24 | 381,63 | 0,7779 | 0,2842 | |||
| GE / General Electric Company | 0,00 | 191,16 | 0,21 | 250,00 | 0,6934 | 0,0917 | |||
| CRM / Salesforce, Inc. | 0,00 | 204,76 | 0,20 | 170,67 | 0,6714 | -0,0709 | |||
| HD / The Home Depot, Inc. | 0,00 | 183,07 | 0,20 | 166,22 | 0,6491 | -0,0922 | |||
| WFC / Wells Fargo & Company | 0,00 | 204,76 | 0,19 | 190,63 | 0,6149 | -0,0194 | |||
| ISRG / Intuitive Surgical, Inc. | 0,00 | 204,76 | 0,18 | 193,33 | 0,5822 | -0,0129 | |||
| AXP / American Express Company | 0,00 | 186,19 | 0,18 | 179,37 | 0,5822 | -0,0428 | |||
| BKNG / Booking Holdings Inc. | 0,00 | 52,38 | 0,18 | 67,62 | 0,5818 | -0,4599 | |||
| MS / Morgan Stanley | 0,00 | 194,81 | 0,17 | 185,25 | 0,5744 | -0,0337 | |||
| TMUS / T-Mobile US, Inc. | 0,00 | 204,76 | 0,17 | 174,19 | 0,5617 | -0,0544 | |||
| DIS / The Walt Disney Company | 0,00 | 204,76 | 0,17 | 207,41 | 0,5481 | 0,0046 | |||
| GS / The Goldman Sachs Group, Inc. | 0,00 | 204,76 | 0,15 | 194,23 | 0,5064 | -0,0105 | |||
| IBM / International Business Machines Corporation | 0,00 | 204,76 | 0,15 | 217,02 | 0,4915 | 0,0198 | |||
| PM / Philip Morris International Inc. | 0,00 | 204,76 | 0,14 | 253,85 | 0,4569 | 0,0699 | |||
| ABBV / AbbVie Inc. | 0,00 | 189,68 | 0,14 | 159,62 | 0,4475 | -0,0733 | |||
| BSX / Boston Scientific Corporation | 0,00 | 204,76 | 0,13 | 211,63 | 0,4438 | 0,0128 | |||
| CSCO / Cisco Systems, Inc. | 0,00 | 204,76 | 0,13 | 202,27 | 0,4386 | -0,0007 | |||
| NOW / ServiceNow, Inc. | 0,00 | 204,76 | 0,13 | 230,77 | 0,4263 | 0,0402 | |||
| BLK / BlackRock, Inc. | 0,00 | 204,76 | 0,13 | 204,88 | 0,4132 | 0,0071 | |||
| C / Citigroup Inc. | 0,00 | 204,76 | 0,12 | 192,68 | 0,3970 | -0,0181 | |||
| UBER / Uber Technologies, Inc. | 0,00 | 204,76 | 0,12 | 237,14 | 0,3903 | 0,0431 | |||
| ETN / Eaton Corporation plc | 0,00 | 187,30 | 0,12 | 219,44 | 0,3818 | 0,0164 | |||
| CAT / Caterpillar Inc. | 0,00 | 204,76 | 0,11 | 208,33 | 0,3669 | 0,0097 | |||
| ABT / Abbott Laboratories | 0,00 | 204,76 | 0,11 | 200,00 | 0,3661 | -0,0065 | |||
| KO / The Coca-Cola Company | 0,00 | 204,76 | 0,11 | 214,29 | 0,3648 | 0,0099 | |||
| RTX / RTX Corporation | 0,00 | 204,76 | 0,10 | 215,15 | 0,3453 | 0,0139 | |||
| ADP / Automatic Data Processing, Inc. | 0,00 | 204,76 | 0,10 | 215,15 | 0,3432 | 0,0159 | |||
| TT / Trane Technologies plc | 0,00 | 186,90 | 0,10 | 255,17 | 0,3416 | 0,0478 | |||
| KKR / KKR & Co. Inc. | 0,00 | 204,76 | 0,10 | 172,97 | 0,3329 | -0,0331 | |||
| SYK / Stryker Corporation | 0,00 | 204,76 | 0,10 | 203,13 | 0,3227 | 0,0019 | |||
| BX / Blackstone Inc. | 0,00 | 204,76 | 0,10 | 162,16 | 0,3218 | -0,0463 | |||
| TJX / The TJX Companies, Inc. | 0,00 | 204,76 | 0,10 | 212,90 | 0,3210 | 0,0102 | |||
| INTU / Intuit Inc. | 0,00 | 204,76 | 0,10 | 284,00 | 0,3177 | 0,0628 | |||
| HON / Honeywell International Inc. | 0,00 | 187,07 | 0,10 | 206,45 | 0,3151 | 0,0056 | |||
| EQIX / Equinix, Inc. | 0,00 | 145,24 | 0,09 | 145,95 | 0,3016 | -0,0741 | |||
| CEG / Constellation Energy Corporation | 0,00 | 182,86 | 0,09 | 246,15 | 0,2995 | 0,0394 | |||
| HWM / Howmet Aerospace Inc. | 0,00 | 204,76 | 0,09 | 290,91 | 0,2865 | 0,0596 | |||
| PH / Parker-Hannifin Corporation | 0,00 | 204,76 | 0,09 | 203,57 | 0,2803 | 0,0026 | |||
| QCOM / QUALCOMM Incorporated | 0,00 | 204,76 | 0,08 | 186,21 | 0,2755 | -0,0182 | |||
| T / AT&T Inc. | 0,00 | 204,76 | 0,08 | 220,00 | 0,2637 | 0,0076 | |||
| WELL / Welltower Inc. | 0,00 | 204,76 | 0,08 | 212,00 | 0,2602 | 0,0052 | |||
| AXON / Axon Enterprise, Inc. | 0,00 | 150,00 | 0,08 | 254,55 | 0,2595 | 0,0401 | |||
| CVX / Chevron Corporation | 0,00 | 204,76 | 0,08 | 168,97 | 0,2594 | -0,0371 | |||
| JCI / Johnson Controls International plc | 0,00 | 204,76 | 0,08 | 266,67 | 0,2565 | 0,0430 | |||
| GILD / Gilead Sciences, Inc. | 0,00 | 204,76 | 0,08 | 196,15 | 0,2553 | -0,0058 | |||
| APO / Apollo Global Management, Inc. | 0,00 | 204,76 | 0,08 | 167,86 | 0,2480 | -0,0310 | |||
| CME / CME Group Inc. | 0,00 | 204,76 | 0,07 | 247,62 | 0,2437 | 0,0329 | |||
| MO / Altria Group, Inc. | 0,00 | 204,76 | 0,07 | 231,82 | 0,2428 | 0,0224 | |||
| PGR / The Progressive Corporation | 0,00 | 204,76 | 0,07 | 213,04 | 0,2403 | 0,0060 | |||
| FI / Fiserv, Inc. | 0,00 | 204,76 | 0,07 | 111,76 | 0,2402 | -0,1024 | |||
| CTAS / Cintas Corporation | 0,00 | 204,76 | 0,07 | 242,86 | 0,2388 | 0,0233 | |||
| PYPL / PayPal Holdings, Inc. | 0,00 | 204,76 | 0,07 | 208,70 | 0,2371 | 0,0010 | |||
| ORLY / O'Reilly Automotive, Inc. | 0,00 | 142,86 | 0,07 | 146,43 | 0,2297 | -0,0555 | |||
| NDAQ / Nasdaq, Inc. | 0,00 | 204,76 | 0,07 | 213,64 | 0,2290 | 0,0055 | |||
| TDG / TransDigm Group Incorporated | 0,00 | 123,81 | 0,07 | 146,43 | 0,2274 | -0,0566 | |||
| PANW / Palo Alto Networks, Inc. | 0,00 | 180,16 | 0,07 | 191,30 | 0,2238 | -0,0135 | |||
| TMO / Thermo Fisher Scientific Inc. | 0,00 | 166,67 | 0,07 | 103,03 | 0,2229 | -0,1066 | |||
| SPY 06/26/2025 573 P / DE (N/A) | 0,07 | 0,2214 | 0,2214 | ||||||
| SPY 06/26/2025 573 P / DE (N/A) | 0,07 | 0,2214 | 0,2214 | ||||||
| AJG / Arthur J. Gallagher & Co. | 0,00 | 204,76 | 0,07 | 214,29 | 0,2197 | 0,0093 | |||
| ANET / Arista Networks Inc | 0,00 | 204,76 | 0,07 | 186,96 | 0,2192 | -0,0127 | |||
| MMM / 3M Company | 0,00 | 204,76 | 0,07 | 200,00 | 0,2189 | -0,0066 | |||
| WMB / The Williams Companies, Inc. | 0,00 | 204,76 | 0,07 | 225,00 | 0,2169 | 0,0115 | |||
| RCL / Royal Caribbean Cruises Ltd. | 0,00 | 204,76 | 0,07 | 225,00 | 0,2167 | 0,0123 | |||
| PWR / Quanta Services, Inc. | 0,00 | 204,76 | 0,07 | 306,25 | 0,2167 | 0,0549 | |||
| DE / Deere & Company | 0,00 | 204,76 | 0,06 | 220,00 | 0,2135 | 0,0138 | |||
| CARR / Carrier Global Corporation | 0,00 | 204,76 | 0,06 | 231,58 | 0,2102 | 0,0218 | |||
| AON / Aon plc | 0,00 | 171,43 | 0,06 | 152,00 | 0,2096 | -0,0453 | |||
| HLT / Hilton Worldwide Holdings Inc. | 0,00 | 204,76 | 0,06 | 186,36 | 0,2095 | -0,0106 | |||
| SHW / The Sherwin-Williams Company | 0,00 | 180,95 | 0,06 | 186,36 | 0,2092 | -0,0165 | |||
| GM / General Motors Company | 0,00 | 204,76 | 0,06 | 215,00 | 0,2092 | 0,0051 | |||
| SPG / Simon Property Group, Inc. | 0,00 | 204,76 | 0,06 | 169,57 | 0,2063 | -0,0256 | |||
| VST / Vistra Corp. | 0,00 | 204,76 | 0,06 | 281,25 | 0,2031 | 0,0366 | |||
| MCO / Moody's Corporation | 0,00 | 204,76 | 0,06 | 190,48 | 0,2021 | -0,0072 | |||
| EMR / Emerson Electric Co. | 0,00 | 204,76 | 0,06 | 205,00 | 0,2013 | -0,0007 | |||
| GWW / W.W. Grainger, Inc. | 0,00 | 166,67 | 0,06 | 185,71 | 0,2006 | -0,0114 | |||
| COF / Capital One Financial Corporation | 0,00 | 204,76 | 0,06 | 185,71 | 0,1994 | -0,0088 | |||
| DLR / Digital Realty Trust, Inc. | 0,00 | 178,57 | 0,06 | 215,79 | 0,1983 | 0,0036 | |||
| LIN / Linde plc | 0,00 | 204,76 | 0,06 | 210,53 | 0,1972 | 0,0032 | |||
| CMI / Cummins Inc. | 0,00 | 195,24 | 0,06 | 156,52 | 0,1970 | -0,0324 | |||
| MAR / Marriott International, Inc. | 0,00 | 169,05 | 0,06 | 156,52 | 0,1964 | -0,0365 | |||
| CPRT / Copart, Inc. | 0,00 | 204,76 | 0,06 | 195,00 | 0,1954 | -0,0095 | |||
| KMI / Kinder Morgan, Inc. | 0,00 | 204,76 | 0,06 | 227,78 | 0,1951 | 0,0094 | |||
| GRMN / Garmin Ltd. | 0,00 | 176,19 | 0,06 | 141,67 | 0,1939 | -0,0438 | |||
| USB / U.S. Bancorp | 0,00 | 204,76 | 0,06 | 190,00 | 0,1930 | -0,0115 | |||
| TXN / Texas Instruments Incorporated | 0,00 | 204,76 | 0,06 | 190,00 | 0,1927 | -0,0107 | |||
| ABNB / Airbnb, Inc. | 0,00 | 204,76 | 0,06 | 185,00 | 0,1904 | -0,0115 | |||
| LOW / Lowe's Companies, Inc. | 0,00 | 204,76 | 0,06 | 185,00 | 0,1904 | -0,0162 | |||
| AMP / Ameriprise Financial, Inc. | 0,00 | 169,05 | 0,06 | 159,09 | 0,1896 | -0,0336 | |||
| UNP / Union Pacific Corporation | 0,00 | 204,76 | 0,06 | 180,00 | 0,1869 | -0,0180 | |||
| AMD / Advanced Micro Devices, Inc. | 0,00 | 204,76 | 0,06 | 250,00 | 0,1868 | 0,0209 | |||
| BMY / Bristol-Myers Squibb Company | 0,00 | 204,76 | 0,06 | 150,00 | 0,1832 | -0,0396 | |||
| CMG / Chipotle Mexican Grill, Inc. | 0,00 | 204,76 | 0,05 | 184,21 | 0,1795 | -0,0110 | |||
| PCAR / PACCAR Inc | 0,00 | 204,76 | 0,05 | 170,00 | 0,1781 | -0,0224 | |||
| LULU / lululemon athletica inc. | 0,00 | 166,67 | 0,05 | 130,43 | 0,1753 | -0,0525 | |||
| BKR / Baker Hughes Company | 0,00 | 204,76 | 0,05 | 157,89 | 0,1640 | -0,0304 | |||
| DHR / Danaher Corporation | 0,00 | 204,76 | 0,05 | 182,35 | 0,1601 | -0,0124 | |||
| OKE / ONEOK, Inc. | 0,00 | 204,76 | 0,05 | 155,56 | 0,1534 | -0,0342 | |||
| DAL / Delta Air Lines, Inc. | 0,00 | 204,76 | 0,05 | 155,56 | 0,1530 | -0,0342 | |||
| TRGP / Targa Resources Corp. | 0,00 | 176,19 | 0,05 | 114,29 | 0,1509 | -0,0586 | |||
| APH / Amphenol Corporation | 0,00 | 204,76 | 0,04 | 344,44 | 0,1327 | 0,0359 | |||
| KR / The Kroger Co. | 0,00 | 204,76 | 0,04 | 225,00 | 0,1295 | 0,0083 | |||
| HCA / HCA Healthcare, Inc. | 0,00 | 140,48 | 0,04 | 216,67 | 0,1269 | -0,0003 | |||
| MCK / McKesson Corporation | 0,00 | 152,38 | 0,04 | 192,31 | 0,1256 | -0,0073 | |||
| TTWO / Take-Two Interactive Software, Inc. | 0,00 | 166,67 | 0,04 | 192,31 | 0,1252 | -0,0068 | |||
| EBAY / eBay Inc. | 0,00 | 204,76 | 0,04 | 270,00 | 0,1234 | 0,0159 | |||
| COR / Cencora, Inc. | 0,00 | 204,76 | 0,04 | 270,00 | 0,1228 | 0,0175 | |||
| FAST / Fastenal Company | 0,00 | 509,52 | 0,04 | 236,36 | 0,1220 | 0,0119 | |||
| VZ / Verizon Communications Inc. | 0,00 | 204,76 | 0,04 | 227,27 | 0,1205 | 0,0041 | |||
| CTVA / Corteva, Inc. | 0,00 | 204,76 | 0,04 | 260,00 | 0,1194 | 0,0148 | |||
| BRO / Brown & Brown, Inc. | 0,00 | 204,76 | 0,04 | 200,00 | 0,1190 | -0,0041 | |||
| CL / Colgate-Palmolive Company | 0,00 | 204,76 | 0,04 | 218,18 | 0,1176 | 0,0040 | |||
| DELL / Dell Technologies Inc. | 0,00 | 204,76 | 0,04 | 250,00 | 0,1173 | 0,0106 | |||
| TRV / The Travelers Companies, Inc. | 0,00 | 204,76 | 0,04 | 250,00 | 0,1162 | 0,0089 | |||
| VRSK / Verisk Analytics, Inc. | 0,00 | 166,67 | 0,04 | 191,67 | 0,1159 | -0,0074 | |||
| LYV / Live Nation Entertainment, Inc. | 0,00 | 204,76 | 0,04 | 191,67 | 0,1157 | -0,0034 | |||
| EW / Edwards Lifesciences Corporation | 0,00 | 204,76 | 0,04 | 250,00 | 0,1154 | 0,0113 | |||
| SPY 06/18/2025 568.1 P / DE (N/A) | 0,03 | 0,1139 | 0,1139 | ||||||
| SPY 06/18/2025 568.1 P / DE (N/A) | 0,03 | 0,1139 | 0,1139 | ||||||
| AME / AMETEK, Inc. | 0,00 | 204,76 | 0,03 | 209,09 | 0,1130 | -0,0049 | |||
| ECL / Ecolab Inc. | 0,00 | 204,76 | 0,03 | 200,00 | 0,1120 | 0,0003 | |||
| VMC / Vulcan Materials Company | 0,00 | 204,76 | 0,03 | 230,00 | 0,1118 | 0,0091 | |||
| RSG / Republic Services, Inc. | 0,00 | 204,76 | 0,03 | 255,56 | 0,1085 | 0,0100 | |||
| FTNT / Fortinet, Inc. | 0,00 | 204,76 | 0,03 | 190,91 | 0,1073 | -0,0049 | |||
| ZTS / Zoetis Inc. | 0,00 | 204,76 | 0,03 | 220,00 | 0,1067 | 0,0025 | |||
| EXPE / Expedia Group, Inc. | 0,00 | 204,76 | 0,03 | 166,67 | 0,1055 | -0,0179 | |||
| CBRE / CBRE Group, Inc. | 0,00 | 204,76 | 0,03 | 190,91 | 0,1054 | -0,0125 | |||
| MDT / Medtronic plc | 0,00 | 204,76 | 0,03 | 181,82 | 0,1050 | -0,0097 | |||
| EQT / EQT Corporation | 0,00 | 204,76 | 0,03 | 244,44 | 0,1046 | 0,0146 | |||
| GLW / Corning Incorporated | 0,00 | 204,76 | 0,03 | 210,00 | 0,1045 | 0,0004 | |||
| WDAY / Workday, Inc. | 0,00 | 204,76 | 0,03 | 181,82 | 0,1044 | -0,0049 | |||
| ADSK / Autodesk, Inc. | 0,00 | 154,76 | 0,03 | 181,82 | 0,1044 | -0,0095 | |||
| NEE / NextEra Energy, Inc. | 0,00 | 204,76 | 0,03 | 210,00 | 0,1042 | 0,0022 | |||
| NSC / Norfolk Southern Corporation | 0,00 | 204,76 | 0,03 | 210,00 | 0,1042 | 0,0021 | |||
| IRM / Iron Mountain Incorporated | 0,00 | 204,76 | 0,03 | 244,44 | 0,1041 | 0,0073 | |||
| RMD / ResMed Inc. | 0,00 | 204,76 | 0,03 | 244,44 | 0,1032 | 0,0062 | |||
| KLAC / KLA Corporation | 0,00 | 95,24 | 0,03 | 121,43 | 0,1022 | -0,0450 | |||
| LRCX / Lam Research Corporation | 0,00 | 204,76 | 0,03 | 244,44 | 0,1022 | 0,0066 | |||
| STT / State Street Corporation | 0,00 | 204,76 | 0,03 | 200,00 | 0,1015 | -0,0015 | |||
| ODFL / Old Dominion Freight Line, Inc. | 0,00 | 204,76 | 0,03 | 172,73 | 0,1013 | -0,0087 | |||
| CSX / CSX Corporation | 0,00 | 204,76 | 0,03 | 200,00 | 0,0999 | 0,0002 | |||
| PAYX / Paychex, Inc. | 0,00 | 204,76 | 0,03 | 233,33 | 0,0999 | 0,0054 | |||
| GEV / GE Vernova Inc. | 0,00 | 204,76 | 0,03 | 328,57 | 0,0997 | 0,0301 | |||
| MU / Micron Technology, Inc. | 0,00 | 204,76 | 0,03 | 233,33 | 0,0996 | 0,0024 | |||
| MET / MetLife, Inc. | 0,00 | 204,76 | 0,03 | 200,00 | 0,0994 | -0,0080 | |||
| CRWD / CrowdStrike Holdings, Inc. | 0,00 | 204,76 | 0,03 | 275,00 | 0,0994 | 0,0185 | |||
| KEYS / Keysight Technologies, Inc. | 0,00 | 204,76 | 0,03 | 200,00 | 0,0993 | -0,0001 | |||
| AMAT / Applied Materials, Inc. | 0,00 | 204,76 | 0,03 | 233,33 | 0,0991 | 0,0007 | |||
| SNPS / Synopsys, Inc. | 0,00 | 204,76 | 0,03 | 222,22 | 0,0978 | 0,0029 | |||
| FCX / Freeport-McMoRan Inc. | 0,00 | 204,76 | 0,03 | 222,22 | 0,0974 | 0,0054 | |||
| CDNS / Cadence Design Systems, Inc. | 0,00 | 142,86 | 0,03 | 190,00 | 0,0965 | -0,0076 | |||
| URI / United Rentals, Inc. | 0,00 | 95,24 | 0,03 | 123,08 | 0,0957 | -0,0377 | |||
| MTB / M&T Bank Corporation | 0,00 | 152,38 | 0,03 | 141,67 | 0,0957 | -0,0238 | |||
| LVS / Las Vegas Sands Corp. | 0,00 | 204,76 | 0,03 | 180,00 | 0,0955 | -0,0067 | |||
| MSCI / MSCI Inc. | 0,00 | 142,86 | 0,03 | 133,33 | 0,0948 | -0,0279 | |||
| DOV / Dover Corporation | 0,00 | 153,97 | 0,03 | 133,33 | 0,0937 | -0,0301 | |||
| CCL / Carnival Corporation & plc | 0,00 | 204,76 | 0,03 | 211,11 | 0,0930 | -0,0014 | |||
| RJF / Raymond James Financial, Inc. | 0,00 | 204,76 | 0,03 | 211,11 | 0,0930 | -0,0034 | |||
| IT / Gartner, Inc. | 0,00 | 204,76 | 0,03 | 170,00 | 0,0920 | -0,0115 | |||
| FDX / FedEx Corporation | 0,00 | 204,76 | 0,03 | 145,45 | 0,0920 | -0,0172 | |||
| EOG / EOG Resources, Inc. | 0,00 | 204,76 | 0,03 | 170,00 | 0,0916 | -0,0139 | |||
| SPY 06/12/2025 572 P / DE (N/A) | 0,03 | 0,0904 | 0,0904 | ||||||
| SPY 06/12/2025 572 P / DE (N/A) | 0,03 | 0,0904 | 0,0904 | ||||||
| ADI / Analog Devices, Inc. | 0,00 | 204,76 | 0,03 | 200,00 | 0,0902 | -0,0053 | |||
| APD / Air Products and Chemicals, Inc. | 0,00 | 133,33 | 0,03 | 107,69 | 0,0900 | -0,0413 | |||
| LII / Lennox International Inc. | 0,00 | 128,57 | 0,03 | 125,00 | 0,0893 | -0,0356 | |||
| GEHC / GE HealthCare Technologies Inc. | 0,00 | 204,76 | 0,03 | 145,45 | 0,0892 | -0,0196 | |||
| ROST / Ross Stores, Inc. | 0,00 | 204,76 | 0,03 | 225,00 | 0,0886 | 0,0012 | |||
| PRU / Prudential Financial, Inc. | 0,00 | 204,76 | 0,03 | 188,89 | 0,0876 | -0,0080 | |||
| MSI / Motorola Solutions, Inc. | 0,00 | 204,76 | 0,03 | 188,89 | 0,0876 | -0,0038 | |||
| IR / Ingersoll Rand Inc. | 0,00 | 204,76 | 0,03 | 225,00 | 0,0861 | -0,0020 | |||
| WAB / Westinghouse Air Brake Technologies Corporation | 0,00 | 204,76 | 0,03 | 257,14 | 0,0853 | 0,0083 | |||
| SYF / Synchrony Financial | 0,00 | 204,76 | 0,03 | 212,50 | 0,0851 | -0,0031 | |||
| UAL / United Airlines Holdings, Inc. | 0,00 | 204,76 | 0,03 | 177,78 | 0,0837 | -0,0137 | |||
| HES / Hess Corporation | 0,00 | 204,76 | 0,03 | 177,78 | 0,0836 | -0,0092 | |||
| CHTR / Charter Communications, Inc. | 0,00 | 204,76 | 0,03 | 257,14 | 0,0835 | 0,0080 | |||
| HUBB / Hubbell Incorporated | 0,00 | 204,76 | 0,02 | 242,86 | 0,0821 | 0,0050 | |||
| HPE / Hewlett Packard Enterprise Company | 0,00 | 204,76 | 0,02 | 166,67 | 0,0801 | -0,0104 | |||
| GDDY / GoDaddy Inc. | 0,00 | 204,76 | 0,02 | 228,57 | 0,0768 | 0,0023 | |||
| WAT / Waters Corporation | 0,00 | 204,76 | 0,02 | 214,29 | 0,0736 | -0,0047 | |||
| BDX / Becton, Dickinson and Company | 0,00 | 204,76 | 0,02 | 144,44 | 0,0728 | -0,0209 | |||
| A / Agilent Technologies, Inc. | 0,00 | 204,76 | 0,02 | 162,50 | 0,0708 | -0,0089 | |||
| ANSS / ANSYS, Inc. | 0,00 | 204,76 | 0,02 | 250,00 | 0,0697 | 0,0005 | |||
| CPAY / Corpay, Inc. | 0,00 | 204,76 | 0,02 | 185,71 | 0,0685 | -0,0077 | |||
| FGXXX / First American Funds Inc - First American Government Obligations Fund Class X | 0,01 | -47,12 | 0,01 | -50,00 | 0,0491 | -0,2298 | |||
| DECK / Deckers Outdoor Corporation | 0,00 | 204,76 | 0,01 | 160,00 | 0,0445 | -0,0134 | |||
| SPY 06/05/2025 549.5 P / DE (N/A) | 0,00 | 0,0020 | 0,0020 | ||||||
| SPY 06/05/2025 549.5 P / DE (N/A) | 0,00 | 0,0020 | 0,0020 | ||||||
| SPY 06/05/2025 564 P / DE (N/A) | -0,00 | -0,0068 | -0,0068 | ||||||
| SPY 06/05/2025 564 P / DE (N/A) | -0,00 | -0,0068 | -0,0068 | ||||||
| SPY 06/12/2025 584.9 P / DE (N/A) | -0,06 | -0,2089 | -0,2089 | ||||||
| SPY 06/12/2025 584.9 P / DE (N/A) | -0,06 | -0,2089 | -0,2089 | ||||||
| SPY 06/18/2025 582 P / DE (N/A) | -0,07 | -0,2244 | -0,2244 | ||||||
| SPY 06/18/2025 582 P / DE (N/A) | -0,07 | -0,2244 | -0,2244 | ||||||
| SPY 06/26/2025 587 P / DE (N/A) | -0,12 | -0,3812 | -0,3812 | ||||||
| SPY 06/26/2025 587 P / DE (N/A) | -0,12 | -0,3812 | -0,3812 |