Statistiques de base
| Valeur du portefeuille | $ 236 166 117 |
| Positions actuelles | 79 |
Dernières positions, performances, ASG (à partir des dépôts 13F, 13D)
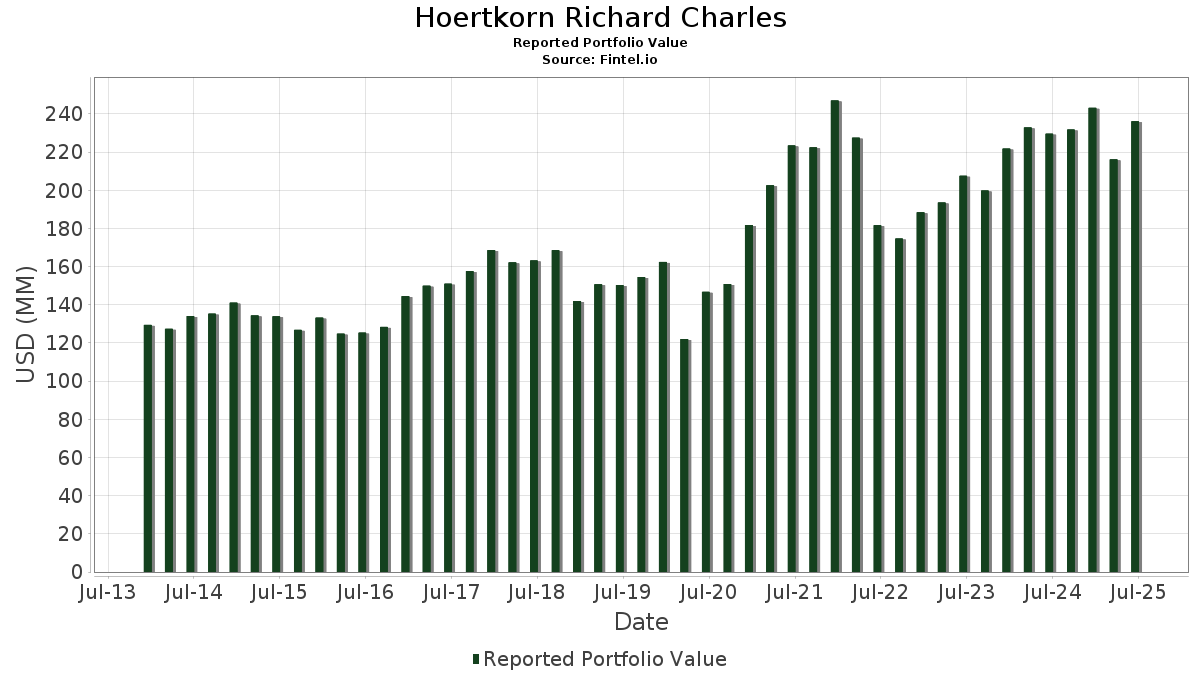
Hoertkorn Richard Charles a déclaré un total de 79 positions dans ses derniers dépôts auprès de la SEC. La valeur la plus récente du portefeuille est calculée à 236 166 117 USD. Les actifs sous gestion réels (ASG) sont cette valeur plus les liquidités (qui ne sont pas divulguées). Les principales positions de Hoertkorn Richard Charles sont Marvell Technology, Inc. (US:MRVL) , Microsoft Corporation (US:MSFT) , Apple Inc. (US:AAPL) , The Hershey Company (US:HSY) , and JPMorgan Chase & Co. (US:JPM) . Les nouvelles positions de Hoertkorn Richard Charles incluent APA Corporation (US:APA) , .
Meilleures augmentations ce trimestre
Nous utilisons la variation de l'allocation du portefeuille car il s'agit de l'indicateur le plus significatif. Les changements peuvent être dus à des transactions ou à des variations de prix des actions.
| Titre | Actions (en millions) |
Valeur ($ en millions) |
% du portefeuille | ΔPortefeuille % |
|---|---|---|---|---|
| 0,04 | 20,86 | 8,8288 | 1,4782 | |
| 0,02 | 8,95 | 3,7887 | 1,3984 | |
| 0,27 | 21,02 | 8,8983 | 1,1896 | |
| 0,07 | 17,34 | 7,3429 | 1,1018 | |
| 0,05 | 15,19 | 6,4339 | 0,3862 | |
| 0,01 | 2,13 | 0,9021 | 0,3504 | |
| 0,03 | 7,04 | 2,9795 | 0,3214 | |
| 0,01 | 1,22 | 0,5178 | 0,1795 | |
| 0,07 | 11,91 | 5,0396 | 0,0981 | |
| 0,28 | 13,40 | 5,6730 | 0,0978 |
Principales baisses ce trimestre
Nous utilisons la variation de l'allocation du portefeuille car il s'agit de l'indicateur le plus significatif. Les changements peuvent être dus à des transactions ou à des variations de prix des actions.
| Titre | Actions (en millions) |
Valeur ($ en millions) |
% du portefeuille | ΔPortefeuille % |
|---|---|---|---|---|
| 0,10 | 19,86 | 8,4077 | -1,7775 | |
| 0,04 | 9,75 | 4,1259 | -1,1453 | |
| 0,06 | 10,13 | 4,2890 | -0,7594 | |
| 0,12 | 3,67 | 1,5516 | -0,4870 | |
| 0,50 | 14,80 | 6,2622 | -0,4296 | |
| 0,02 | 7,33 | 3,1028 | -0,2972 | |
| 0,03 | 3,02 | 1,2762 | -0,2901 | |
| 0,01 | 1,98 | 0,8371 | -0,2577 | |
| 0,01 | 2,88 | 1,2171 | -0,2267 | |
| 0,00 | 1,72 | 0,7266 | -0,1736 |
Déclarations 13F et dépôts de fonds
Ce formulaire a été déposé le 2025-07-07 pour la période de déclaration 2025-06-30. Cliquez sur l'icône du lien pour voir l'historique complet des transactions.
Mettre à niveau pour débloquer les données premium et exporter vers Excel ![]() .
.
| Titre | Type | Prix moyen de l'action | Actions (en millions) |
ΔActions (%) |
ΔActions (%) |
Valeur ($ en millions) |
Portefeuille (%) |
ΔPortefeuille (%) |
|
|---|---|---|---|---|---|---|---|---|---|
| MRVL / Marvell Technology, Inc. | 0,27 | 0,36 | 21,02 | 26,16 | 8,8983 | 1,1896 | |||
| MSFT / Microsoft Corporation | 0,04 | -0,93 | 20,86 | 31,27 | 8,8288 | 1,4782 | |||
| AAPL / Apple Inc. | 0,10 | -2,36 | 19,86 | -9,82 | 8,4077 | -1,7775 | |||
| HSY / The Hershey Company | 0,07 | -0,05 | 17,34 | 28,54 | 7,3429 | 1,1018 | |||
| JPM / JPMorgan Chase & Co. | 0,05 | -1,66 | 15,19 | 16,22 | 6,4339 | 0,3862 | |||
| KMI / Kinder Morgan, Inc. | 0,50 | -0,75 | 14,80 | 2,27 | 6,2622 | -0,4296 | |||
| BAC / Bank of America Corporation | 0,28 | -1,93 | 13,40 | 11,21 | 5,6730 | 0,0978 | |||
| GOOGL / Alphabet Inc. | 0,07 | -2,19 | 11,91 | 11,46 | 5,0396 | 0,0981 | |||
| PG / The Procter & Gamble Company | 0,06 | -0,68 | 10,13 | -7,15 | 4,2890 | -0,7594 | |||
| TMUS / T-Mobile US, Inc. | 0,04 | -4,24 | 9,75 | -14,45 | 4,1259 | -1,1453 | |||
| GEV / GE Vernova Inc. | 0,02 | -0,06 | 8,95 | 73,23 | 3,7887 | 1,3984 | |||
| SCHWAB CHARLES CORP NEW / (808513015) | 0,09 | 8,22 | 0,0000 | ||||||
| HD / The Home Depot, Inc. | 0,02 | -0,34 | 7,33 | -0,30 | 3,1028 | -0,2972 | |||
| BA / The Boeing Company | 0,03 | -0,33 | 7,04 | 22,45 | 2,9795 | 0,3214 | |||
| PYPL / PayPal Holdings, Inc. | 0,06 | -0,22 | 4,22 | 13,67 | 1,7882 | 0,0693 | |||
| CSCO / Cisco Systems, Inc. | 0,06 | 0,41 | 3,95 | 12,88 | 1,6700 | 0,0532 | |||
| F / Ford Motor Company | 0,35 | -0,43 | 3,80 | 7,72 | 1,6081 | -0,0229 | |||
| DVN / Devon Energy Corporation | 0,12 | -2,20 | 3,67 | -16,81 | 1,5516 | -0,4870 | |||
| PARA / Paramount Global | 0,25 | 0,91 | 3,29 | 8,84 | 1,3911 | -0,0058 | |||
| APA / APA Corporation | 0,17 | 3,17 | 0,0000 | ||||||
| XOM / Exxon Mobil Corporation | 0,03 | -1,76 | 3,02 | -10,96 | 1,2762 | -0,2901 | |||
| MCD / McDonald's Corporation | 0,01 | -1,50 | 2,88 | -7,88 | 1,2171 | -0,2267 | |||
| AMZN / Amazon.com, Inc. | 0,01 | 0,00 | 2,48 | 15,27 | 1,0513 | 0,0549 | |||
| NVDD / Direxion Shares ETF Trust - Direxion Daily NVDA Bear 1X Shares | 0,01 | 22,58 | 2,13 | 78,78 | 0,9021 | 0,3504 | |||
| CVX / Chevron Corporation | 0,01 | -2,37 | 1,98 | -16,44 | 0,8371 | -0,2577 | |||
| INTC / Intel Corporation | 0,08 | -0,49 | 1,83 | -1,82 | 0,7755 | -0,0880 | |||
| BRK.B / Berkshire Hathaway Inc. | 0,00 | -3,28 | 1,72 | -11,82 | 0,7266 | -0,1736 | |||
| DIS / The Walt Disney Company | 0,01 | -20,16 | 1,60 | 0,31 | 0,6756 | -0,0605 | |||
| CBRE / CBRE Group, Inc. | 0,01 | 0,00 | 1,39 | 7,64 | 0,5904 | -0,0088 | |||
| AMD / Advanced Micro Devices, Inc. | 0,01 | 21,08 | 1,22 | 67,17 | 0,5178 | 0,1795 | |||
| COP / ConocoPhillips | 0,01 | -0,96 | 1,21 | -15,40 | 0,5119 | -0,1492 | |||
| JNJ / Johnson & Johnson | 0,01 | -3,99 | 1,05 | -11,58 | 0,4431 | -0,1045 | |||
| CG / The Carlyle Group Inc. | 0,02 | -16,67 | 1,03 | -1,72 | 0,4353 | -0,0487 | |||
| GOOG / Alphabet Inc. | 0,00 | -8,89 | 0,61 | 3,41 | 0,2572 | -0,0145 | |||
| LLY / Eli Lilly and Company | 0,00 | 0,00 | 0,55 | -5,71 | 0,2311 | -0,0364 | |||
| ITW / Illinois Tool Works Inc. | 0,00 | 0,00 | 0,49 | -0,40 | 0,2093 | -0,0202 | |||
| BABA / Alibaba Group Holding Limited - Depositary Receipt (Common Stock) | 0,00 | 0,00 | 0,40 | -14,25 | 0,1684 | -0,0462 | |||
| KO / The Coca-Cola Company | 0,00 | 0,00 | 0,33 | -1,22 | 0,1379 | -0,0147 | |||
| DNP / DNP Select Income Fund Inc. | 0,03 | 0,00 | 0,25 | -0,78 | 0,1072 | -0,0112 | |||
| VOOG / Vanguard Admiral Funds - Vanguard S&P 500 Growth ETF | 0,00 | 0,00 | 0,21 | 18,54 | 0,0897 | 0,0070 | |||
| RTX / RTX Corporation | 0,00 | 0,00 | 0,20 | 10,56 | 0,0844 | 0,0007 | |||
| JHI / John Hancock Investors Trust | 0,01 | 0,00 | 0,19 | 2,12 | 0,0820 | -0,0058 | |||
| BX / Blackstone Inc. | 0,00 | 0,00 | 0,18 | 6,71 | 0,0744 | -0,0016 | |||
| PFE / Pfizer Inc. | 0,01 | 0,00 | 0,13 | -4,55 | 0,0537 | -0,0076 | |||
| PEP / PepsiCo, Inc. | 0,00 | 0,00 | 0,12 | -12,23 | 0,0520 | -0,0125 | |||
| T / AT&T Inc. | 0,00 | 0,00 | 0,12 | 1,77 | 0,0490 | -0,0033 | |||
| PSA / Public Storage | 0,00 | 0,00 | 0,10 | -1,89 | 0,0444 | -0,0051 | |||
| MMT / MFS Multimarket Income Trust | 0,02 | 0,00 | 0,10 | 0,98 | 0,0438 | -0,0036 | |||
| NTRS / Northern Trust Corporation | 0,00 | 0,00 | 0,10 | 29,49 | 0,0429 | 0,0064 | |||
| SBUX / Starbucks Corporation | 0,00 | -9,52 | 0,09 | -14,71 | 0,0369 | -0,0108 | |||
| KMB / Kimberly-Clark Corporation | 0,00 | 0,00 | 0,08 | -9,09 | 0,0341 | -0,0070 | |||
| OTIS / Otis Worldwide Corporation | 0,00 | 0,00 | 0,07 | -4,29 | 0,0286 | -0,0040 | |||
| SCHB / Schwab Strategic Trust - Schwab U.S. Broad Market ETF | 0,00 | -8,15 | 0,06 | 1,72 | 0,0250 | -0,0019 | |||
| YUM / Yum! Brands, Inc. | 0,00 | 0,00 | 0,06 | -5,17 | 0,0233 | -0,0037 | |||
| VV / Vanguard Index Funds - Vanguard Large-Cap ETF | 0,00 | 0,00 | 0,04 | 10,81 | 0,0175 | 0,0003 | |||
| O / Realty Income Corporation | 0,00 | 0,00 | 0,04 | 0,00 | 0,0162 | -0,0016 | |||
| META / Meta Platforms, Inc. | 0,00 | 0,00 | 0,03 | 27,27 | 0,0122 | 0,0018 | |||
| WYNN / Wynn Resorts, Limited | 0,00 | -25,00 | 0,03 | -15,15 | 0,0119 | -0,0036 | |||
| SLB / Schlumberger Limited | 0,00 | 0,00 | 0,02 | -22,22 | 0,0093 | -0,0033 | |||
| GEHC / GE HealthCare Technologies Inc. | 0,00 | 0,00 | 0,02 | -8,70 | 0,0092 | -0,0017 | |||
| PFG / Principal Financial Group, Inc. | 0,00 | 0,00 | 0,02 | -4,55 | 0,0091 | -0,0015 | |||
| ERTH / Invesco Exchange-Traded Fund Trust - Invesco MSCI Sustainable Future ETF | 0,00 | 0,00 | 0,02 | 11,76 | 0,0081 | 0,0000 | |||
| AWR / American States Water Company | 0,00 | -32,66 | 0,02 | -33,33 | 0,0076 | -0,0051 | |||
| V / Visa Inc. | 0,00 | 0,00 | 0,02 | 0,00 | 0,0069 | -0,0005 | |||
| TCBK / TriCo Bancshares | 0,00 | 0,00 | 0,01 | 0,00 | 0,0061 | -0,0005 | |||
| TSLA / Tesla, Inc. | 0,00 | 50,00 | 0,01 | 80,00 | 0,0040 | 0,0016 | |||
| C / Citigroup Inc. | 0,00 | 0,00 | 0,01 | 14,29 | 0,0036 | 0,0003 | |||
| KIM / Kimco Realty Corporation | 0,00 | -36,17 | 0,01 | -36,36 | 0,0031 | -0,0023 | |||
| XYZ / Block, Inc. | 0,00 | 0,00 | 0,01 | 20,00 | 0,0029 | 0,0004 | |||
| TLSI / TriSalus Life Sciences, Inc. | 0,00 | 0,00 | 0,00 | 0,00 | 0,0015 | -0,0002 | |||
| BP / BP p.l.c. - Depositary Receipt (Common Stock) | 0,00 | 0,00 | 0,00 | -33,33 | 0,0013 | -0,0003 | |||
| ESPR / Esperion Therapeutics, Inc. | 0,00 | 0,00 | 0,00 | -50,00 | 0,0008 | -0,0005 | |||
| SPOT / Spotify Technology S.A. | 0,00 | 0,00 | 0,00 | 0,00 | 0,0006 | 0,0001 | |||
| CMCSA / Comcast Corporation | 0,00 | 0,00 | 0,00 | 0,00 | 0,0005 | -0,0001 | |||
| MAT / Mattel, Inc. | 0,00 | 0,00 | 0,00 | 0,0003 | -0,0000 | ||||
| EA / Electronic Arts Inc. | 0,00 | 0,00 | 0,00 | 0,0001 | 0,0000 | ||||
| CHDN / Churchill Downs Incorporated | 0,00 | 0,00 | 0,00 | 0,0000 | -0,0000 | ||||
| HAL / Halliburton Company | 0,00 | 0,00 | 0,00 | 0,0000 | -0,0000 | ||||
| HAS / Hasbro, Inc. | 0,00 | 0,00 | 0,00 | 0,0000 | 0,0000 | ||||
| IVZ / Invesco Ltd. | 0,00 | -100,00 | 0,00 | 0,0000 |