Statistiques de base
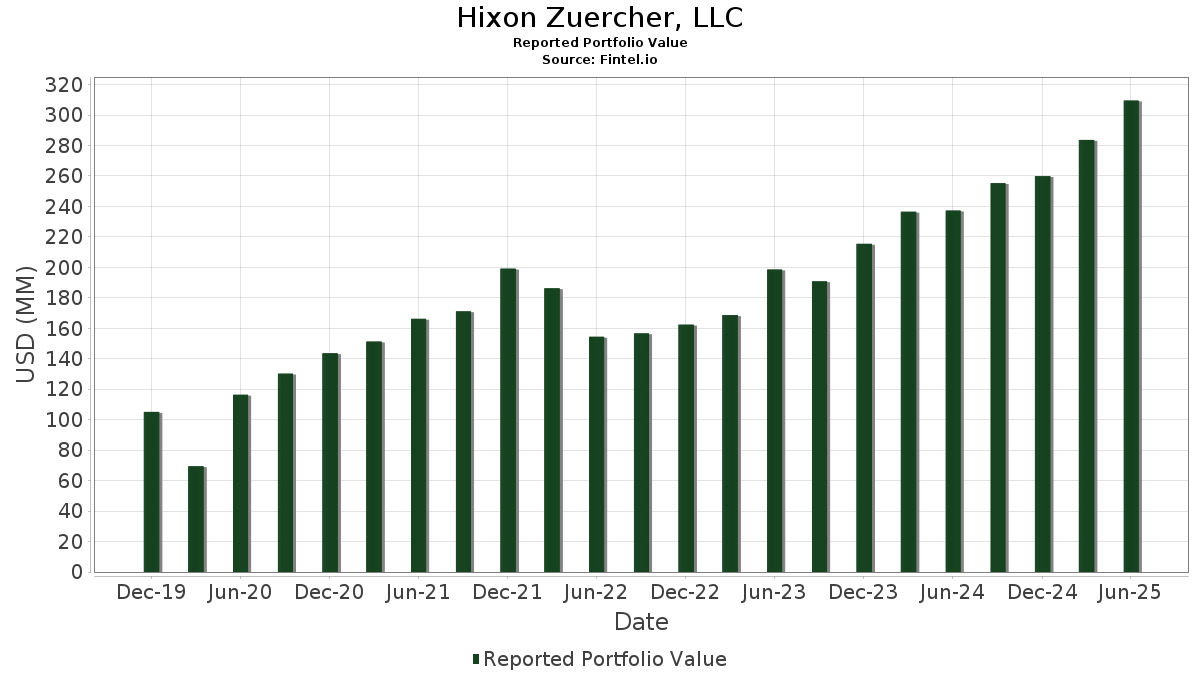
| Valeur du portefeuille | $ 309 478 408 |
| Positions actuelles | 78 |
Dernières positions, performances, ASG (à partir des dépôts 13F, 13D)
Hixon Zuercher, LLC a déclaré un total de 78 positions dans ses derniers dépôts auprès de la SEC. La valeur la plus récente du portefeuille est calculée à 309 478 408 USD. Les actifs sous gestion réels (ASG) sont cette valeur plus les liquidités (qui ne sont pas divulguées). Les principales positions de Hixon Zuercher, LLC sont Goldman Sachs ETF Trust - Goldman Sachs ActiveBeta International Equity ETF (US:GSIE) , Goldman Sachs ETF Trust - Goldman Sachs ActiveBeta U.S. Large Cap Equity ETF (US:GSLC) , JPMorgan Chase & Co. (US:JPM) , Microsoft Corporation (US:MSFT) , and Stryker Corporation (US:SYK) .
Meilleures augmentations ce trimestre
Nous utilisons la variation de l'allocation du portefeuille car il s'agit de l'indicateur le plus significatif. Les changements peuvent être dus à des transactions ou à des variations de prix des actions.
| Titre | Actions (en millions) |
Valeur ($ en millions) |
% du portefeuille | ΔPortefeuille % |
|---|---|---|---|---|
| 0,02 | 9,16 | 2,9587 | 0,8021 | |
| 0,05 | 7,82 | 2,5284 | 0,6013 | |
| 0,04 | 4,54 | 1,4662 | 0,5468 | |
| 0,02 | 3,14 | 1,0162 | 0,5070 | |
| 0,00 | 6,39 | 2,0644 | 0,4797 | |
| 0,01 | 6,96 | 2,2480 | 0,3702 | |
| 0,01 | 2,97 | 0,9582 | 0,2904 | |
| 0,01 | 6,04 | 1,9506 | 0,2773 | |
| 0,03 | 1,59 | 0,5125 | 0,2725 | |
| 0,01 | 2,46 | 0,7952 | 0,2564 |
Principales baisses ce trimestre
Nous utilisons la variation de l'allocation du portefeuille car il s'agit de l'indicateur le plus significatif. Les changements peuvent être dus à des transactions ou à des variations de prix des actions.
| Titre | Actions (en millions) |
Valeur ($ en millions) |
% du portefeuille | ΔPortefeuille % |
|---|---|---|---|---|
| 0,02 | 5,21 | 1,6841 | -0,4447 | |
| 0,05 | 7,69 | 2,4852 | -0,4295 | |
| 0,01 | 1,49 | 0,4803 | -0,4054 | |
| 0,03 | 6,80 | 2,1976 | -0,3729 | |
| 0,06 | 6,07 | 1,9614 | -0,3699 | |
| 0,01 | 4,83 | 1,5604 | -0,3146 | |
| 0,03 | 4,04 | 1,3048 | -0,2794 | |
| 0,10 | 6,67 | 2,1538 | -0,2113 | |
| 0,04 | 2,65 | 0,8559 | -0,1937 | |
| 0,03 | 9,87 | 3,1878 | -0,1860 |
Déclarations 13F et dépôts de fonds
Ce formulaire a été déposé le 2025-07-31 pour la période de déclaration 2025-06-30. Cliquez sur l'icône du lien pour voir l'historique complet des transactions.
Mettre à niveau pour débloquer les données premium et exporter vers Excel ![]() .
.
| Titre | Type | Prix moyen de l'action | Actions (en millions) |
ΔActions (%) |
ΔActions (%) |
Valeur ($ en millions) |
Portefeuille (%) |
ΔPortefeuille (%) |
|
|---|---|---|---|---|---|---|---|---|---|
| GSIE / Goldman Sachs ETF Trust - Goldman Sachs ActiveBeta International Equity ETF | 0,55 | 1,03 | 22,00 | 12,39 | 7,1097 | 0,2078 | |||
| GSLC / Goldman Sachs ETF Trust - Goldman Sachs ActiveBeta U.S. Large Cap Equity ETF | 0,09 | -5,60 | 10,32 | 4,09 | 3,3353 | -0,1610 | |||
| JPM / JPMorgan Chase & Co. | 0,03 | -12,77 | 9,87 | 3,09 | 3,1878 | -0,1860 | |||
| MSFT / Microsoft Corporation | 0,02 | 12,97 | 9,16 | 49,68 | 2,9587 | 0,8021 | |||
| SYK / Stryker Corporation | 0,02 | 0,50 | 8,99 | 6,81 | 2,9060 | -0,0628 | |||
| EMGF / iShares, Inc. - iShares Emerging Markets Equity Factor ETF | 0,17 | 1,46 | 8,71 | 12,93 | 2,8136 | 0,0952 | |||
| CAT / Caterpillar Inc. | 0,02 | -8,65 | 8,31 | 7,52 | 2,6853 | -0,0396 | |||
| JHMM / John Hancock Exchange-Traded Fund Trust - John Hancock Multifactor Mid Cap ETF | 0,13 | 9,34 | 8,20 | 16,65 | 2,6485 | 0,1712 | |||
| NVDA / NVIDIA Corporation | 0,05 | -1,79 | 7,82 | 43,17 | 2,5284 | 0,6013 | |||
| JNJ / Johnson & Johnson | 0,05 | 1,01 | 7,69 | -6,96 | 2,4852 | -0,4295 | |||
| MA / Mastercard Incorporated | 0,01 | -0,69 | 7,38 | 1,81 | 2,3858 | -0,1711 | |||
| AMZN / Amazon.com, Inc. | 0,03 | 0,23 | 7,32 | 15,59 | 2,3643 | 0,1323 | |||
| GS / The Goldman Sachs Group, Inc. | 0,01 | 0,82 | 6,96 | 30,62 | 2,2480 | 0,3702 | |||
| AAPL / Apple Inc. | 0,03 | 0,99 | 6,80 | -6,71 | 2,1976 | -0,3729 | |||
| NEE / NextEra Energy, Inc. | 0,10 | 1,47 | 6,67 | -0,64 | 2,1538 | -0,2113 | |||
| NFLX / Netflix, Inc. | 0,00 | -1,02 | 6,39 | 42,15 | 2,0644 | 0,4797 | |||
| XOM / Exxon Mobil Corporation | 0,06 | 1,28 | 6,07 | -8,21 | 1,9614 | -0,3699 | |||
| HON / Honeywell International Inc. | 0,03 | 2,99 | 6,04 | 13,26 | 1,9513 | 0,0717 | |||
| META / Meta Platforms, Inc. | 0,01 | -0,68 | 6,04 | 27,18 | 1,9506 | 0,2773 | |||
| COST / Costco Wholesale Corporation | 0,01 | 0,95 | 5,81 | 5,65 | 1,8785 | -0,0615 | |||
| WMT / Walmart Inc. | 0,06 | -0,17 | 5,39 | 11,19 | 1,7403 | 0,0326 | |||
| LOW / Lowe's Companies, Inc. | 0,02 | -9,26 | 5,21 | -13,68 | 1,6841 | -0,4447 | |||
| GOOGL / Alphabet Inc. | 0,03 | -1,99 | 4,94 | 11,67 | 1,5952 | 0,0369 | |||
| TLT / iShares Trust - iShares 20+ Year Treasury Bond ETF | 0,05 | 4,87 | 4,85 | 1,68 | 1,5659 | -0,1146 | |||
| SHV / iShares Trust - iShares Short Treasury Bond ETF | 0,04 | 1,88 | 4,83 | 1,85 | 1,5622 | -0,1115 | |||
| BRK.B / Berkshire Hathaway Inc. | 0,01 | -0,45 | 4,83 | -9,20 | 1,5604 | -0,3146 | |||
| SCHW / The Charles Schwab Corporation | 0,05 | -0,03 | 4,63 | 16,52 | 1,4949 | 0,0950 | |||
| DELL / Dell Technologies Inc. | 0,04 | 29,37 | 4,54 | 74,03 | 1,4662 | 0,5468 | |||
| CPRT / Copart, Inc. | 0,09 | 21,21 | 4,36 | 5,09 | 1,4075 | -0,0537 | |||
| PEP / PepsiCo, Inc. | 0,03 | 2,05 | 4,04 | -10,13 | 1,3048 | -0,2794 | |||
| CRM / Salesforce, Inc. | 0,01 | 0,55 | 3,92 | 2,16 | 1,2661 | -0,0861 | |||
| DOX / Amdocs Limited | 0,04 | -0,15 | 3,63 | -0,44 | 1,1731 | -0,1125 | |||
| AMD / Advanced Micro Devices, Inc. | 0,02 | 2,03 | 3,42 | 40,94 | 1,1060 | 0,2497 | |||
| BAC / Bank of America Corporation | 0,07 | 1,72 | 3,30 | 15,33 | 1,0649 | 0,0575 | |||
| ADBE / Adobe Inc. | 0,01 | 1,95 | 3,22 | 2,84 | 1,0398 | -0,0634 | |||
| JPST / J.P. Morgan Exchange-Traded Fund Trust - JPMorgan Ultra-Short Income ETF | 0,06 | 5,46 | 3,16 | 5,58 | 1,0209 | -0,0343 | |||
| MANH / Manhattan Associates, Inc. | 0,02 | 90,80 | 3,14 | 117,73 | 1,0162 | 0,5070 | |||
| ABT / Abbott Laboratories | 0,02 | -0,06 | 3,14 | 2,48 | 1,0158 | -0,0658 | |||
| DIS / The Walt Disney Company | 0,02 | 1,24 | 3,01 | 27,23 | 0,9724 | 0,1383 | |||
| ORCL / Oracle Corporation | 0,01 | 0,11 | 2,97 | 56,55 | 0,9582 | 0,2904 | |||
| TDG / TransDigm Group Incorporated | 0,00 | 0,05 | 2,93 | 9,98 | 0,9473 | 0,0075 | |||
| PGR / The Progressive Corporation | 0,01 | 34,60 | 2,91 | 26,96 | 0,9403 | 0,1319 | |||
| DLR / Digital Realty Trust, Inc. | 0,02 | -0,17 | 2,78 | 21,44 | 0,8969 | 0,0912 | |||
| GSSC / Goldman Sachs ETF Trust - Goldman Sachs ActiveBeta U.S. Small Cap Equity ETF | 0,04 | -17,74 | 2,65 | -11,05 | 0,8559 | -0,1937 | |||
| SBUX / Starbucks Corporation | 0,03 | 0,90 | 2,58 | -5,77 | 0,8340 | -0,1314 | |||
| AVGO / Broadcom Inc. | 0,01 | -2,19 | 2,46 | 61,06 | 0,7952 | 0,2564 | |||
| HCA / HCA Healthcare, Inc. | 0,01 | -0,36 | 2,46 | 10,48 | 0,7937 | 0,0098 | |||
| EW / Edwards Lifesciences Corporation | 0,03 | 0,74 | 2,40 | 8,68 | 0,7766 | -0,0029 | |||
| APD / Air Products and Chemicals, Inc. | 0,01 | 2,22 | 2,35 | -2,24 | 0,7603 | -0,0883 | |||
| APH / Amphenol Corporation | 0,02 | -1,38 | 2,34 | 48,54 | 0,7556 | 0,2003 | |||
| ICE / Intercontinental Exchange, Inc. | 0,01 | 0,28 | 2,34 | 6,67 | 0,7549 | -0,0174 | |||
| BKR / Baker Hughes Company | 0,06 | 2,49 | 2,33 | -10,60 | 0,7526 | -0,1658 | |||
| ZTS / Zoetis Inc. | 0,01 | 65,25 | 2,31 | 56,46 | 0,7480 | 0,2266 | |||
| PPG / PPG Industries, Inc. | 0,02 | 1,34 | 2,25 | 5,38 | 0,7277 | -0,0255 | |||
| PLD / Prologis, Inc. | 0,02 | 2,82 | 2,09 | -3,33 | 0,6765 | -0,0869 | |||
| PFE / Pfizer Inc. | 0,08 | 3,55 | 2,03 | -0,98 | 0,6552 | -0,0665 | |||
| DE / Deere & Company | 0,00 | 0,03 | 1,92 | 8,35 | 0,6210 | -0,0043 | |||
| AMT / American Tower Corporation | 0,01 | 0,96 | 1,80 | 2,57 | 0,5811 | -0,0372 | |||
| DG / Dollar General Corporation | 0,02 | -2,34 | 1,75 | 27,02 | 0,5655 | 0,0798 | |||
| AEP / American Electric Power Company, Inc. | 0,02 | 1,40 | 1,60 | -3,74 | 0,5159 | -0,0687 | |||
| NYT / The New York Times Company | 0,03 | 106,47 | 1,59 | 133,09 | 0,5125 | 0,2725 | |||
| MCD / McDonald's Corporation | 0,01 | -36,74 | 1,49 | -40,84 | 0,4803 | -0,4054 | |||
| TSCO / Tractor Supply Company | 0,03 | 2,37 | 1,48 | -1,92 | 0,4777 | -0,0539 | |||
| QCOM / QUALCOMM Incorporated | 0,01 | 4,67 | 1,41 | 8,55 | 0,4553 | -0,0025 | |||
| LLY / Eli Lilly and Company | 0,00 | 0,00 | 1,39 | -5,62 | 0,4506 | -0,0703 | |||
| CDW / CDW Corporation | 0,01 | 4,80 | 1,34 | 16,83 | 0,4330 | 0,0285 | |||
| OC / Owens Corning | 0,01 | 4,12 | 1,23 | 0,25 | 0,3963 | -0,0350 | |||
| MPC / Marathon Petroleum Corporation | 0,00 | 0,04 | 0,75 | 14,00 | 0,2423 | 0,0105 | |||
| V / Visa Inc. | 0,00 | 0,00 | 0,71 | 1,29 | 0,2284 | -0,0176 | |||
| HSY / The Hershey Company | 0,00 | 2,38 | 0,68 | -0,59 | 0,2195 | -0,0216 | |||
| TSLA / Tesla, Inc. | 0,00 | -0,05 | 0,67 | 22,53 | 0,2164 | 0,0237 | |||
| JEPI / J.P. Morgan Exchange-Traded Fund Trust - JPMorgan Equity Premium Income ETF | 0,01 | 10,20 | 0,63 | 9,62 | 0,2028 | 0,0010 | |||
| GJR / Strats Trust For Procter & Gambel Security - Preferred Security | 0,00 | -23,71 | 0,60 | -28,67 | 0,1946 | -0,1031 | |||
| ABBV / AbbVie Inc. | 0,00 | 0,07 | 0,54 | -11,28 | 0,1730 | -0,0399 | |||
| HDV / iShares Trust - iShares Core High Dividend ETF | 0,00 | 4,06 | 0,46 | 0,65 | 0,1503 | -0,0126 | |||
| DVY / iShares Trust - iShares Select Dividend ETF | 0,00 | 5,28 | 0,46 | 4,04 | 0,1497 | -0,0072 | |||
| JKHY / Jack Henry & Associates, Inc. | 0,00 | 0,00 | 0,45 | -1,32 | 0,1454 | -0,0154 | |||
| MMM / 3M Company | 0,00 | 0,00 | 0,27 | 3,79 | 0,0885 | -0,0047 | |||
| ILMN / Illumina, Inc. | 0,00 | -100,00 | 0,00 | 0,0000 | |||||
| MKTX / MarketAxess Holdings Inc. | 0,00 | -100,00 | 0,00 | 0,0000 |